Measurement of the $B_c^+$ meson lifetime using $B_c^+ \to J/\psi\mu^+ \nu_{\mu} X$ decays
[to restricted-access page]Information
LHCb-PAPER-2013-063
CERN-PH-EP-2014-008
arXiv:1401.6932 [PDF]
(Submitted on 27 Jan 2014)
Eur. Phys. J. C74 (2014) 2839
Inspire 1278863
Tools
Abstract
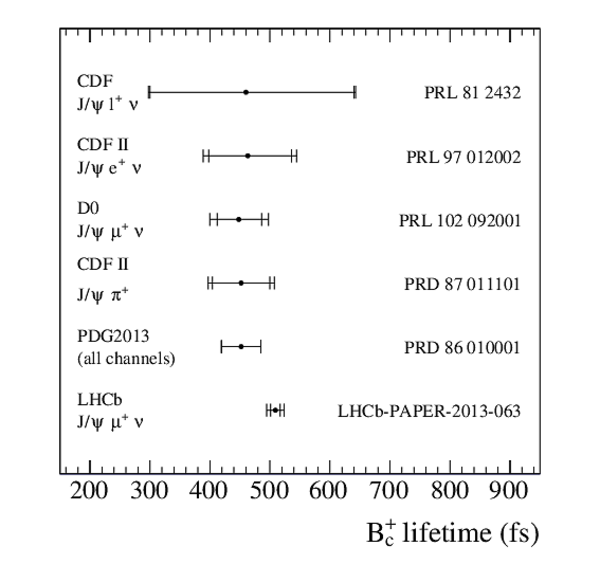
The lifetime of the $B_c^+$ meson is measured using semileptonic decays having a $J / \psi$ meson and a muon in the final state. The data, corresponding to an integrated luminosity of $2\mathrm{ fb^{-1}}$, are collected by the LHCb detector in $pp$ collisions at a centre-of-mass energy of $8 \mathrm{TeV}$. The measured lifetime is $$\tau = 509 \pm 8 \pm 12 \mathrm{ fs},$$ where the first uncertainty is statistical and the second is systematic.
Figures and captions
|
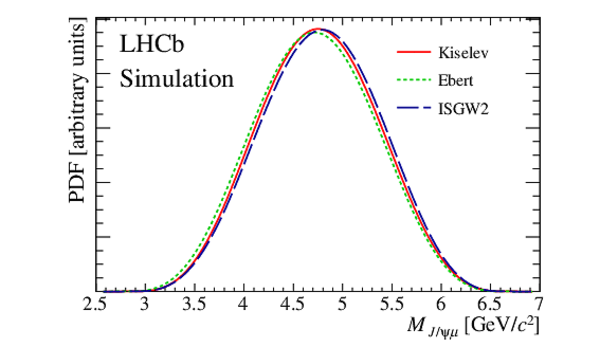
Distributions of $ M_{ { J \mskip -3mu/\mskip -2mu\psi \mskip 2mu} \mu}$ , without simulation of detector response, for the Kiselev (red solid line), Ebert (green short-dashed line), and ISGW2 (black long-dashed line) models. |
fig1.pdf [15 KiB] HiDef png [192 KiB] Thumbnail [136 KiB] *.C file |
|
|
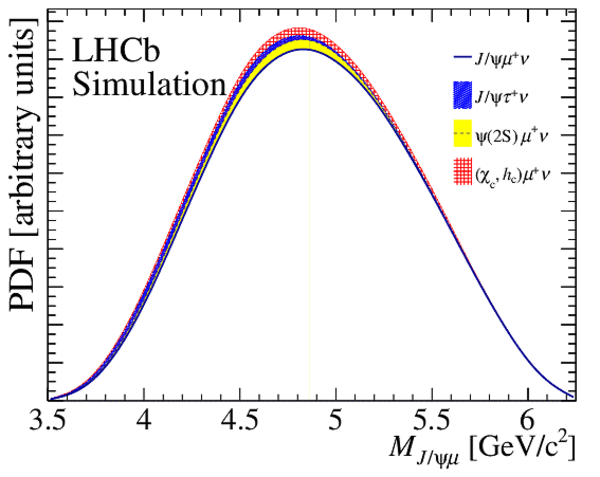
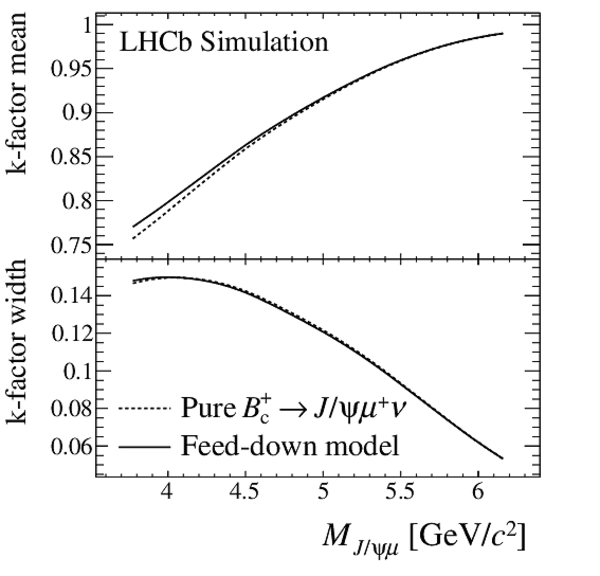
Corrections to the (a) $ M_{ { J \mskip -3mu/\mskip -2mu\psi \mskip 2mu} \mu}$ and (b) $k$-factor model due to the contribution of feed-down modes after the selection. The contribution to the $ M_{ { J \mskip -3mu/\mskip -2mu\psi \mskip 2mu} \mu}$ distribution from $ B _ c ^+ \rightarrow { J \mskip -3mu/\mskip -2mu\psi \mskip 2mu} \mu ^+ \nu _\mu $ decays alone is shown by the black solid curve, while the inclusion of each modelled feed-down contribution is shown by the shaded areas according to the legend. The mean and r.m.s. width of the $k$-factor distribution are shown as a function of $ M_{ { J \mskip -3mu/\mskip -2mu\psi \mskip 2mu} \mu}$ before (solid line) and after (dashed line) the inclusion of feed-down modes. |
fig2a.pdf [32 KiB] HiDef png [311 KiB] Thumbnail [210 KiB] *.C file |
|
|
fig2b.pdf [15 KiB] HiDef png [165 KiB] Thumbnail [93 KiB] *.C file |
|
|
|
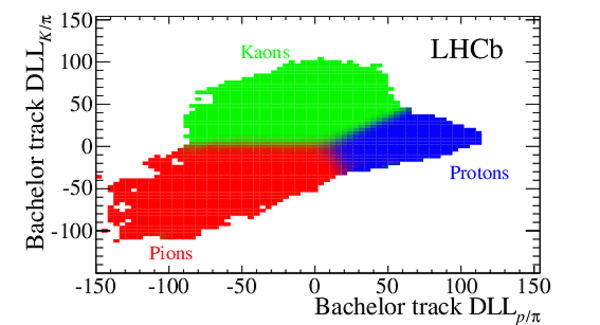
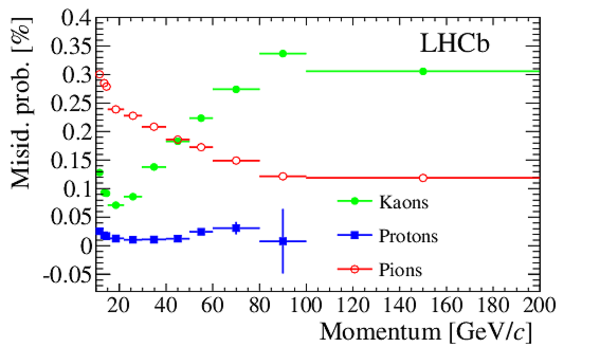
Result of a fit in the ($\mathrm{DLL} _{p/\pi}, \mathrm{DLL} _{K/\pi}$) plane to determine the fractions of hadron species in the $ { J \mskip -3mu/\mskip -2mu\psi \mskip 2mu}$ -track sample. The colour of each bin is built as a combination of red, green and blue proportional to the fitted fractions of pions, kaons and protons, respectively. |
fig3.pdf [21 KiB] HiDef png [196 KiB] Thumbnail [229 KiB] *.C file |
|
|
fig4.pdf [15 KiB] HiDef png [160 KiB] Thumbnail [154 KiB] *.C file |
|
|
|
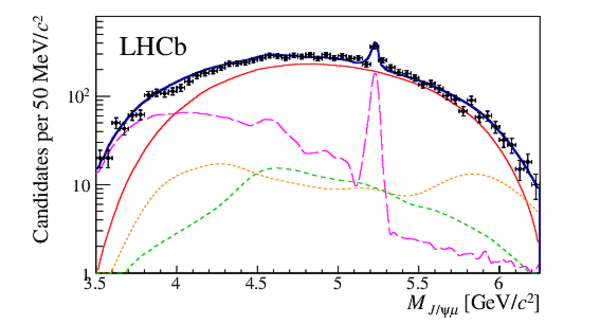
Dimuon mass distribution for the $ { J \mskip -3mu/\mskip -2mu\psi \mskip 2mu}$ candidates. The selected signal region is shown by the central light-shaded area. The sidebands used for the estimation of the fake $ { J \mskip -3mu/\mskip -2mu\psi \mskip 2mu}$ background are shown by the dark-shaded areas, and the function modelling such background by the solid red curve. |
fig5.pdf [19 KiB] HiDef png [484 KiB] Thumbnail [167 KiB] *.C file |

|
|
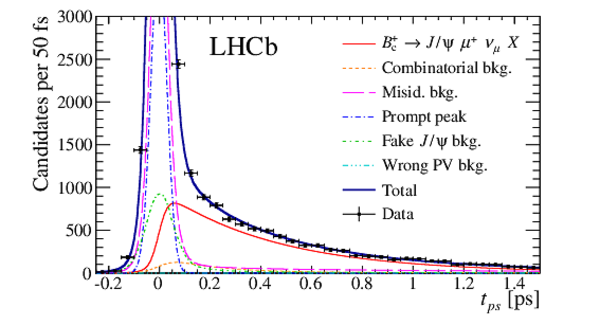
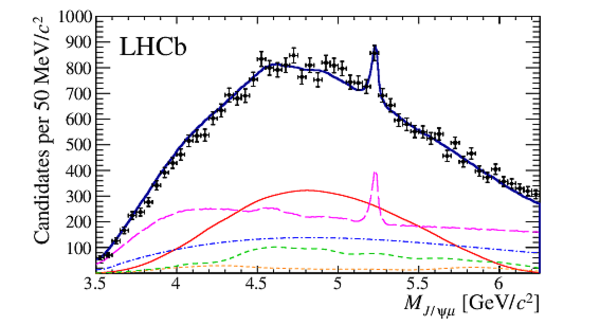
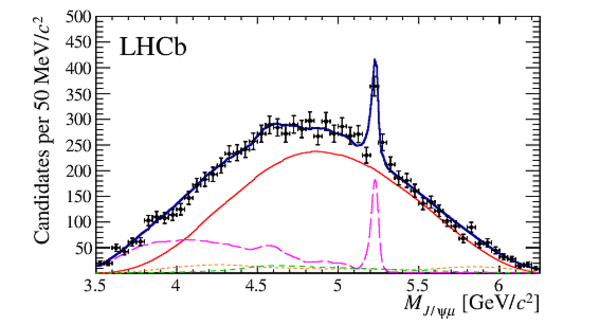
Result of the two-dimensional fit of the $ B _ c ^+ \rightarrow { J \mskip -3mu/\mskip -2mu\psi \mskip 2mu} \mu ^+ \nu _\mu X$ model. Projections of the total fit function and its components are shown for (a) the pseudo-proper time , (b) the mass of all events, and (c) the mass of the detached events ($ t_{\mathrm{ps}} > 150$ fs). |
fig6a.pdf [322 KiB] HiDef png [290 KiB] Thumbnail [200 KiB] *.C file |

|
|
fig6b.pdf [64 KiB] HiDef png [203 KiB] Thumbnail [138 KiB] *.C file |

|
|
|
fig6c.pdf [59 KiB] HiDef png [240 KiB] Thumbnail [146 KiB] *.C file |
|
|
|
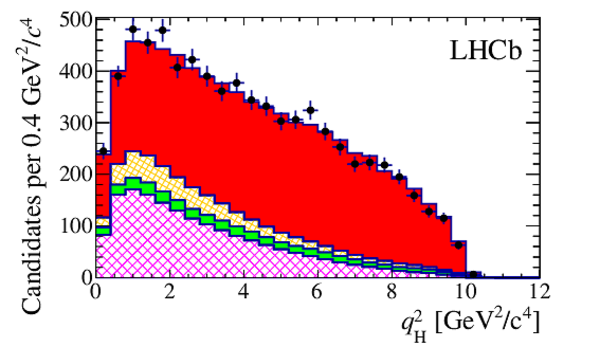
Binned distributions of (a) $ M_{ { J \mskip -3mu/\mskip -2mu\psi \mskip 2mu} \mu}$ , and (b,c) the two $q^2$ solutions for events in the detached region. The modelled contributions for misidentification background (hatched dark violet), fake $ { J \mskip -3mu/\mskip -2mu\psi \mskip 2mu}$ background (filled light green), combinatorial background (hatched light orange) and signal (filled dark red), are shown, stacked on each other. Markers representing data are superimposed. The background yields and {PDF }s are obtained with the techniques described in Sec. 5, and only the signal yield is obtained from the fit to the data. |
fig7a.pdf [23 KiB] HiDef png [336 KiB] Thumbnail [224 KiB] *.C file |

|
|
fig7b.pdf [20 KiB] HiDef png [332 KiB] Thumbnail [196 KiB] *.C file |
|
|
|
fig7c.pdf [20 KiB] HiDef png [333 KiB] Thumbnail [195 KiB] *.C file |

|
|
|
Effect of a generic deformation of the signal model: (a) offset to the lifetime value (expressed in fs) as a function of the deformation parameters; (b) fit projection for the $ M_{ { J \mskip -3mu/\mskip -2mu\psi \mskip 2mu} \mu}$ variable in the detached region after applying the deformation maximising the agreement with data ($\alpha_\psi = \alpha_\nu$ = 0.3 $c^2\mathrm{ Ge V} ^{-1}$). The colour scale on the upper plot indicates the $p$-value of the goodness-of-fit test on the three decay kinematic distributions. The solid blue (dashed red) lines shows the region having $p$-value greater than 32% for the $ M_{ { J \mskip -3mu/\mskip -2mu\psi \mskip 2mu} \mu}$ ($q^2$) test only. The filled (empty) blue marker indicates the deformation parameters that fit best the Ebert (ISGW2) model. The fit components shown on the lower plot follow the legend of Fig. 6. |
fig8.pdf [20 KiB] HiDef png [645 KiB] Thumbnail [389 KiB] *.C file |

|
|
fig8b.pdf [59 KiB] HiDef png [225 KiB] Thumbnail [148 KiB] *.C file |

|
|
|
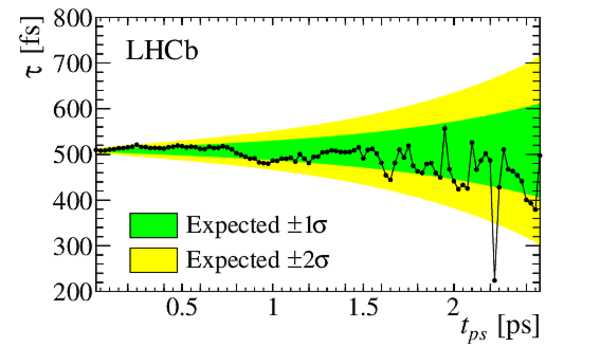
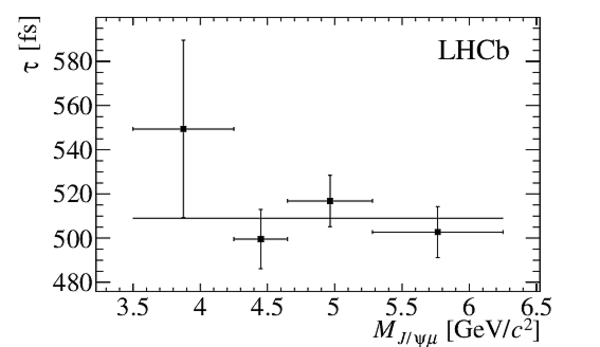
Lifetime results obtained after reducing the range of the $ t_{\mathrm{ps}}$ and $ M_{ { J \mskip -3mu/\mskip -2mu\psi \mskip 2mu} \mu}$ variables (a) removing the events with $ t_{\mathrm{ps}}$ lower than the threshold reported on the $x$-axis and, (b) dividing events in bins of $ M_{ { J \mskip -3mu/\mskip -2mu\psi \mskip 2mu} \mu}$ . The dark (light) shaded band on (a) shows the expected $\pm$1(2) statistical standard deviation ($\sigma$) of the lifetime variation due to the reduced sample size. The horizontal line on (b) shows the lifetime result of the nominal fit. |
fig9a_[..].pdf [20 KiB] HiDef png [171 KiB] Thumbnail [141 KiB] *.C file |
|
|
fig9b.pdf [13 KiB] HiDef png [73 KiB] Thumbnail [40 KiB] *.C file |
|
|
|
Animated gif made out of all figures. |
PAPER-2013-063.gif Thumbnail |

|
![HiDef png [192 KiB]](Directory_LHCb-PAPER-2013-063/hidef_fig1.png)
![HiDef png [311 KiB]](Directory_LHCb-PAPER-2013-063/hidef_fig2a.png)
![HiDef png [165 KiB]](Directory_LHCb-PAPER-2013-063/hidef_fig2b.png)
![HiDef png [196 KiB]](Directory_LHCb-PAPER-2013-063/hidef_fig3.png)
![HiDef png [160 KiB]](Directory_LHCb-PAPER-2013-063/hidef_fig4.png)
![HiDef png [484 KiB]](Directory_LHCb-PAPER-2013-063/hidef_fig5.png)
![HiDef png [290 KiB]](Directory_LHCb-PAPER-2013-063/hidef_fig6a.png)
![HiDef png [203 KiB]](Directory_LHCb-PAPER-2013-063/hidef_fig6b.png)
![HiDef png [240 KiB]](Directory_LHCb-PAPER-2013-063/hidef_fig6c.png)
![HiDef png [336 KiB]](Directory_LHCb-PAPER-2013-063/hidef_fig7a.png)
![HiDef png [332 KiB]](Directory_LHCb-PAPER-2013-063/hidef_fig7b.png)
![HiDef png [333 KiB]](Directory_LHCb-PAPER-2013-063/hidef_fig7c.png)
![HiDef png [645 KiB]](Directory_LHCb-PAPER-2013-063/hidef_fig8.png)
![HiDef png [225 KiB]](Directory_LHCb-PAPER-2013-063/hidef_fig8b.png)
![HiDef png [171 KiB]](Directory_LHCb-PAPER-2013-063/hidef_fig9a_fullColor.png)
![HiDef png [73 KiB]](Directory_LHCb-PAPER-2013-063/hidef_fig9b.png)
Tables and captions
|
Systematic uncertainties on the $ B _ c ^+$ lifetime. |
Table_1.pdf [41 KiB] HiDef png [143 KiB] Thumbnail [66 KiB] tex code |

|
![HiDef png [143 KiB]](Directory_LHCb-PAPER-2013-063/hidef_Table_1.png)
Supplementary Material [file]
|
File LHCb-PAPER-2013-063-supplementary.zip contains the following figures: SupplementaryFig1 : Comparison of the result of this determination of the B_c^+ meson lifetime with those from previous measurements SupplementaryFig2a : Result of the two-dimensional fit of the B_c^+ -> J/psi mu^+ nu X model -- Time projection SupplementaryFig2b : Result of the two-dimensional fit of the B_c^+ -> J/psi mu^+ nu X model -- Mass projection SupplementaryFig2c : Result of the two-dimensional fit of the B_c^+ -> J/psi mu^+ nu X model -- Mass projection for t_ps > 150 fs SupplementaryFig3 : Mass projection of the model for t_ps > 150 fs after applying a signal deformation which maximise compatibility with data |
Supple[..].pdf [14 KiB] HiDef png [185 KiB] Thumbnail [168 KiB] *C file |
|
|
Supple[..].pdf [90 KiB] HiDef png [272 KiB] Thumbnail [198 KiB] *C file |
|
|
|
Supple[..].pdf [67 KiB] HiDef png [260 KiB] Thumbnail [192 KiB] *C file |
|
|
|
Supple[..].pdf [60 KiB] HiDef png [240 KiB] Thumbnail [180 KiB] *C file |

|
|
|
Supple[..].pdf [60 KiB] HiDef png [237 KiB] Thumbnail [177 KiB] *C file |
|
![HiDef png [185 KiB]](Directory_LHCb-PAPER-2013-063/supplementary/hidef_SupplementaryFig1.png)
![HiDef png [272 KiB]](Directory_LHCb-PAPER-2013-063/supplementary/hidef_SupplementaryFig2a.png)
![HiDef png [260 KiB]](Directory_LHCb-PAPER-2013-063/supplementary/hidef_SupplementaryFig2b.png)
![HiDef png [240 KiB]](Directory_LHCb-PAPER-2013-063/supplementary/hidef_SupplementaryFig2c.png)
![HiDef png [237 KiB]](Directory_LHCb-PAPER-2013-063/supplementary/hidef_SupplementaryFig3.png)
Created on 26 April 2024.