Measurement of $\Upsilon$ production in $pp$ collisions at $\sqrt{s}=2.76$ TeV
[to restricted-access page]Information
LHCb-PAPER-2013-066
CERN-PH-EP-2014-016
arXiv:1402.2539 [PDF]
(Submitted on 11 Feb 2014)
Eur. Phys. J. C74 (2014) 2835
Inspire 1280929
Tools
Abstract
The production of Upsilon(1S), Upsilon(2S) and Upsilon(3S) mesons decaying into the dimuon final state is studied with the LHCb detector using a data sample corresponding to an integrated luminosity of 3.3 pb^{-1} collected in proton-proton collisions at a centre-of-mass energy of sqrt{s}=2.76 TeV. The differential production cross-sections times dimuon branching fractions are measured as functions of the Upsilon transverse momentum and rapidity, over the ranges p_T<15 GeV/c and 2.0<y<4.5. The total cross-sections in this kinematic region, assuming unpolarised production, are measured to be sigma(pp -> Upsilon(1S) X) x B(Upsilon(1S) -> mu+mu-) = 1.111 +/- 0.043 +/- 0.044 nb, sigma(pp -> Upsilon(2S) X) x B(Upsilon(2S) -> mu+mu-) = 0.264 +/- 0.023 +/- 0.011 nb, sigma(pp -> Upsilon(3S) X) x B(Upsilon(3S) -> mu+mu-) = 0.159 +/- 0.020 +/- 0.007 nb, where the first uncertainty is statistical and the second systematic.
Figures and captions
|
Invariant mass distribution of selected $\Upsilon \rightarrow \mu ^+\mu ^- $ candidates with $ p_{\rm T} <15 {\mathrm{ Ge V /}c} $ and $2.0<y<4.5$. The result of the fit described in the text is illustrated with a red solid line, while the signal and background components are shown with magenta dotted and blue dashed lines, respectively. The three peaks correspond to the $\Upsilon(1\mathrm{S}) $, $\Upsilon(2\mathrm{S}) $ and $\Upsilon(3\mathrm{S}) $ mesons (from left to right). |
Fig_1.pdf [101 KiB] HiDef png [251 KiB] Thumbnail [237 KiB] *.C file tex code |

|
|
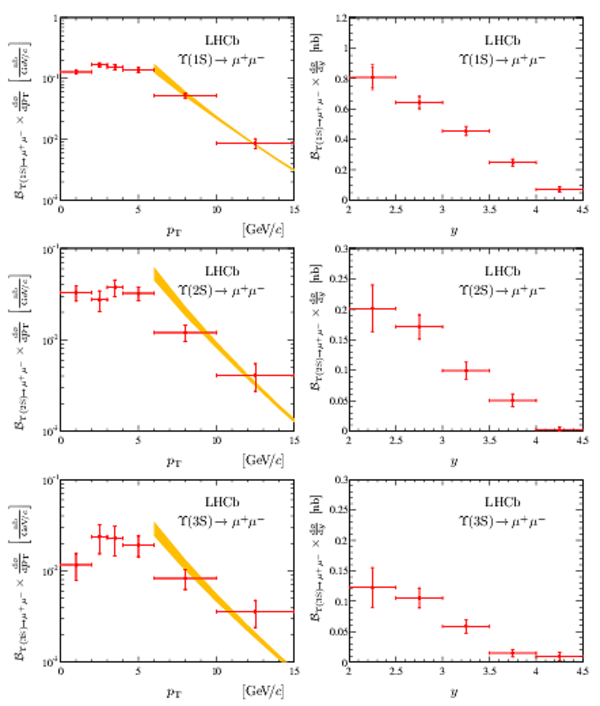
Differential cross-sections for $\Upsilon(1\mathrm{S})$ , $\Upsilon(2\mathrm{S})$ and $\Upsilon(3\mathrm{S})$ mesons times dimuon branching fractions as functions of $p_{\rm T}$ (left) and $y$ (right). The inner error bars indicate the statistical uncertainty, while the outer error bars indicate the sum of statistical and systematic uncertainties in quadrature. The next-to-leading order non-relativistic QCD predictions [18] are shown by the solid yellow band. |
Fig_2.pdf [182 KiB] HiDef png [316 KiB] Thumbnail [329 KiB] *.C file tex code |
|
|
Ratios of the $\Upsilon(2\mathrm{S}) $ to $\Upsilon(1\mathrm{S}) $ and $\Upsilon(3\mathrm{S}) $ to $\Upsilon(1\mathrm{S}) $ cross-sections times dimuon branching fractions as functions of $p_{\rm T}$ and $y$. The error bars indicate the total uncertainties of the results obtained by adding statistical and systematic uncertainties in quadrature. |
Fig_3.pdf [89 KiB] HiDef png [208 KiB] Thumbnail [225 KiB] *.C file tex code |

|
|
Animated gif made out of all figures. |
PAPER-2013-066.gif Thumbnail |

|
![HiDef png [251 KiB]](Directory_LHCb-PAPER-2013-066/hidef_Fig_1.png)
![HiDef png [316 KiB]](Directory_LHCb-PAPER-2013-066/hidef_Fig_2.png)
![HiDef png [208 KiB]](Directory_LHCb-PAPER-2013-066/hidef_Fig_3.png)
Tables and captions
|
Relative systematic uncertainties (in $\%$) affecting the \Upsilon production cross-section measurements in the full kinematic region. The total uncertainties are obtained by adding the individual effects in quadrature. |
Table_1.pdf [33 KiB] HiDef png [69 KiB] Thumbnail [31 KiB] tex code |

|
|
Cross-sections for $\Upsilon(1\mathrm{S})$ , $\Upsilon(2\mathrm{S})$ and $\Upsilon(3\mathrm{S})$ mesons times dimuon branching fractions (in $\rm nb$ ) in bins of $p_{\rm T}$ and $y$ without normalisation to the bin sizes. The first uncertainty is statistical and the second is systematic. |
Table_2.pdf [43 KiB] HiDef png [158 KiB] Thumbnail [65 KiB] tex code |

|
|
Ratios of the $\Upsilon(2\mathrm{S}) $ to $\Upsilon(1\mathrm{S}) $ and $\Upsilon(3\mathrm{S}) $ to $\Upsilon(1\mathrm{S}) $ cross-sections times dimuon branching fractions as functions of $p_{\rm T}$ and $y$. The first uncertainty is statistical and the second is systematic. |
Table_3.pdf [43 KiB] HiDef png [123 KiB] Thumbnail [60 KiB] tex code |

|
![HiDef png [69 KiB]](Directory_LHCb-PAPER-2013-066/hidef_Table_1.png)
![HiDef png [158 KiB]](Directory_LHCb-PAPER-2013-066/hidef_Table_2.png)
![HiDef png [123 KiB]](Directory_LHCb-PAPER-2013-066/hidef_Table_3.png)
Created on 26 April 2024.