Measurement of charged particle multiplicities and densities in $pp$ collisions at $\sqrt{s}$ = 7 TeV in the forward region
[to restricted-access page]Information
LHCb-PAPER-2013-070
CERN-PH-EP-2014-023
arXiv:1402.4430 [PDF]
(Submitted on 18 Feb 2014)
Eur. Phys. J. C74 (2014) 2888
Inspire 1281685
Tools
Abstract
Charged particle multiplicities are studied in proton-proton collisions in the forward region at a centre-of-mass energy of $\sqrt{s} = 7\;$TeV with data collected by the LHCb detector. The forward spectrometer allows access to a kinematic range of $2.0<\eta<4.8$ in pseudorapidity, momenta down to $2\;$GeV/$c$ and transverse momenta down to $0.2\;$GeV/$c$. The measurements are performed using minimum-bias events with at least one charged particle in the kinematic acceptance. The results are presented as functions of pseudorapidity and transverse momentum and are compared to predictions from several Monte Carlo event generators.
Figures and captions
|
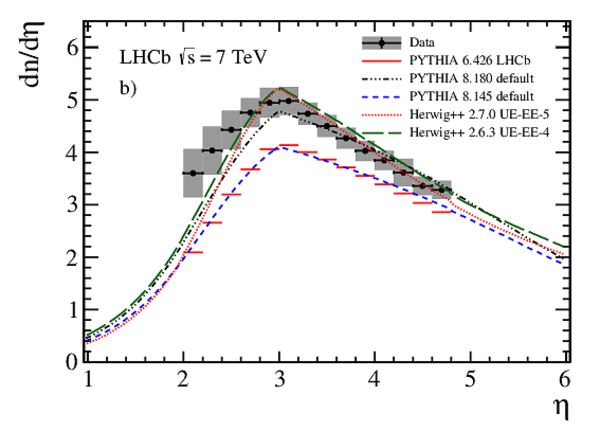
Charged particle density as a function of $\eta$. The LHCb data are shown as points with statistical error bars (smaller than the marker size) and combined systematic and statistical uncertainties as the grey band. The measurement is compared to several Monte Carlo generator predictions, (a) Pythia 6 and Phojet , (b) Pythia 8 and Herwig++ . Both plots show predictions of the LHCb tune of Pythia 6, which is used in the analysis. |
Fig_1a.pdf [16 KiB] HiDef png [201 KiB] Thumbnail [176 KiB] *.C file |

|
|
Fig_1b.pdf [18 KiB] HiDef png [241 KiB] Thumbnail [189 KiB] *.C file |
|
|
|
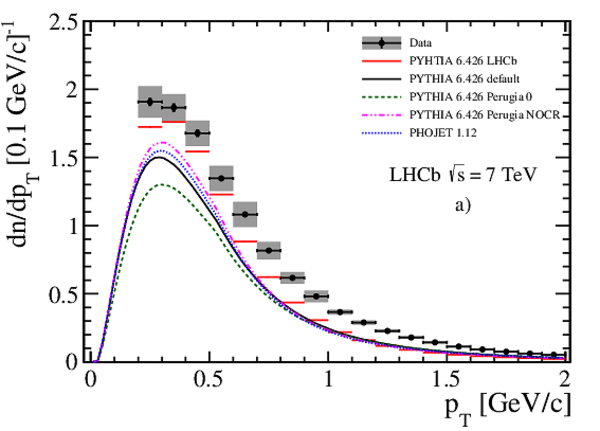
Charged particle density as a function of $p_{\rm T}$ . The LHCb data are shown as points with statistical error bars (smaller than the marker size) and combined systematic and statistical uncertainties as the grey band. The measurement is compared to several Monte Carlo generator predictions, (a) Pythia 6 and Phojet , (b) Pythia 8 and Herwig++ . Both plots show predictions of the LHCb tune of Pythia 6, which is used in the analysis. |
Fig_2a.pdf [18 KiB] HiDef png [223 KiB] Thumbnail [185 KiB] *.C file |
|
|
Fig_2b.pdf [18 KiB] HiDef png [265 KiB] Thumbnail [206 KiB] *.C file |

|
|
|
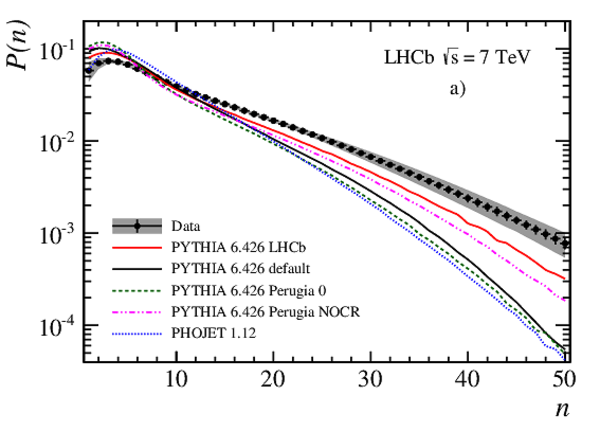
Observed charged particle multiplicity distribution in the full kinematic range of the analysis. The error bars represent the statistical uncertainty, the error band shows the combined statistical and systematic uncertainties. The data are compared to several Monte Carlo predictions, (a) Pythia 6 and Phojet , (b) Pythia 8 and Herwig++ . Both plots show predictions of the LHCb tune of Pythia 6, which is used in the analysis. |
Fig_3a.pdf [19 KiB] HiDef png [268 KiB] Thumbnail [220 KiB] *.C file |
|
|
Fig_3b.pdf [19 KiB] HiDef png [251 KiB] Thumbnail [190 KiB] *.C file |

|
|
|
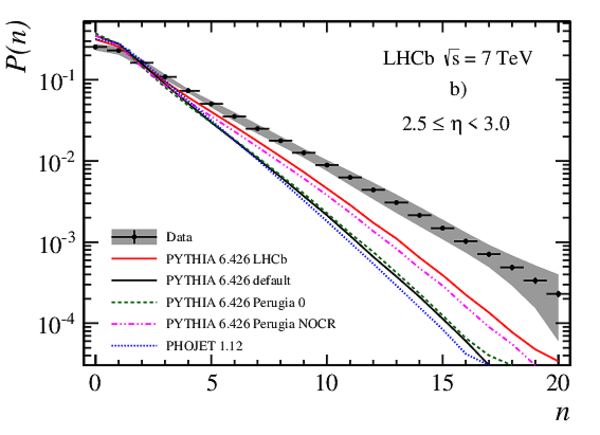
Observed charged particle multiplicity distribution in different $\eta$ bins. Error bars represent the statistical uncertainty, the error bands show the combined statistical and systematic uncertainties. The data are compared to Monte Carlo predictions, (a,b) Pythia 6 and Phojet , (c,d) Pythia 8 and Herwig++ . All plots show predictions of the LHCb tune of Pythia 6, which is used in the analysis. |
Fig_4a.pdf [16 KiB] HiDef png [252 KiB] Thumbnail [214 KiB] *.C file |

|
|
Fig_4c.pdf [16 KiB] HiDef png [264 KiB] Thumbnail [226 KiB] *.C file |

|
|
|
Fig_4b.pdf [16 KiB] HiDef png [256 KiB] Thumbnail [214 KiB] *.C file |
|
|
|
Fig_4d.pdf [16 KiB] HiDef png [281 KiB] Thumbnail [221 KiB] *.C file |

|
|
|
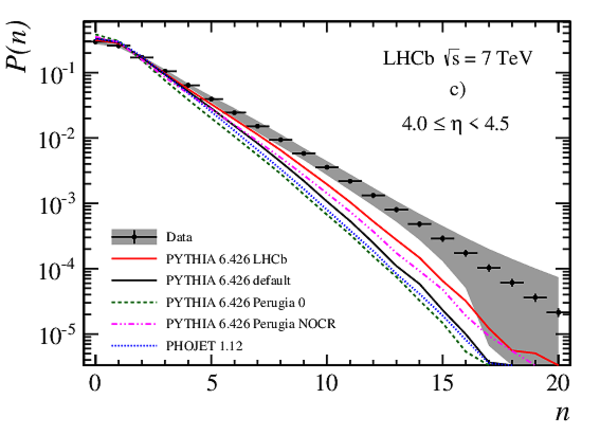
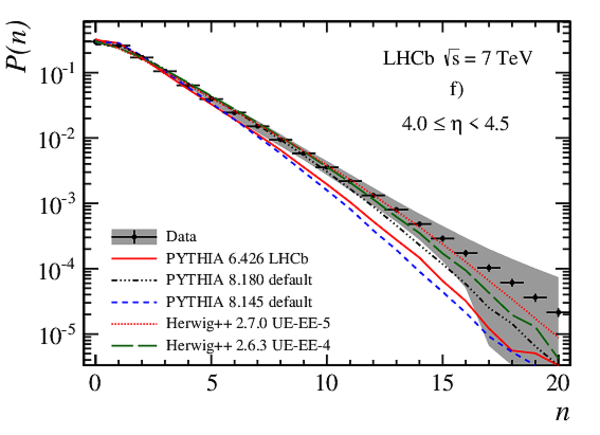
Observed charged particle multiplicity distribution in different $\eta$ bins. Error bars represent the statistical uncertainty, the error bands show the combined statistical and systematic uncertainties. The data are compared to Monte Carlo predictions, (a-c) Pythia 6 and Phojet , (d-f) Pythia 8 and Herwig++ . All plots show predictions of the LHCb tune of Pythia 6, which is used in the analysis. |
Fig_5a.pdf [16 KiB] HiDef png [254 KiB] Thumbnail [209 KiB] *.C file |

|
|
Fig_5d.pdf [16 KiB] HiDef png [285 KiB] Thumbnail [219 KiB] *.C file |

|
|
|
Fig_5b.pdf [16 KiB] HiDef png [250 KiB] Thumbnail [211 KiB] *.C file |

|
|
|
Fig_5e.pdf [16 KiB] HiDef png [286 KiB] Thumbnail [222 KiB] *.C file |

|
|
|
Fig_5c.pdf [16 KiB] HiDef png [269 KiB] Thumbnail [227 KiB] *.C file |
|
|
|
Fig_5f.pdf [16 KiB] HiDef png [296 KiB] Thumbnail [231 KiB] *.C file |
|
|
|
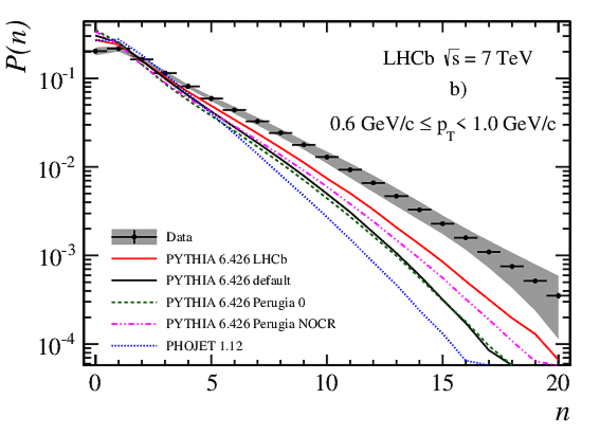
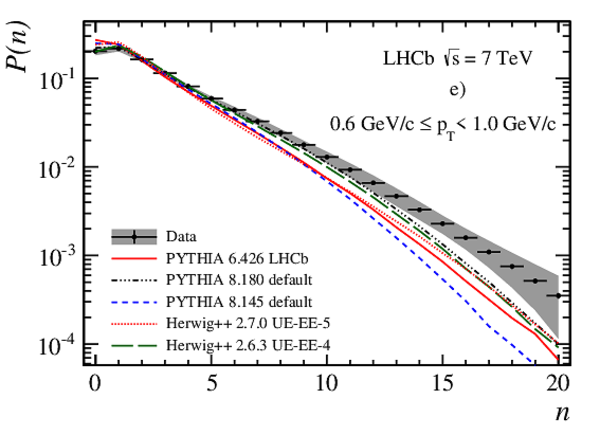
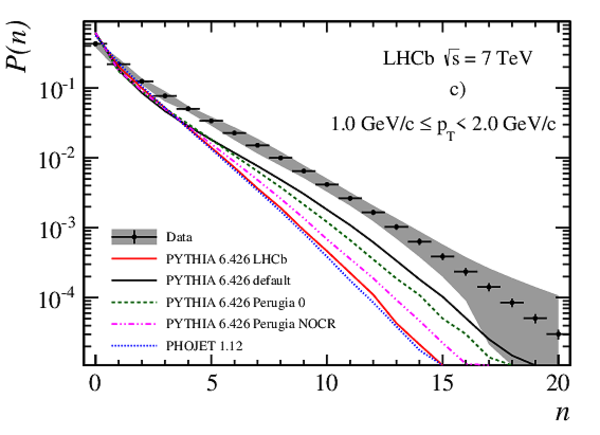
Observed charged particle multiplicity distribution in different $p_{\rm T}$ bins. Error bars represent the statistical uncertainty, the error bands show the combined statistical and systematic uncertainties. The data are compared to Monte Carlo predictions, (a,b) Pythia 6 and Phojet , (c,d) Pythia 8 and Herwig++ . All plots show predictions of the LHCb tune of Pythia 6, which is used in the analysis. |
Fig_6a.pdf [16 KiB] HiDef png [266 KiB] Thumbnail [231 KiB] *.C file |
|
|
Fig_6c.pdf [16 KiB] HiDef png [275 KiB] Thumbnail [237 KiB] *.C file |

|
|
|
Fig_6b.pdf [16 KiB] HiDef png [283 KiB] Thumbnail [233 KiB] *.C file |

|
|
|
Fig_6d.pdf [16 KiB] HiDef png [293 KiB] Thumbnail [243 KiB] *.C file |

|
|
|
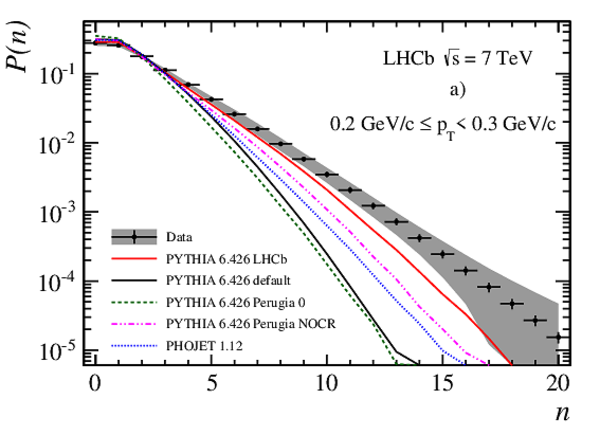
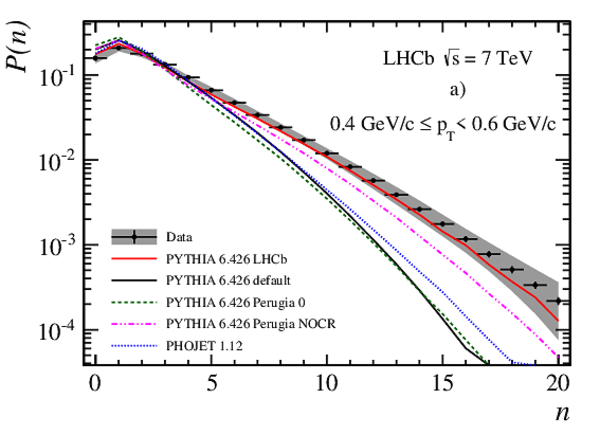
Observed charged particle multiplicity distribution in different $p_{\rm T}$ bins. Error bars represent the statistical uncertainty, the error bands show the combined statistical and systematic uncertainties. The data are compared to Monte Carlo predictions, (a-c) Pythia 6 and Phojet , (d-f) Pythia 8 and Herwig++ . All plots show predictions of the LHCb tune of Pythia 6, which is used in the analysis. |
Fig_7a.pdf [16 KiB] HiDef png [279 KiB] Thumbnail [222 KiB] *.C file |
|
|
Fig_7d.pdf [16 KiB] HiDef png [278 KiB] Thumbnail [217 KiB] *.C file |

|
|
|
Fig_7b.pdf [16 KiB] HiDef png [268 KiB] Thumbnail [223 KiB] *.C file |
|
|
|
Fig_7e.pdf [16 KiB] HiDef png [267 KiB] Thumbnail [220 KiB] *.C file |
|
|
|
Fig_7c.pdf [16 KiB] HiDef png [261 KiB] Thumbnail [229 KiB] *.C file |
|
|
|
Fig_7f.pdf [16 KiB] HiDef png [281 KiB] Thumbnail [235 KiB] *.C file |

|
|
|
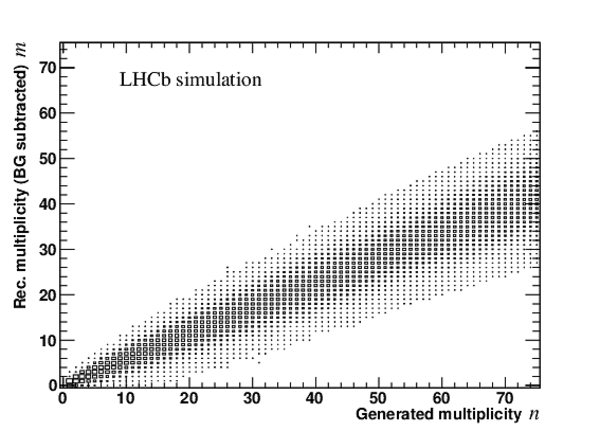
Example of the parametrized detector response matrix in the full kinematic range. The matrix is obtained from fully simulated events showing the relation between the true charged particle multiplicity and the reconstructed and background subtracted track multiplicity. |
Fig_8.pdf [35 KiB] HiDef png [251 KiB] Thumbnail [134 KiB] *.C file |
|
|
Animated gif made out of all figures. |
PAPER-2013-070.gif Thumbnail |

|
![HiDef png [201 KiB]](Directory_LHCb-PAPER-2013-070/hidef_Fig_1a.png)
![HiDef png [241 KiB]](Directory_LHCb-PAPER-2013-070/hidef_Fig_1b.png)
![HiDef png [223 KiB]](Directory_LHCb-PAPER-2013-070/hidef_Fig_2a.png)
![HiDef png [265 KiB]](Directory_LHCb-PAPER-2013-070/hidef_Fig_2b.png)
![HiDef png [268 KiB]](Directory_LHCb-PAPER-2013-070/hidef_Fig_3a.png)
![HiDef png [251 KiB]](Directory_LHCb-PAPER-2013-070/hidef_Fig_3b.png)
![HiDef png [252 KiB]](Directory_LHCb-PAPER-2013-070/hidef_Fig_4a.png)
![HiDef png [264 KiB]](Directory_LHCb-PAPER-2013-070/hidef_Fig_4c.png)
![HiDef png [256 KiB]](Directory_LHCb-PAPER-2013-070/hidef_Fig_4b.png)
![HiDef png [281 KiB]](Directory_LHCb-PAPER-2013-070/hidef_Fig_4d.png)
![HiDef png [254 KiB]](Directory_LHCb-PAPER-2013-070/hidef_Fig_5a.png)
![HiDef png [285 KiB]](Directory_LHCb-PAPER-2013-070/hidef_Fig_5d.png)
![HiDef png [250 KiB]](Directory_LHCb-PAPER-2013-070/hidef_Fig_5b.png)
![HiDef png [286 KiB]](Directory_LHCb-PAPER-2013-070/hidef_Fig_5e.png)
![HiDef png [269 KiB]](Directory_LHCb-PAPER-2013-070/hidef_Fig_5c.png)
![HiDef png [296 KiB]](Directory_LHCb-PAPER-2013-070/hidef_Fig_5f.png)
![HiDef png [266 KiB]](Directory_LHCb-PAPER-2013-070/hidef_Fig_6a.png)
![HiDef png [275 KiB]](Directory_LHCb-PAPER-2013-070/hidef_Fig_6c.png)
![HiDef png [283 KiB]](Directory_LHCb-PAPER-2013-070/hidef_Fig_6b.png)
![HiDef png [293 KiB]](Directory_LHCb-PAPER-2013-070/hidef_Fig_6d.png)
![HiDef png [279 KiB]](Directory_LHCb-PAPER-2013-070/hidef_Fig_7a.png)
![HiDef png [278 KiB]](Directory_LHCb-PAPER-2013-070/hidef_Fig_7d.png)
![HiDef png [268 KiB]](Directory_LHCb-PAPER-2013-070/hidef_Fig_7b.png)
![HiDef png [267 KiB]](Directory_LHCb-PAPER-2013-070/hidef_Fig_7e.png)
![HiDef png [261 KiB]](Directory_LHCb-PAPER-2013-070/hidef_Fig_7c.png)
![HiDef png [281 KiB]](Directory_LHCb-PAPER-2013-070/hidef_Fig_7f.png)
![HiDef png [251 KiB]](Directory_LHCb-PAPER-2013-070/hidef_Fig_8.png)
Tables and captions
|
Charged particle density as a function of pseudorapidity. The first quoted uncertainty is statistical and the second systematic. |
Table_1.pdf [30 KiB] HiDef png [213 KiB] Thumbnail [105 KiB] tex code |

|
|
Charged particle density as a function of transverse momentum. The first quoted uncertainty is statistical and the second systematic. |
Table_2.pdf [45 KiB] HiDef png [173 KiB] Thumbnail [32 KiB] tex code |

|
|
Truncated mean value and root-mean-square deviation for charged particle multiplicities in different $\eta$-bins. The range is from 0 to 20 particles. The first quoted uncertainty is statistical and the second systematic. |
Table_3.pdf [31 KiB] HiDef png [72 KiB] Thumbnail [35 KiB] tex code |

|
|
Truncated mean value and root-mean-square deviation for charged particle multiplicities in different $p_{\rm T}$ -bins. The range is from 0 to 20 particles. The first quoted uncertainty is statistical and the second systematic. |
Table_4.pdf [38 KiB] HiDef png [58 KiB] Thumbnail [26 KiB] tex code |

|
![HiDef png [213 KiB]](Directory_LHCb-PAPER-2013-070/hidef_Table_1.png)
![HiDef png [173 KiB]](Directory_LHCb-PAPER-2013-070/hidef_Table_2.png)
![HiDef png [72 KiB]](Directory_LHCb-PAPER-2013-070/hidef_Table_3.png)
![HiDef png [58 KiB]](Directory_LHCb-PAPER-2013-070/hidef_Table_4.png)
Created on 27 April 2024.