Precision measurement of the ratio of the $\Lambda^0_b$ to $\overline{B}^0$ lifetimes
[to restricted-access page]Information
LHCb-PAPER-2014-003
CERN-PH-EP-2014-027
arXiv:1402.6242 [PDF]
(Submitted on 25 Feb 2014)
Phys. Lett. B734 (2014) 122
Inspire 1282444
Tools
Abstract
The LHCb measurement of the lifetime ratio of the $\Lambda^0_b$ to the $\overline{B}^0$ meson is updated using data corresponding to an integrated luminosity of 3.0 fb$^{-1}$ collected using 7 and 8 TeV centre-of-mass energy $pp$ collisions at the LHC. The decay modes used are $\overline{B}^0\to J/\psi p K^-$ and $\overline{B}^0\to J/\psi \pi^+ K^-$, where the $\pi^+K^-$ mass is consistent with that of the $\overline{K}^{*0}(892)$ meson. The lifetime ratio is determined with unprecedented precision to be $0.974\pm0.006\pm0.004$, where the first uncertainty is statistical and the second systematic. This result is in agreement with original theoretical predictions based on the heavy quark expansion. Using the current world average of the $\overline{B}^0$ lifetime, the $\Lambda^0_b$ lifetime is found to be $1.479 \pm 0.009 \pm 0.010$ ps.
Figures and captions
|
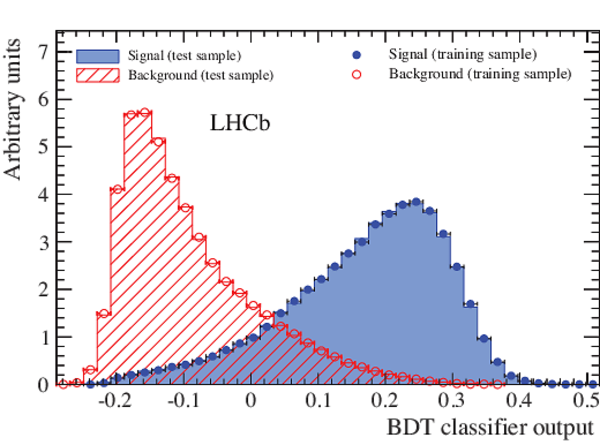
BDT classifier output for the signal and background. Both training and test samples are shown; their definitions are given in the text. |
BDT_re[..].pdf [41 KiB] HiDef png [553 KiB] Thumbnail [310 KiB] *.C file |
|
|
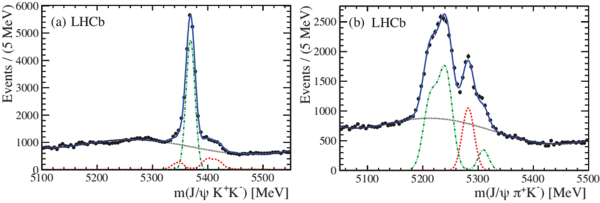
Fits to the invariant mass spectrum of (a) $ { J \mskip -3mu/\mskip -2mu\psi \mskip 2mu} pK^-$ and (b) $ { J \mskip -3mu/\mskip -2mu\psi \mskip 2mu} \pi^+K^-$ combinations. The $\Lambda ^0_ b $ and $\overline{ B }{} ^0$ signals are shown by the (magenta) solid curves. The (black) dotted lines are the combinatorial backgrounds, and the (blue) solid curves show the totals. In (a) the $\overline{ B }{} ^0_ s \rightarrow { J \mskip -3mu/\mskip -2mu\psi \mskip 2mu} K^+K^-$ and $\overline{ B }{} ^0 \rightarrow { J \mskip -3mu/\mskip -2mu\psi \mskip 2mu} \pi^+K^-$ reflections, caused by particle misidentification, are shown with the (brown) dot-dot-dashed and (red) dot-dashed shapes, respectively, and the (green) dashed shape represents the doubly misidentified $ { J \mskip -3mu/\mskip -2mu\psi \mskip 2mu} K^{+}\overline{p}$ final state, where the kaon and proton masses are swapped. In (b) the $ B ^0_ s \rightarrow { J \mskip -3mu/\mskip -2mu\psi \mskip 2mu} \pi^+K^-$ mode is shown by the (red) dashed curve and the (green) dot-dashed shape represents the $\Lambda ^0_ b \rightarrow { J \mskip -3mu/\mskip -2mu\psi \mskip 2mu} p K ^- $ reflection. |
signal[..].pdf [37 KiB] HiDef png [239 KiB] Thumbnail [185 KiB] *.C file |

|
|
Invariant mass distributions of $ { J \mskip -3mu/\mskip -2mu\psi \mskip 2mu} pK^-$ data candidates in the sideband regions $60-200$ MeV on either side of the $\Lambda ^0_ b $ mass peak, reinterpreted as misidentified (a) $\overline{ B }{} ^0_ s \rightarrow { J \mskip -3mu/\mskip -2mu\psi \mskip 2mu} K^+K^-$ and (b) $\overline{ B }{} ^0 \rightarrow { J \mskip -3mu/\mskip -2mu\psi \mskip 2mu} \pi^+ K ^- $ combinations through appropriate mass reassignments. The (red) dashed curves show the $\overline{ B }{} ^0 $ contributions and the (green) dot-dashed curves show $\overline{ B }{} ^0_ s $ contributions. The (black) dotted curves represent the polynomial background and the (blue) solid curves the total. |
LbRefl.pdf [37 KiB] HiDef png [291 KiB] Thumbnail [165 KiB] *.C file |
|
|
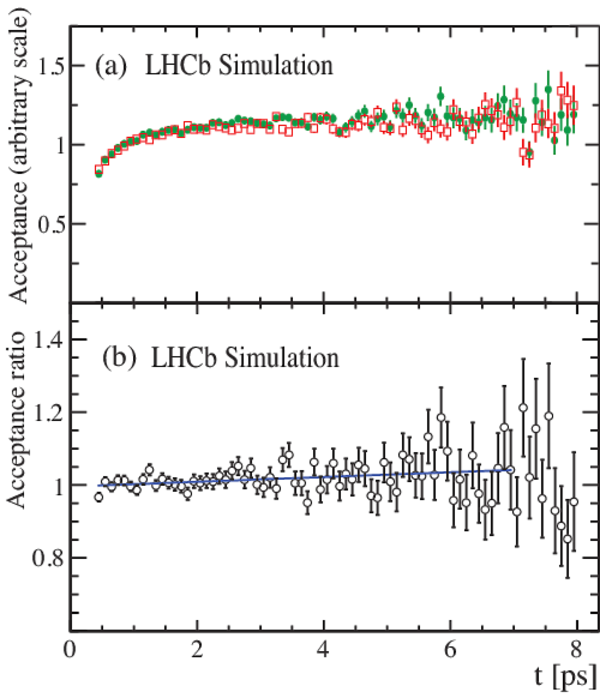
(a) Decay time acceptances (arbitrary scale) from simulation for (green) circles $\Lambda ^0_ b \rightarrow { J \mskip -3mu/\mskip -2mu\psi \mskip 2mu} pK^-$, and (red) open-boxes $\overline{ B }{} ^0 \rightarrow { J \mskip -3mu/\mskip -2mu\psi \mskip 2mu} \overline{ K }{} ^{*0} (892)$ decays. (b) Ratio of the decay time acceptances between $\Lambda ^0_ b \rightarrow { J \mskip -3mu/\mskip -2mu\psi \mskip 2mu} pK^-$ and $\overline{ B }{} ^0 \rightarrow { J \mskip -3mu/\mskip -2mu\psi \mskip 2mu} \overline{ K }{} ^{*0} (892)$ decays obtained from simulation. The (blue) line shows the result of the linear fit. |
Accept[..].pdf [46 KiB] HiDef png [341 KiB] Thumbnail [332 KiB] *.C file |
|
|
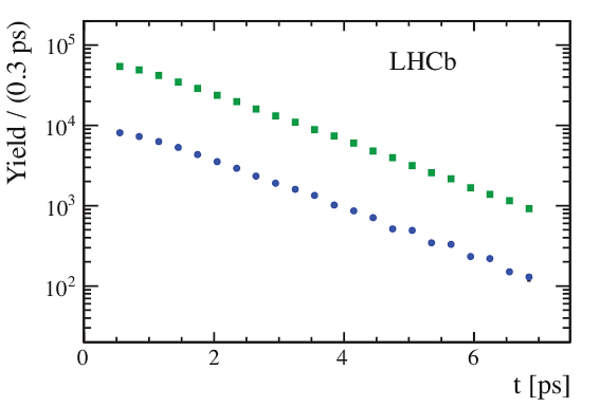
Decay time distributions for $\Lambda ^0_ b \rightarrow { J \mskip -3mu/\mskip -2mu\psi \mskip 2mu} pK^-$ shown as (blue) circles, and $\overline{ B }{} ^0 \rightarrow { J \mskip -3mu/\mskip -2mu\psi \mskip 2mu} \overline{ K }{} ^{*0} (892)$ shown as (green) squares. For most entries the error bars are smaller than the points. |
Yield.pdf [28 KiB] HiDef png [152 KiB] Thumbnail [98 KiB] *.C file |
|
|
Decay time ratio between $\Lambda ^0_ b \rightarrow { J \mskip -3mu/\mskip -2mu\psi \mskip 2mu} pK^-$ and $\overline{ B }{} ^0 \rightarrow { J \mskip -3mu/\mskip -2mu\psi \mskip 2mu} \overline{ K }{} ^{*0} (892)$ decays, and the fit for $\Delta_{\Lambda B}$ used to measure the $\Lambda ^0_ b $ lifetime. |
Ratio_[..].pdf [28 KiB] HiDef png [146 KiB] Thumbnail [98 KiB] *.C file |

|
|
Animated gif made out of all figures. |
PAPER-2014-003.gif Thumbnail |

|
![HiDef png [553 KiB]](Directory_LHCb-PAPER-2014-003/hidef_BDT_response.png)
![HiDef png [239 KiB]](Directory_LHCb-PAPER-2014-003/hidef_signals-log.png)
![HiDef png [291 KiB]](Directory_LHCb-PAPER-2014-003/hidef_LbRefl.png)
![HiDef png [341 KiB]](Directory_LHCb-PAPER-2014-003/hidef_Acceptances.png)
![HiDef png [152 KiB]](Directory_LHCb-PAPER-2014-003/hidef_Yield.png)
![HiDef png [146 KiB]](Directory_LHCb-PAPER-2014-003/hidef_Ratio_Yield.png)
Tables and captions
|
Systematic uncertainties on the $\Delta_{\Lambda B}$, the lifetimes ratio $\tau_{\Lambda ^0_ b }/\tau_{\overline{ B }{} ^0 }$ and the $\Lambda ^0_ b $ lifetime. The systematic uncertainty associated with $\Delta_{\Lambda B}$ is independent of the $\overline{ B }{} ^0 $ lifetime. |
Table_1.pdf [61 KiB] HiDef png [99 KiB] Thumbnail [45 KiB] tex code |

|
![HiDef png [99 KiB]](Directory_LHCb-PAPER-2014-003/hidef_Table_1.png)
Created on 27 April 2024.