Measurement of polarization amplitudes and $CP$ asymmetries in $B^0 \to \phi K^*(892)^0$
[to restricted-access page]Information
LHCb-PAPER-2014-005
CERN-PH-EP-2014-038
arXiv:1403.2888 [PDF]
(Submitted on 12 Mar 2014)
JHEP 05 (2014) 069
Inspire 1285485
Tools
Abstract
An angular analysis of the decay $B^0 \to \phi K^*(892)^0$ is reported based on a $pp$ collision data sample, corresponding to an integrated luminosity of 1.0 fb$^{-1}$, collected at a centre-of-mass energy of $\sqrt{s} = 7$ TeV with the LHCb detector. The P-wave amplitudes and phases are measured with a greater precision than by previous experiments, and confirm about equal amounts of longitudinal and transverse polarization. The S-wave $K^+ \pi^-$ and $K^+K^-$ contributions are taken into account and found to be significant. A comparison of the $B^0 \to \phi K^*(892)^0$ and $\bar{B}^0 \to \phi \bar{K}^*(892)^0$ results shows no evidence for direct CP violation in the rate asymmetry, in the triple-product asymmetries or in the polarization amplitudes and phases.
Figures and captions
|
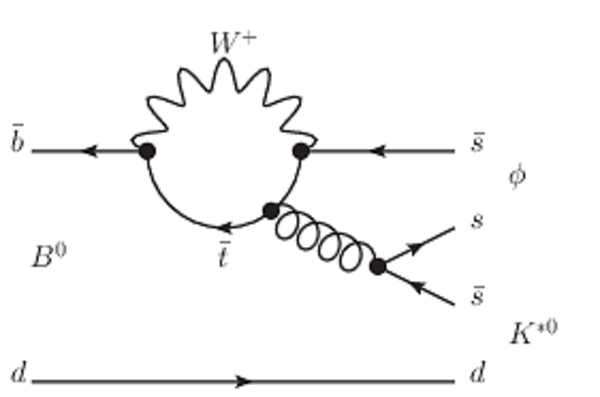
Leading Feynman diagram for the $ B ^0 \rightarrow \phi K ^{*0} $ decay. |
Fig1.pdf [9 KiB] HiDef png [205 KiB] Thumbnail [120 KiB] *.C file |
|
|
The helicity angles $\theta_1$, $\theta_2$, $\Phi$ for the $ B ^0 \rightarrow \phi K ^{*0} $ decay. |
Fig_2.pdf [21 KiB] HiDef png [32 KiB] Thumbnail [18 KiB] *.C file tex code |

|
|
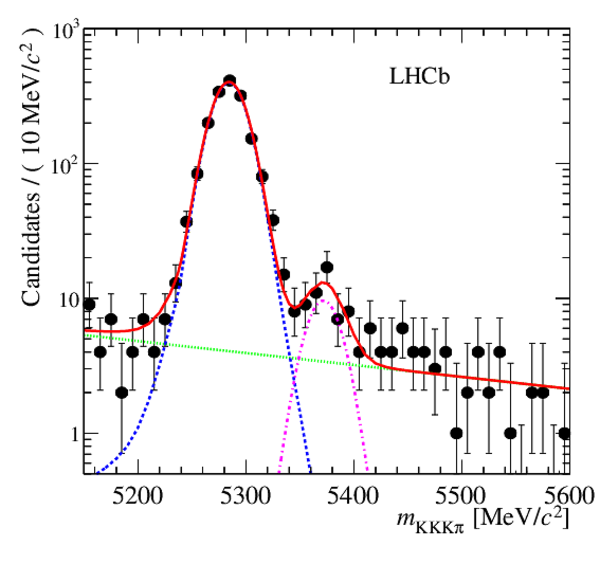
Invariant mass distribution for selected $ K^+K^-K^+\pi^- $ candidates. A fit to the model described in the text is superimposed (red solid line). The signal contribution is shown as the blue dotted line. The contribution from combinatorial background is shown in green (dotted line). A contribution from $\overline{ B }{} ^0_ s \rightarrow \phi K ^{*0} $ (purple dot-dashed line) decays is visible around the known $B_s^0$ meson mass. |
Fig3.pdf [19 KiB] HiDef png [245 KiB] Thumbnail [198 KiB] *.C file |
|
|
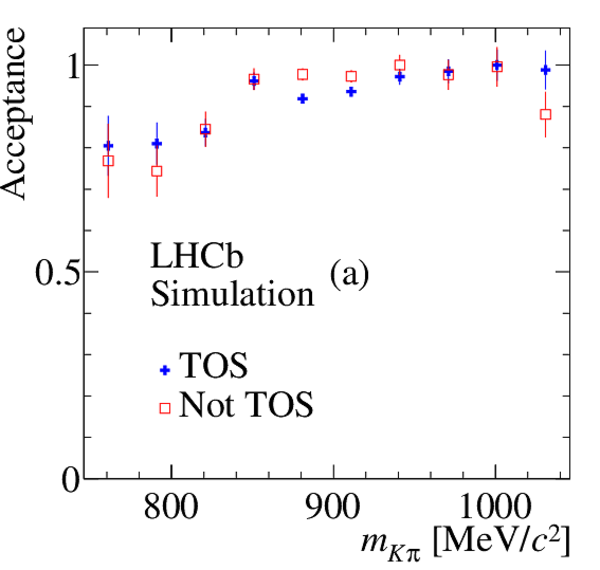
Binned projections of the detector acceptance for (a) $m_{K\pi}$, (b) $m_{KK}$ , (c) $\cos\theta_1$, (d) $\cos\theta_2$ and (e) $\Phi$. The acceptance for the TOS (filled crosses) and not TOS (open squares) are shown on each plot. |
Fig4a.pdf [14 KiB] HiDef png [146 KiB] Thumbnail [129 KiB] *.C file |
|
|
Fig4b.pdf [14 KiB] HiDef png [146 KiB] Thumbnail [129 KiB] *.C file |

|
|
|
Fig4c.pdf [14 KiB] HiDef png [129 KiB] Thumbnail [115 KiB] *.C file |

|
|
|
Fig4d.pdf [14 KiB] HiDef png [131 KiB] Thumbnail [116 KiB] *.C file |

|
|
|
Fig4e.pdf [14 KiB] HiDef png [133 KiB] Thumbnail [118 KiB] *.C file |

|
|
|
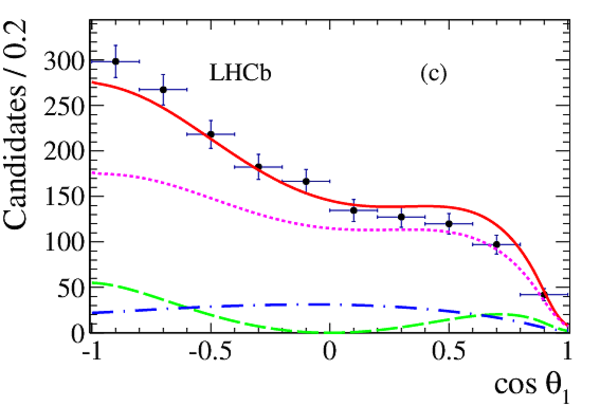
Data distribution for the helicity angles and of the intermediate resonance masses: (a) $m_{K\pi}$ and (b) $m_{KK}$, (c) $\cos \theta_1$, (d) $\cos\theta_2$ and (e) $\Phi$. The background has been subtracted using the sPlot technique. The results of the fit are superimposed. |
Fig5a.pdf [21 KiB] HiDef png [279 KiB] Thumbnail [232 KiB] *.C file |

|
|
Fig5b.pdf [20 KiB] HiDef png [244 KiB] Thumbnail [200 KiB] *.C file |

|
|
|
Fig5c.pdf [18 KiB] HiDef png [176 KiB] Thumbnail [145 KiB] *.C file |
|
|
|
Fig5d.pdf [17 KiB] HiDef png [165 KiB] Thumbnail [138 KiB] *.C file |

|
|
|
Fig5e.pdf [18 KiB] HiDef png [179 KiB] Thumbnail [159 KiB] *.C file |

|
|
|
Animated gif made out of all figures. |
PAPER-2014-005.gif Thumbnail |

|
![HiDef png [205 KiB]](Directory_LHCb-PAPER-2014-005/hidef_Fig1.png)
![HiDef png [32 KiB]](Directory_LHCb-PAPER-2014-005/hidef_Fig_2.png)
![HiDef png [245 KiB]](Directory_LHCb-PAPER-2014-005/hidef_Fig3.png)
![HiDef png [146 KiB]](Directory_LHCb-PAPER-2014-005/hidef_Fig4a.png)
![HiDef png [146 KiB]](Directory_LHCb-PAPER-2014-005/hidef_Fig4b.png)
![HiDef png [129 KiB]](Directory_LHCb-PAPER-2014-005/hidef_Fig4c.png)
![HiDef png [131 KiB]](Directory_LHCb-PAPER-2014-005/hidef_Fig4d.png)
![HiDef png [133 KiB]](Directory_LHCb-PAPER-2014-005/hidef_Fig4e.png)
![HiDef png [279 KiB]](Directory_LHCb-PAPER-2014-005/hidef_Fig5a.png)
![HiDef png [244 KiB]](Directory_LHCb-PAPER-2014-005/hidef_Fig5b.png)
![HiDef png [176 KiB]](Directory_LHCb-PAPER-2014-005/hidef_Fig5c.png)
![HiDef png [165 KiB]](Directory_LHCb-PAPER-2014-005/hidef_Fig5d.png)
![HiDef png [179 KiB]](Directory_LHCb-PAPER-2014-005/hidef_Fig5e.png)
Tables and captions
|
Definition of the $h_i$, $f_i$ and $\mathcal{M}_i$ terms in Eq. 3. Note that the P-wave interference terms $i=4$ and $i=6$ take the imaginary parts of $A_\perp A_\parallel^*$ and $A_\perp A_0^*$, while $i=5$ takes the real part of $A_\parallel A_0^*$. Similarly the S-wave interference terms $i=9$ and $i=13$ take the imaginary parts of $A_\perp A_\textrm{S}^* M_1 M_0^*$, and the terms $i=8,10,12,14$ take the real parts of $A_\parallel A_\textrm{S}^* M_1 M_0^*$ and $A_0 A_\textrm{S}^* M_1 M_0^*$. |
Table_1.pdf [78 KiB] HiDef png [136 KiB] Thumbnail [55 KiB] tex code |

|
|
Parameters measured in the angular analysis. The first and second uncertainties are statistical and systematic, respectively. |
Table_2.pdf [57 KiB] HiDef png [159 KiB] Thumbnail [70 KiB] tex code |

|
|
Triple-product asymmetries. The first and second uncertainties on the measured values are statistical and systematic, respectively. |
Table_3.pdf [44 KiB] HiDef png [168 KiB] Thumbnail [73 KiB] tex code |

|
|
Systematic uncertainties on the measurement of the polarization amplitudes, relative strong phases and triple-product asymmetries. The column labelled `Total' is the quadratic sum of the individual contributions. |
Table_4.pdf [49 KiB] HiDef png [213 KiB] Thumbnail [93 KiB] tex code |

|
|
Comparison of measurements made by the LHCb , BaBar [8] and Belle [11] collaborations. The first uncertainty is statistical and the second systematic. |
Table_5.pdf [51 KiB] HiDef png [86 KiB] Thumbnail [39 KiB] tex code |

|
![HiDef png [136 KiB]](Directory_LHCb-PAPER-2014-005/hidef_Table_1.png)
![HiDef png [159 KiB]](Directory_LHCb-PAPER-2014-005/hidef_Table_2.png)
![HiDef png [168 KiB]](Directory_LHCb-PAPER-2014-005/hidef_Table_3.png)
![HiDef png [213 KiB]](Directory_LHCb-PAPER-2014-005/hidef_Table_4.png)
![HiDef png [86 KiB]](Directory_LHCb-PAPER-2014-005/hidef_Table_5.png)
Supplementary Material [file]
| Supplementary material full pdf |
Supple[..].pdf [74 KiB] |

|
Created on 27 April 2024.