Information
LHCb-PAPER-2014-007
CERN-PH-EP-2014-056
arXiv:1403.8045 [PDF]
(Submitted on 31 Mar 2014)
JHEP 05 (2014) 082
Inspire 1287929
Tools
Abstract
The angular distributions of the rare decays $B^+ \to K^+\mu^+\mu^-$ and $B^0 \to K^0_{\rm\scriptscriptstyle S}\mu^+\mu^-$ are studied with data corresponding to 3$ $fb$^{-1}$ of integrated luminosity, collected in proton-proton collisions at 7 and 8$ $TeV centre-of-mass energies with the LHCb detector. The angular distribution is described by two parameters, $F_{\rm H}$ and the forward-backward asymmetry of the dimuon system $A_{\rm FB}$, which are determined in bins of the dimuon mass squared. The parameter $F_{\rm H}$ is a measure of the contribution from (pseudo)scalar and tensor amplitudes to the decay width. The measurements of $A_{\rm FB}$ and $F_{\rm H}$ reported here are the most precise to date and are compatible with predictions from the Standard Model.
Figures and captions
|
Angular acceptance as derived from simulation in the dimuon mass squared ranges (a) $1.1< q^2 < 6.0 {\mathrm{ Ge V^2 /}c^4} $ and (b) $15.0< q^2 < 22.0 {\mathrm{ Ge V^2 /}c^4} $. The dip in the acceptance for $ B ^+ \rightarrow K ^+ \mu ^+\mu ^- $ decays results from the veto used to reject $ B ^+ \rightarrow \overline{ D }{} ^0 \pi ^+ $ decays (see text). The acceptance is normalised to unit area to allow a comparison of the shape of the distributions. |
eff_1_to_6.pdf [15 KiB] HiDef png [249 KiB] Thumbnail [187 KiB] *.C file |

|
|
eff_15[..].pdf [15 KiB] HiDef png [209 KiB] Thumbnail [169 KiB] *.C file |

|
|
|
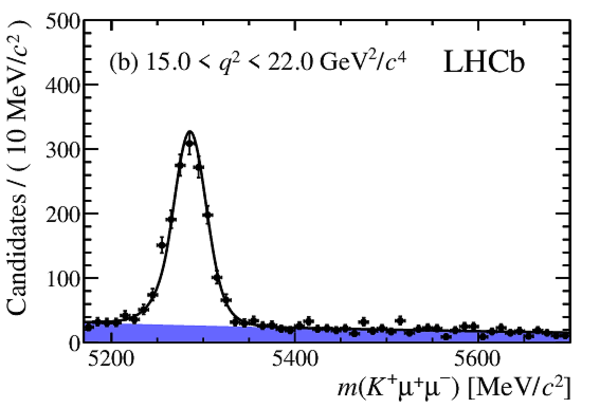
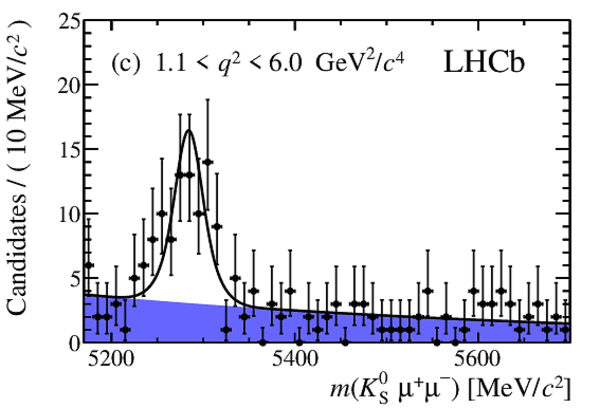
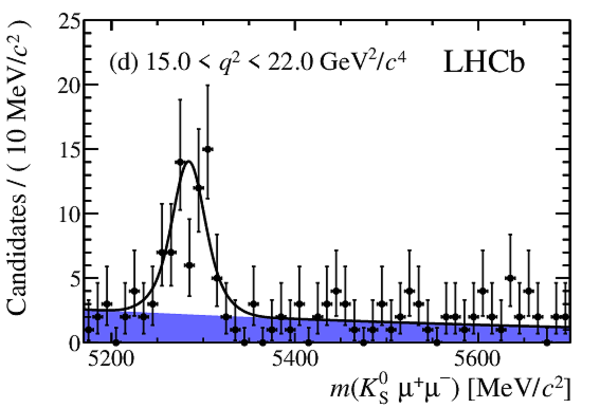
Top, reconstructed mass of $ B ^+ \rightarrow K ^+ \mu ^+\mu ^- $ candidates in the ranges (a) $1.1 < q^2 < 6.0 {\mathrm{ Ge V^2 /}c^4} $ and (b) $15.0 < q^2 < 22.0 {\mathrm{ Ge V^2 /}c^4} $. Bottom, reconstructed mass of $ B ^0 \rightarrow K ^0_{\rm\scriptscriptstyle S} \mu ^+\mu ^- $ candidates in the ranges (c) $1.1 < q^2 < 6.0 {\mathrm{ Ge V^2 /}c^4} $ and (d) $15.0 < q^2 < 22.0 {\mathrm{ Ge V^2 /}c^4} $. The data are overlaid with the result of the fit described in the text. The long and downstream $ K ^0_{\rm\scriptscriptstyle S}$ categories are combined for presentation purposes. The shaded region indicates the background contribution in the fit. |
mass1to6Bp.pdf [20 KiB] HiDef png [177 KiB] Thumbnail [164 KiB] *.C file |

|
|
mass15[..].pdf [19 KiB] HiDef png [175 KiB] Thumbnail [162 KiB] *.C file |
|
|
|
mass1to6B0.pdf [19 KiB] HiDef png [217 KiB] Thumbnail [198 KiB] *.C file |
|
|
|
mass15[..].pdf [19 KiB] HiDef png [214 KiB] Thumbnail [195 KiB] *.C file |
|
|
|
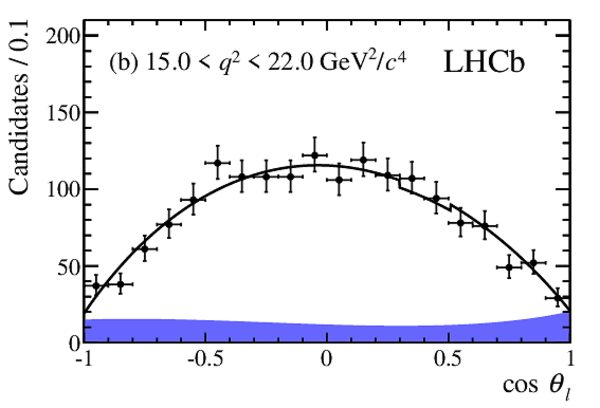
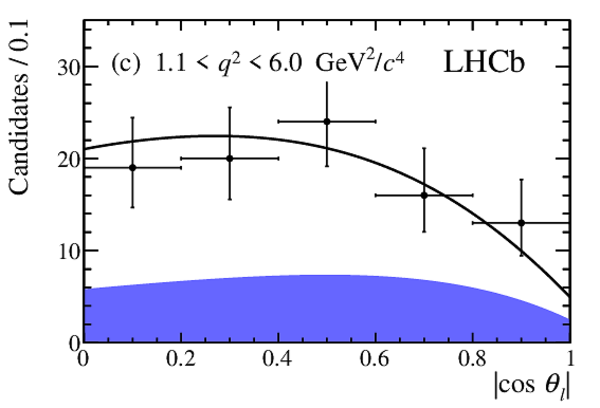
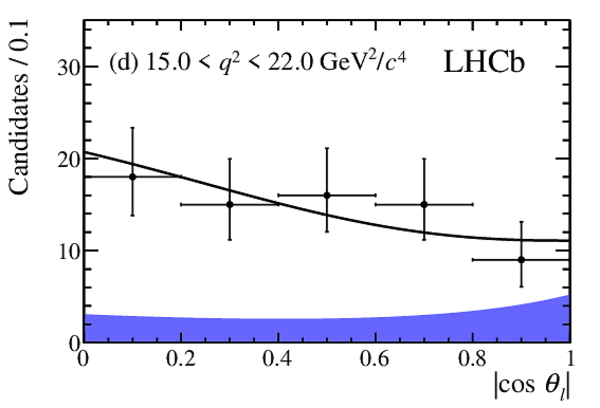
Top, angular distribution of $ B ^+ \rightarrow K ^+ \mu ^+\mu ^- $ candidates with (a) $1.1 < q^2 < 6.0 {\mathrm{ Ge V^2 /}c^4} $ and (b) $15.0 < q^2 < 22.0 {\mathrm{ Ge V^2 /}c^4} $. Bottom, angular distribution of $ B ^0 \rightarrow K ^0_{\rm\scriptscriptstyle S} \mu ^+\mu ^- $ candidates with (c) $1.1 < q^2 < 6.0 {\mathrm{ Ge V^2 /}c^4} $ and (d) $15.0 < q^2 < 22.0 {\mathrm{ Ge V^2 /}c^4} $. Only candidates with a reconstructed mass within $\pm50 {\mathrm{ Me V /}c^2} $ of the known $ B ^+ $ or $ B ^0$ mass are shown. The data are overlaid with the result of the fit described in the text. The long and downstream $ K ^0_{\rm\scriptscriptstyle S}$ categories are combined for presentation purposes. The shaded region indicates the background contribution in the fit. |
costhe[..].pdf [16 KiB] HiDef png [144 KiB] Thumbnail [143 KiB] *.C file |

|
|
costhe[..].pdf [16 KiB] HiDef png [143 KiB] Thumbnail [142 KiB] *.C file |
|
|
|
costhe[..].pdf [15 KiB] HiDef png [130 KiB] Thumbnail [120 KiB] *.C file |
|
|
|
costhe[..].pdf [15 KiB] HiDef png [127 KiB] Thumbnail [118 KiB] *.C file |
|
|
|
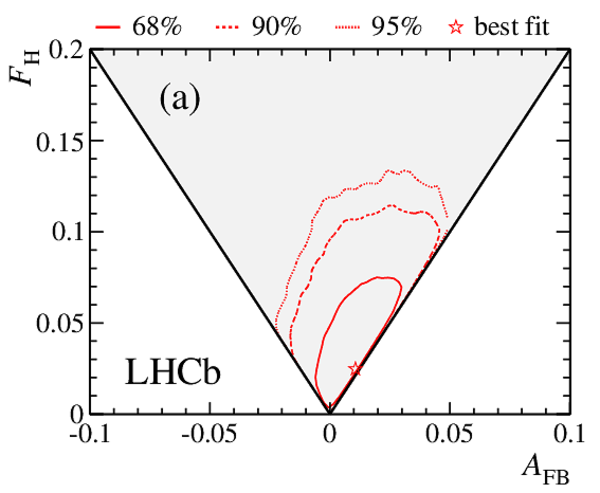
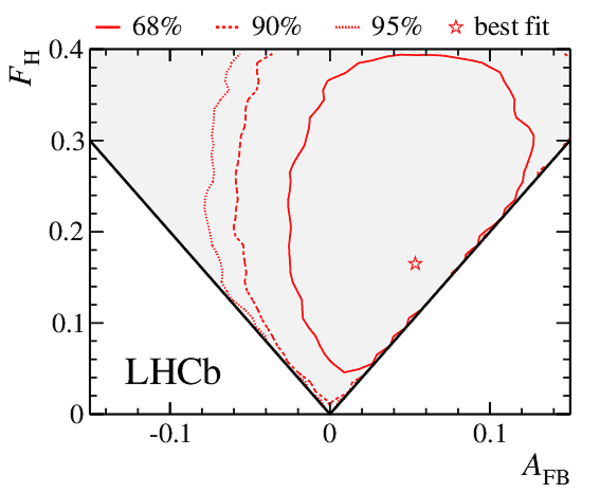
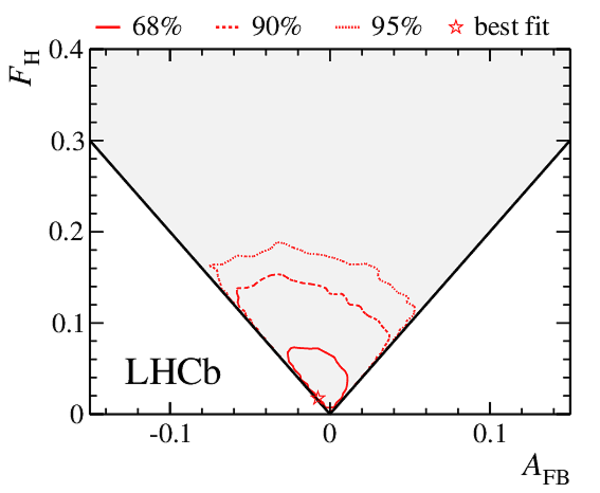
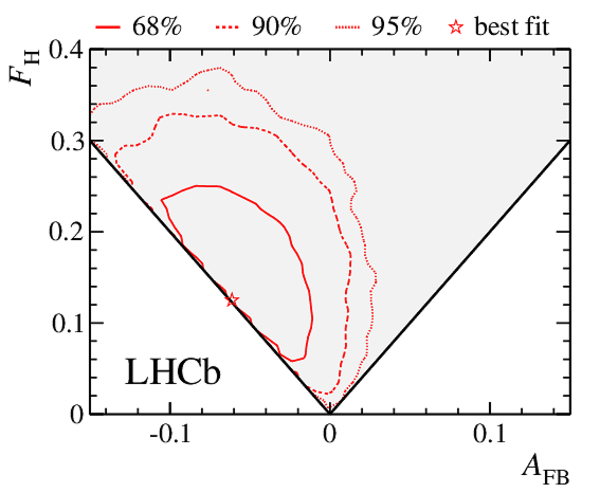
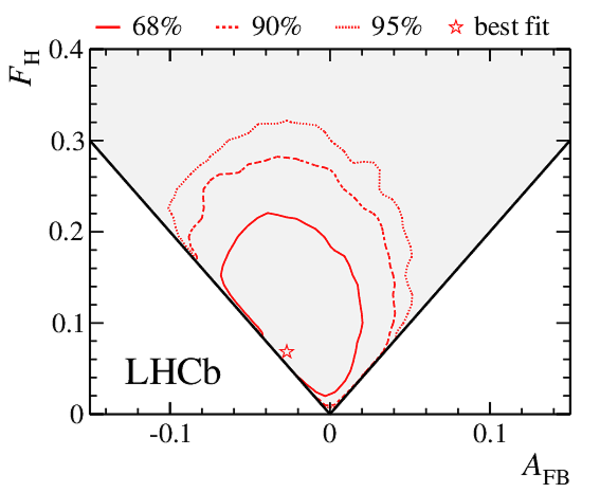
Two-dimensional confidence regions for $A_{\rm FB}$ and $F_{\rm H}$ for the decay $ B ^+ \rightarrow K ^+ \mu ^+\mu ^- $ in the $ q^2$ ranges (a) $1.1 < q^2 < 6.0 {\mathrm{ Ge V^2 /}c^4} $ and (b) $15.0 < q^2 < 22.0 {\mathrm{ Ge V^2 /}c^4} $. The confidence intervals are determined using the Feldman-Cousins technique. The shaded (triangular) region illustrates the range of $A_{\rm FB}$ and $F_{\rm H}$ over which the signal angular distribution remains positive in all regions of phase-space. |
AFB_FH[..].pdf [16 KiB] HiDef png [235 KiB] Thumbnail [186 KiB] *.C file |
|
|
AFB_FH[..].pdf [16 KiB] HiDef png [242 KiB] Thumbnail [190 KiB] *.C file |

|
|
|
Dimuon forward-backward asymmetry, $A_{\rm FB}$, and the parameter $F_{\rm H}$ for the decay $ B ^+ \rightarrow K ^+ \mu ^+\mu ^- $ as a function of the dimuon invariant mass squared, $ q^2$ . The inner horizontal bars indicate the one-dimensional 68% confidence intervals. The outer vertical bars include contributions from systematic uncertainties (described in the text). The confidence intervals for $F_{\rm H}$ are overlaid with the SM theory prediction (narrow band). Data are not presented for the regions around the $ { J \mskip -3mu/\mskip -2mu\psi \mskip 2mu}$ and $\psi {(2S)}$ resonances. |
cAFB.pdf [14 KiB] HiDef png [87 KiB] Thumbnail [86 KiB] *.C file |

|
|
cFH.pdf [18 KiB] HiDef png [127 KiB] Thumbnail [99 KiB] *.C file |

|
|
|
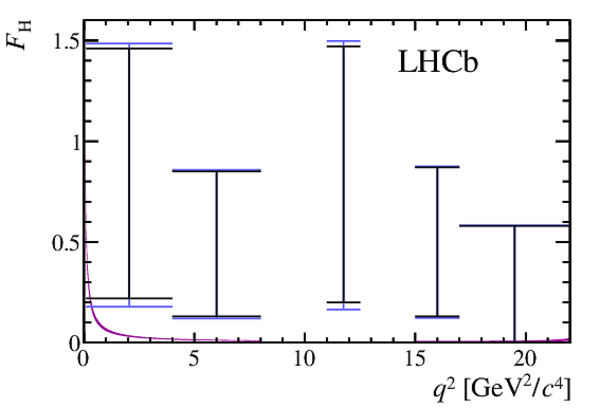
Results for the parameter $F_{\rm H}$ for the decay $ B ^0 \rightarrow K ^0_{\rm\scriptscriptstyle S} \mu ^+\mu ^- $ as a function of the dimuon invariant mass squared, $ q^2$ . The inner horizontal bars indicate the one-dimensional 68% confidence intervals. The outer vertical bars include contributions from systematic uncertainties (described in the text). The confidence intervals are overlaid with the SM theory prediction (narrow band). Data are not presented for the regions around the $ { J \mskip -3mu/\mskip -2mu\psi \mskip 2mu}$ and $\psi {(2S)}$ resonances. |
cFHK0.pdf [17 KiB] HiDef png [90 KiB] Thumbnail [69 KiB] *.C file |
|
|
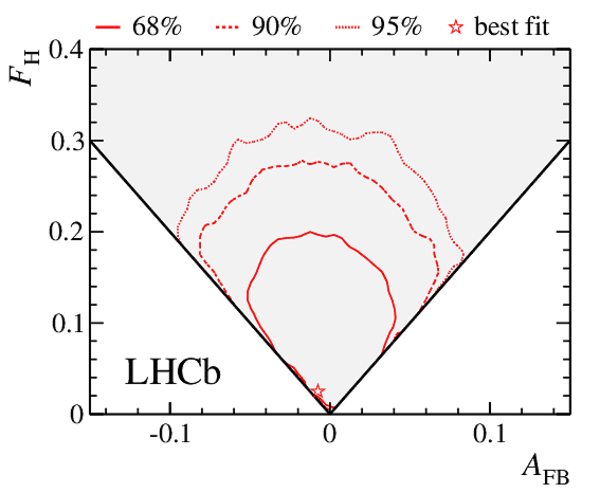
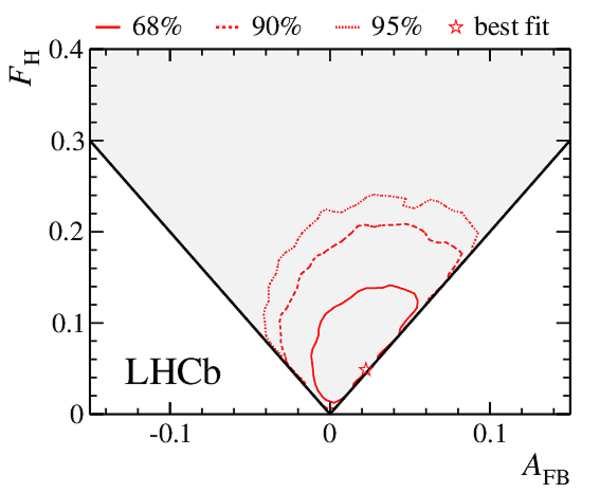
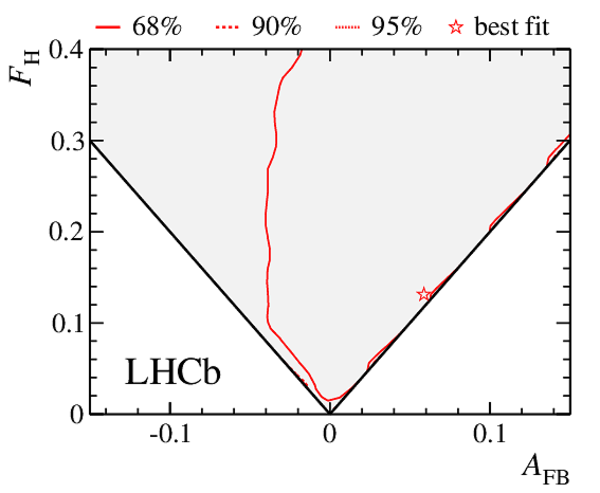
Two-dimensional confidence regions for $A_{\rm FB}$ and $F_{\rm H}$ for the decay $ B ^+ \rightarrow K ^+ \mu ^+\mu ^- $ in the $ q^2$ ranges (a) $0.10 < q^2 < 0.98 {\mathrm{ Ge V^2 /}c^4} $, (b) $1.10 < q^2 < 2.00 {\mathrm{ Ge V^2 /}c^4} $, (c) $2.00 < q^2 < 3.00 {\mathrm{ Ge V^2 /}c^4} $ and (d) $3.00 < q^2 < 4.00 {\mathrm{ Ge V^2 /}c^4} $. The confidence intervals are determined using the Feldman-Cousins technique and are purely statistical. The shaded (triangular) region illustrates the range of $A_{\rm FB}$ and $F_{\rm H}$ over which the signal angular distribution remains positive in all regions of phase-space. |
AFB_FH[..].pdf [17 KiB] HiDef png [273 KiB] Thumbnail [192 KiB] *.C file |

|
|
AFB_FH[..].pdf [16 KiB] HiDef png [265 KiB] Thumbnail [189 KiB] *.C file |

|
|
|
AFB_FH[..].pdf [16 KiB] HiDef png [265 KiB] Thumbnail [184 KiB] *.C file |
|
|
|
AFB_FH[..].pdf [16 KiB] HiDef png [190 KiB] Thumbnail [151 KiB] *.C file |
|
|
|
Two-dimensional confidence regions for $A_{\rm FB}$ and $F_{\rm H}$ for the decay $ B ^+ \rightarrow K ^+ \mu ^+\mu ^- $ in the $ q^2$ ranges (a) $4.00 < q^2 < 5.00 {\mathrm{ Ge V^2 /}c^4} $, (b) $5.00 < q^2 < 6.00 {\mathrm{ Ge V^2 /}c^4} $, (c) $6.00 < q^2 < 7.00 {\mathrm{ Ge V^2 /}c^4} $ and (d) $7.00 < q^2 < 8.00 {\mathrm{ Ge V^2 /}c^4} $. The confidence intervals are determined using the Feldman-Cousins technique and are purely statistical. The shaded (triangular) region illustrates the range of $A_{\rm FB}$ and $F_{\rm H}$ over which the signal angular distribution remains positive in all regions of phase-space. |
AFB_FH[..].pdf [15 KiB] HiDef png [219 KiB] Thumbnail [165 KiB] *.C file |

|
|
AFB_FH[..].pdf [16 KiB] HiDef png [242 KiB] Thumbnail [179 KiB] *.C file |
|
|
|
AFB_FH[..].pdf [16 KiB] HiDef png [208 KiB] Thumbnail [160 KiB] *.C file |

|
|
|
AFB_FH[..].pdf [16 KiB] HiDef png [187 KiB] Thumbnail [150 KiB] *.C file |

|
|
|
Two-dimensional confidence regions for $A_{\rm FB}$ and $F_{\rm H}$ for the decay $ B ^+ \rightarrow K ^+ \mu ^+\mu ^- $ in the $ q^2$ ranges (a) $11.00 < q^2 < 11.75 {\mathrm{ Ge V^2 /}c^4} $, (b) $11.75 < q^2 < 12.50 {\mathrm{ Ge V^2 /}c^4} $ and (c) $15.00 < q^2 < 16.00 {\mathrm{ Ge V^2 /}c^4} $. The confidence intervals are determined using the Feldman-Cousins technique and are purely statistical. The shaded (triangular) region illustrates the range of $A_{\rm FB}$ and $F_{\rm H}$ over which the signal angular distribution remains positive in all regions of phase-space. |
AFB_FH[..].pdf [15 KiB] HiDef png [249 KiB] Thumbnail [183 KiB] *.C file |

|
|
AFB_FH[..].pdf [16 KiB] HiDef png [213 KiB] Thumbnail [163 KiB] *.C file |
|
|
|
AFB_FH[..].pdf [16 KiB] HiDef png [264 KiB] Thumbnail [190 KiB] *.C file |
|
|
|
Two-dimensional confidence regions for $A_{\rm FB}$ and $F_{\rm H}$ for the decay $ B ^+ \rightarrow K ^+ \mu ^+\mu ^- $ in the $ q^2$ ranges (a) $16.00 < q^2 < 17.00 {\mathrm{ Ge V^2 /}c^4} $, (b) $17.00 < q^2 < 18.00 {\mathrm{ Ge V^2 /}c^4} $ and (c) $18.00 < q^2 < 19.00 {\mathrm{ Ge V^2 /}c^4} $. The confidence intervals are determined using the Feldman-Cousins technique and are purely statistical. The shaded (triangular) region illustrates the range of $A_{\rm FB}$ and $F_{\rm H}$ over which the signal angular distribution remains positive in all regions of phase-space. |
AFB_FH[..].pdf [15 KiB] HiDef png [232 KiB] Thumbnail [173 KiB] *.C file |

|
|
AFB_FH[..].pdf [16 KiB] HiDef png [250 KiB] Thumbnail [182 KiB] *.C file |
|
|
|
AFB_FH[..].pdf [17 KiB] HiDef png [290 KiB] Thumbnail [202 KiB] *.C file |

|
|
|
Two-dimensional confidence regions for $A_{\rm FB}$ and $F_{\rm H}$ for the decay $ B ^+ \rightarrow K ^+ \mu ^+\mu ^- $ in the $ q^2$ ranges (a) $19.00 < q^2 < 20.00 {\mathrm{ Ge V^2 /}c^4} $, (b) $20.00 < q^2 < 21.00 {\mathrm{ Ge V^2 /}c^4} $ and (c) $21.00 < q^2 < 22.00 {\mathrm{ Ge V^2 /}c^4} $. The confidence intervals are determined using the Feldman-Cousins technique and are purely statistical. The shaded (triangular) region illustrates the range of $A_{\rm FB}$ and $F_{\rm H}$ over which the signal angular distribution remains positive in all regions of phase-space. |
AFB_FH[..].pdf [16 KiB] HiDef png [241 KiB] Thumbnail [176 KiB] *.C file |

|
|
AFB_FH[..].pdf [16 KiB] HiDef png [251 KiB] Thumbnail [180 KiB] *.C file |

|
|
|
AFB_FH[..].pdf [15 KiB] HiDef png [178 KiB] Thumbnail [142 KiB] *.C file |
|
|
|
Animated gif made out of all figures. |
PAPER-2014-007.gif Thumbnail |

|
![HiDef png [249 KiB]](Directory_LHCb-PAPER-2014-007/hidef_eff_1_to_6.png)
![HiDef png [209 KiB]](Directory_LHCb-PAPER-2014-007/hidef_eff_15_to_22.png)
![HiDef png [177 KiB]](Directory_LHCb-PAPER-2014-007/hidef_mass1to6Bp.png)
![HiDef png [175 KiB]](Directory_LHCb-PAPER-2014-007/hidef_mass15to22Bp.png)
![HiDef png [217 KiB]](Directory_LHCb-PAPER-2014-007/hidef_mass1to6B0.png)
![HiDef png [214 KiB]](Directory_LHCb-PAPER-2014-007/hidef_mass15to22B0.png)
![HiDef png [144 KiB]](Directory_LHCb-PAPER-2014-007/hidef_costhetal1to6Bp.png)
![HiDef png [143 KiB]](Directory_LHCb-PAPER-2014-007/hidef_costhetal15to22Bp.png)
![HiDef png [130 KiB]](Directory_LHCb-PAPER-2014-007/hidef_costhetal1to6B0.png)
![HiDef png [127 KiB]](Directory_LHCb-PAPER-2014-007/hidef_costhetal15to22B0.png)
![HiDef png [235 KiB]](Directory_LHCb-PAPER-2014-007/hidef_AFB_FH_2D_1_to_6.png)
![HiDef png [242 KiB]](Directory_LHCb-PAPER-2014-007/hidef_AFB_FH_2D_15_to_22.png)
![HiDef png [87 KiB]](Directory_LHCb-PAPER-2014-007/hidef_cAFB.png)
![HiDef png [127 KiB]](Directory_LHCb-PAPER-2014-007/hidef_cFH.png)
![HiDef png [90 KiB]](Directory_LHCb-PAPER-2014-007/hidef_cFHK0.png)
![HiDef png [273 KiB]](Directory_LHCb-PAPER-2014-007/hidef_AFB_FH_0_to_1.png)
![HiDef png [265 KiB]](Directory_LHCb-PAPER-2014-007/hidef_AFB_FH_1_to_2.png)
![HiDef png [265 KiB]](Directory_LHCb-PAPER-2014-007/hidef_AFB_FH_2_to_3.png)
![HiDef png [190 KiB]](Directory_LHCb-PAPER-2014-007/hidef_AFB_FH_3_to_4.png)
![HiDef png [219 KiB]](Directory_LHCb-PAPER-2014-007/hidef_AFB_FH_4_to_5.png)
![HiDef png [242 KiB]](Directory_LHCb-PAPER-2014-007/hidef_AFB_FH_5_to_6.png)
![HiDef png [208 KiB]](Directory_LHCb-PAPER-2014-007/hidef_AFB_FH_6_to_7.png)
![HiDef png [187 KiB]](Directory_LHCb-PAPER-2014-007/hidef_AFB_FH_7_to_8.png)
![HiDef png [249 KiB]](Directory_LHCb-PAPER-2014-007/hidef_AFB_FH_11_to_11.png)
![HiDef png [213 KiB]](Directory_LHCb-PAPER-2014-007/hidef_AFB_FH_11_to_12.png)
![HiDef png [264 KiB]](Directory_LHCb-PAPER-2014-007/hidef_AFB_FH_15_to_16.png)
![HiDef png [232 KiB]](Directory_LHCb-PAPER-2014-007/hidef_AFB_FH_16_to_17.png)
![HiDef png [250 KiB]](Directory_LHCb-PAPER-2014-007/hidef_AFB_FH_17_to_18.png)
![HiDef png [290 KiB]](Directory_LHCb-PAPER-2014-007/hidef_AFB_FH_18_to_19.png)
![HiDef png [241 KiB]](Directory_LHCb-PAPER-2014-007/hidef_AFB_FH_19_to_20.png)
![HiDef png [251 KiB]](Directory_LHCb-PAPER-2014-007/hidef_AFB_FH_20_to_21.png)
![HiDef png [178 KiB]](Directory_LHCb-PAPER-2014-007/hidef_AFB_FH_21_to_22.png)
Tables and captions
|
Forward-backward asymmetry, $A_{\rm FB}$, and $F_{\rm H}$ for the decay $ B ^+ \rightarrow K ^+ \mu ^+\mu ^- $ in the $ q^2$ bins used in this analysis. These parameters are also given in a wide bin at large ($1.1 < q^2 <6.0 {\mathrm{ Ge V^2 /}c^4} $) and low ($15.0 < q^2 < 22.0 {\mathrm{ Ge V^2 /}c^4} $) hadronic recoil. The column labelled stat is the 68% statistical confidence interval on $F_{\rm H}$ ($A_{\rm FB}$) when treating $A_{\rm FB}$ ($F_{\rm H}$) as a nuisance parameter. The column labelled syst is the systematic uncertainty. |
Table_1.pdf [37 KiB] HiDef png [198 KiB] Thumbnail [95 KiB] tex code |

|
|
The 68% confidence interval on the parameter $F_{\rm H}$ for the decay $ B ^0 \rightarrow K ^0_{\rm\scriptscriptstyle S} \mu ^+\mu ^- $ in $ q^2$ bins. In addition to the narrow binning used in the analysis, results are also given in wide bins at large ($1.1 < q^2 <6.0 {\mathrm{ Ge V^2 /}c^4} $) and low ($15.0 < q^2 < 22.0 {\mathrm{ Ge V^2 /}c^4} $) hadronic recoil. The column labelled stat is the 68% statistical confidence interval. The column labelled syst is the systematic uncertainty. |
Table_2.pdf [36 KiB] HiDef png [105 KiB] Thumbnail [52 KiB] tex code |

|
![HiDef png [198 KiB]](Directory_LHCb-PAPER-2014-007/hidef_Table_1.png)
![HiDef png [105 KiB]](Directory_LHCb-PAPER-2014-007/hidef_Table_2.png)
Created on 27 April 2024.