Measurement of $CP$ asymmetry in $D^0 \rightarrow K^- K^+$ and $D^0 \rightarrow \pi^- \pi^+$ decays
[to restricted-access page]Information
LHCb-PAPER-2014-013
CERN-PH-EP-2014-082
arXiv:1405.2797 [PDF]
(Submitted on 12 May 2014)
JHEP 07 (2014) 041
Inspire 1295690
Tools
Abstract
Time-integrated $CP$ asymmetries in $D^0$ decays to the final states $K^- K^+$ and $\pi^- \pi^+$ are measured using proton-proton collisions corresponding to $3\mathrm{ fb}^{-1}$ of integrated luminosity collected at centre-of-mass energies of $7\mathrm{ Te V}$ and $8\mathrm{ Te V}$. The $D^0$ mesons are produced in semileptonic $b$-hadron decays, where the charge of the accompanying muon is used to determine the initial flavour of the charm meson. The difference in $CP$ asymmetries between the two final states is measured to be \begin{align} \Delta A_{CP} = A_{CP}(K^-K^+)-A_{CP}(\pi^-\pi^+) = (+0.14 \pm 0.16\mathrm{ (stat)} \pm 0.08\mathrm{ (syst)})\% \ . \nonumber \end{align} A measurement of $A_{CP}(K^-K^+)$ is obtained assuming negligible $CP$ violation in charm mixing and in Cabibbo-favoured $D$ decays. It is found to be \begin{align} A_{CP}(K^-K^+) = (-0.06 \pm 0.15\mathrm{ (stat)} \pm 0.10\mathrm{ (syst)}) \% \ ,\nonumber \end{align} where the correlation coefficient between $\Delta A_{CP}$ and $A_{CP}(K^-K^+)$ is $\rho=0.28$. By combining these results, the $CP$ asymmetry in the $D^0\rightarrow\pi^-\pi^+$ channel is $A_{CP}(\pi^-\pi^+)=(-0.20\pm0.19\mathrm{ (stat)}\pm0.10\mathrm{ (syst)})\%$.
Figures and captions
|
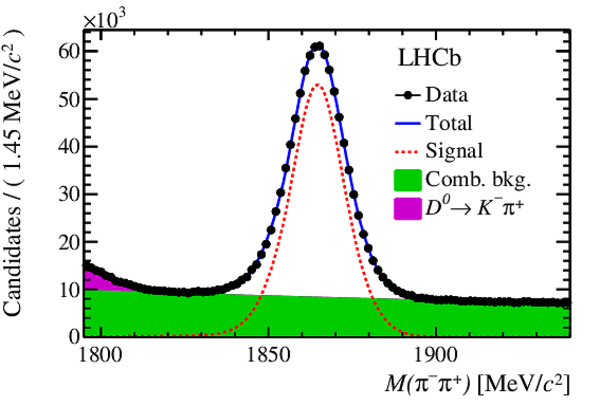
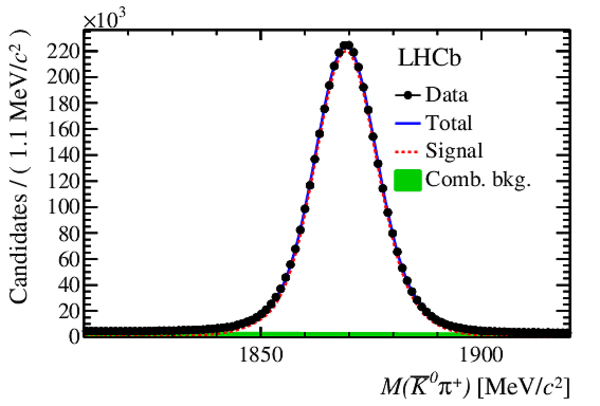
Invariant mass distributions for muon-tagged (a) $ D ^0 \rightarrow K ^- K ^+ $ , (b) $ D ^0 \rightarrow \pi ^- \pi ^+ $ and (c) $ D ^0 \rightarrow K ^- \pi ^+ $ candidates and for prompt (d) $ D ^+ \rightarrow K ^- \pi ^+ \pi ^+ $ and (e) $ D ^+ \rightarrow \overline{ K }{} {}^0 \pi ^+ $ candidates. The results of the fits are overlaid. |
plot_m[..].pdf [31 KiB] HiDef png [197 KiB] Thumbnail [167 KiB] *.C file |

|
|
plot_m[..].pdf [33 KiB] HiDef png [205 KiB] Thumbnail [181 KiB] *.C file |
|
|
|
plot_m[..].pdf [29 KiB] HiDef png [165 KiB] Thumbnail [145 KiB] *.C file |

|
|
|
plot_m[..].pdf [29 KiB] HiDef png [165 KiB] Thumbnail [146 KiB] *.C file |

|
|
|
plot_m[..].pdf [30 KiB] HiDef png [189 KiB] Thumbnail [166 KiB] *.C file |
|
|
|
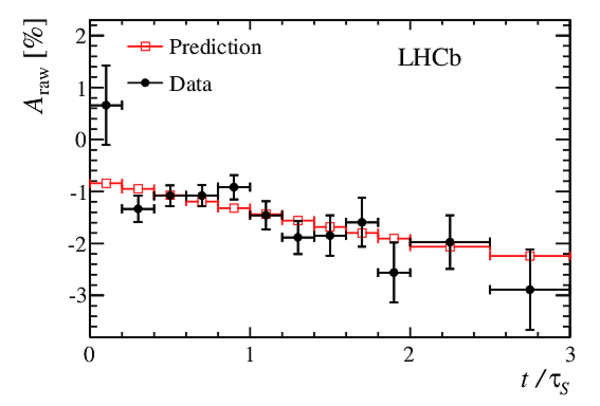
Raw asymmetry in the $ D ^+ \rightarrow \overline{ K }{} {}^0 \pi ^+ $ decay shown for (a) long and (b) downstream $ K ^0_{\rm\scriptscriptstyle S}$ candidates versus the $ K ^0_{\rm\scriptscriptstyle S}$ decay time in units of its lifetime. The long $ K ^0_{\rm\scriptscriptstyle S}$ candidates are reconstructed in the full data set, while the downstream $ K ^0_{\rm\scriptscriptstyle S}$ candidates are reconstructed in the 2012 data only. The predicted effect from the $ K ^0$ asymmetry, $- A_D( K ^0 ) $, is also shown. An overall shift is applied to this prediction to account for $ D ^+$ production and pion detection asymmetries (note that the unshifted $ A_D( K ^0 )$ at $t=0$ is zero). |
combin[..].pdf [10 KiB] HiDef png [99 KiB] Thumbnail [101 KiB] *.C file |

|
|
combin[..].pdf [11 KiB] HiDef png [99 KiB] Thumbnail [98 KiB] *.C file |
|
|
|
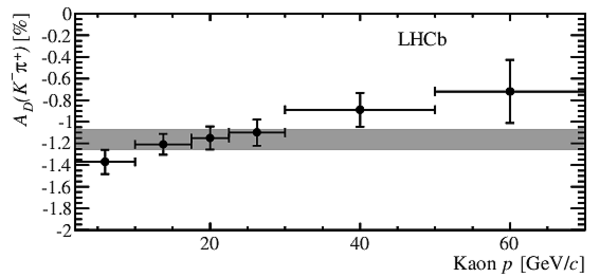
Measured $ K ^- \pi ^+ $ detection asymmetry as a function of the kaon momentum. The shaded band indicates the average asymmetry integrated over the bins. There is a correlation between the data points due to the overlap between the $ D ^+ \rightarrow \overline{ K }{} {}^0 \pi ^+ $ samples used for each bin. |
plot_ADKpi.pdf [11 KiB] HiDef png [156 KiB] Thumbnail [35 KiB] *.C file |
|
|
Raw asymmetry, without background subtraction, as a function of the invariant mass for (a) the $ D ^0 \rightarrow K ^- K ^+ $ candidates and (b) the $ D ^0 \rightarrow \pi ^- \pi ^+ $ candidates for the $\Delta A_{ C P }$ selection. The result from the fit is overlaid. |
plot_a[..].pdf [31 KiB] HiDef png [164 KiB] Thumbnail [165 KiB] *.C file |

|
|
plot_a[..].pdf [32 KiB] HiDef png [178 KiB] Thumbnail [180 KiB] *.C file |

|
|
|
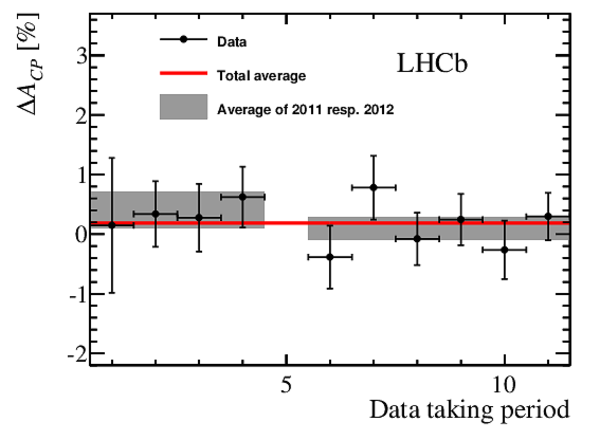
(a) $\Delta A_{ C P }$ and (b) $ A_{ C P }( K ^- K ^+ )$ as a function of the data taking period. The 2011 data are divided into four periods and the 2012 data into six periods. The error bars indicate the statistical uncertainty, the shaded bands show the averages for 2011 and 2012, and the (red) line shows the overall $ C P$ asymmetry. |
runPer[..].pdf [14 KiB] HiDef png [269 KiB] Thumbnail [111 KiB] *.C file |
|
|
runPer[..].pdf [14 KiB] HiDef png [264 KiB] Thumbnail [118 KiB] *.C file |

|
|
|
Animated gif made out of all figures. |
PAPER-2014-013.gif Thumbnail |

|
![HiDef png [197 KiB]](Directory_LHCb-PAPER-2014-013/hidef_plot_mass_dkk.png)
![HiDef png [205 KiB]](Directory_LHCb-PAPER-2014-013/hidef_plot_mass_dpipi.png)
![HiDef png [165 KiB]](Directory_LHCb-PAPER-2014-013/hidef_plot_mass_dkpi.png)
![HiDef png [165 KiB]](Directory_LHCb-PAPER-2014-013/hidef_plot_mass_dkpipi.png)
![HiDef png [189 KiB]](Directory_LHCb-PAPER-2014-013/hidef_plot_mass_dkzpi.png)
![HiDef png [99 KiB]](Directory_LHCb-PAPER-2014-013/hidef_combination_KspiLL_lifetime.png)
![HiDef png [99 KiB]](Directory_LHCb-PAPER-2014-013/hidef_combination_KspiDD_lifetime.png)
![HiDef png [156 KiB]](Directory_LHCb-PAPER-2014-013/hidef_plot_ADKpi.png)
![HiDef png [164 KiB]](Directory_LHCb-PAPER-2014-013/hidef_plot_asym_dkk.png)
![HiDef png [178 KiB]](Directory_LHCb-PAPER-2014-013/hidef_plot_asym_dpipi.png)
![HiDef png [269 KiB]](Directory_LHCb-PAPER-2014-013/hidef_runPeriod_DACP.png)
![HiDef png [264 KiB]](Directory_LHCb-PAPER-2014-013/hidef_runPeriod_AcpKK.png)
Tables and captions
|
Number of signal decays determined from fits to the invariant mass distributions. |
Table_1.pdf [60 KiB] HiDef png [76 KiB] Thumbnail [19 KiB] tex code |

|
|
Values of the parameters used to calculate the $ K ^0$ asymmetry [21,25]. |
Table_2.pdf [56 KiB] HiDef png [96 KiB] Thumbnail [47 KiB] tex code |

|
|
Asymmetries (in %) entering the calculation of the $ K ^- \pi ^+ $ detection asymmetry for the two magnet polarities, and for the mean value. The correction for the $ K ^0$ asymmetry is applied in the bottom row. The mean values in the last column are obtained first by taking the arithmetic average over the magnet polarities and then by taking the weighted averages of the 2011 and 2012 data sets. The uncertainties are statistical only. |
Table_3.pdf [51 KiB] HiDef png [41 KiB] Thumbnail [18 KiB] tex code |

|
|
Asymmetries (in %) used in the calculation of $\Delta A_{ C P }$ for the two magnet polarities. The values for $\Delta A_{ C P }$ are corrected for the mistag probability. The mean values in the last column are obtained first by taking the arithmetic average over the magnet polarities and then by taking the weighted averages of the 2011 and 2012 data sets. The uncertainties are statistical only. |
Table_4.pdf [51 KiB] HiDef png [44 KiB] Thumbnail [22 KiB] tex code |

|
|
Asymmetries (in %) used in the calculation of $ A_{ C P }( K ^- K ^+ )$ for the two magnet polarities. The values for $ A_{ C P }( K ^- K ^+ )$ are corrected for the mistag probability. The mean values in the last column are obtained first by taking the arithmetic average over the magnet polarities and then by taking the weighted averages of the 2011 and 2012 data sets. The uncertainties are statistical only. |
Table_5.pdf [52 KiB] HiDef png [55 KiB] Thumbnail [28 KiB] tex code |

|
|
Contributions to the systematic uncertainty of $\Delta A_{ C P }$ and $ A_{ C P }( K ^- K ^+ )$ . |
Table_6.pdf [49 KiB] HiDef png [122 KiB] Thumbnail [53 KiB] tex code |

|
![HiDef png [76 KiB]](Directory_LHCb-PAPER-2014-013/hidef_Table_1.png)
![HiDef png [96 KiB]](Directory_LHCb-PAPER-2014-013/hidef_Table_2.png)
![HiDef png [41 KiB]](Directory_LHCb-PAPER-2014-013/hidef_Table_3.png)
![HiDef png [44 KiB]](Directory_LHCb-PAPER-2014-013/hidef_Table_4.png)
![HiDef png [55 KiB]](Directory_LHCb-PAPER-2014-013/hidef_Table_5.png)
![HiDef png [122 KiB]](Directory_LHCb-PAPER-2014-013/hidef_Table_6.png)
Supplementary Material [file]
| Supplementary material full pdf |
supple[..].pdf [118 KiB] |
|
|
This ZIP file contains supplemetary material for the publication LHCb-PAPER-2014-013. The files are: Supplementary.pdf : An overview of the extra figures *.pdf, *.png, *.eps, *.C : The figures in variuous formats |
Fig1a-S.pdf [13 KiB] HiDef png [134 KiB] Thumbnail [110 KiB] *C file |
|
|
Fig1b-S.pdf [17 KiB] HiDef png [594 KiB] Thumbnail [328 KiB] *C file |
|
![HiDef png [134 KiB]](Directory_LHCb-PAPER-2014-013/supplementary/hidef_Fig1a-S.png)
![HiDef png [594 KiB]](Directory_LHCb-PAPER-2014-013/supplementary/hidef_Fig1b-S.png)
Created on 27 April 2024.