Information
LHCb-PAPER-2014-014
CERN-PH-EP-2014-061
arXiv:1404.1903 [PDF]
(Submitted on 07 Apr 2014)
Phys. Rev. Lett. 112 (2014) 222002
Inspire 1288881
Tools
Abstract
Resonant structures in $B^0\to\psi'\pi^-K^+$ decays are analyzed by performing a four-dimensional fit of the decay amplitude, using $pp$ collision data corresponding to $\rm 3 fb^{-1}$ collected with the LHCb detector. The data cannot be described with $K^+\pi^-$ resonances alone, which is confirmed with a model-independent approach. A highly significant $Z(4430)^-\to\psi'\pi^-$ component is required, thus confirming the existence of this state. The observed evolution of the $Z(4430)^-$ amplitude with the $\psi'\pi^-$ mass establishes the resonant nature of this particle. The mass and width measurements are substantially improved. The spin-parity is determined unambiguously to be $1^+$.
Figures and captions
|
Background-subtracted and efficiency-corrected $m_{\psi'\pi^-}$ distribution (black data points), superimposed with the reflections of $\cos\theta_{K^*}$ moments up to order four allowing for $J(K^*)\le 2$ (blue line) and their correlated statistical uncertainty (yellow band bounded by blue dashed lines). The distributions have been normalized to unity. |
manal2.pdf [20 KiB] HiDef png [218 KiB] Thumbnail [162 KiB] *.C file |

|
|
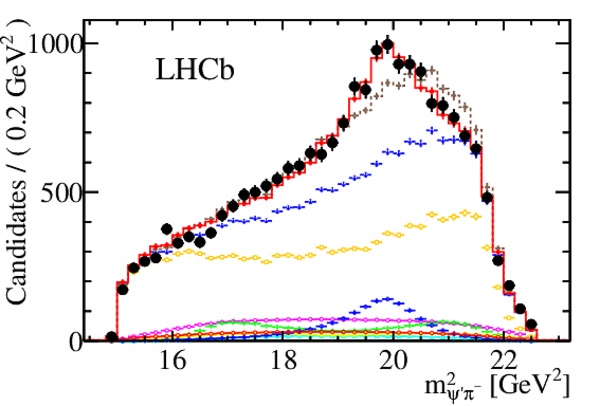
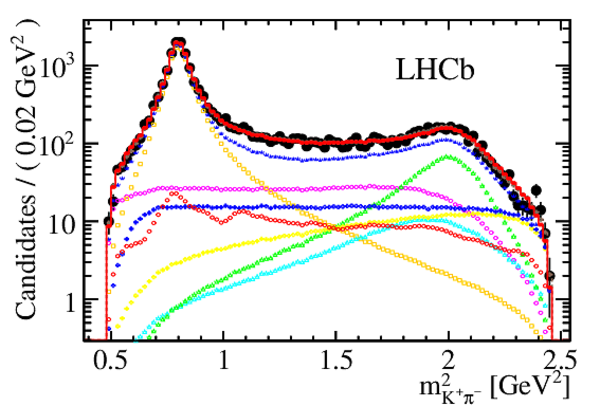
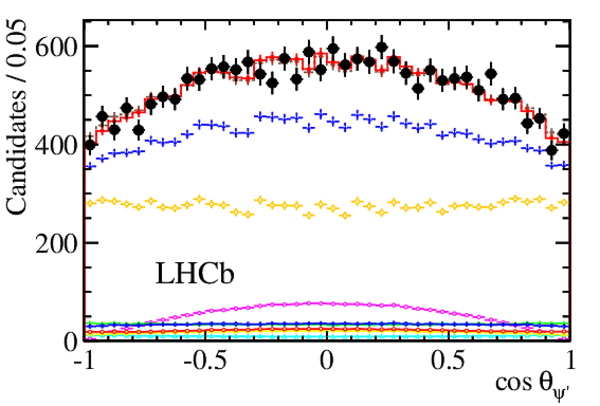
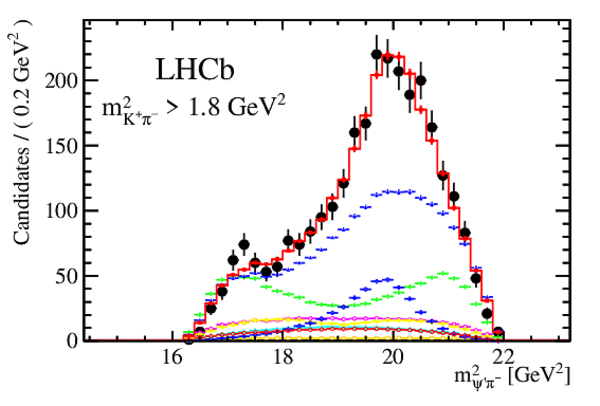
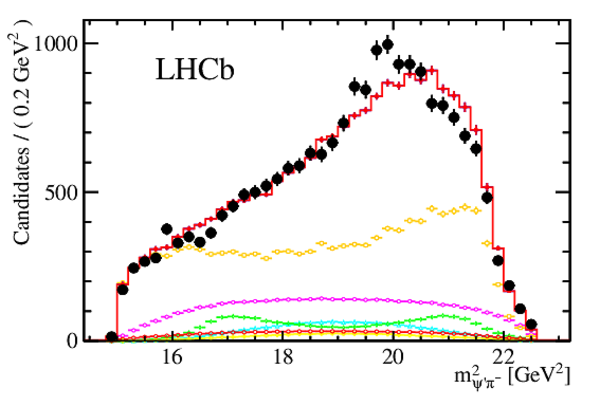
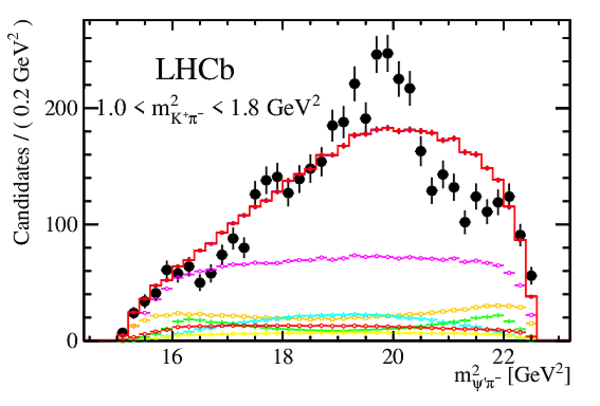
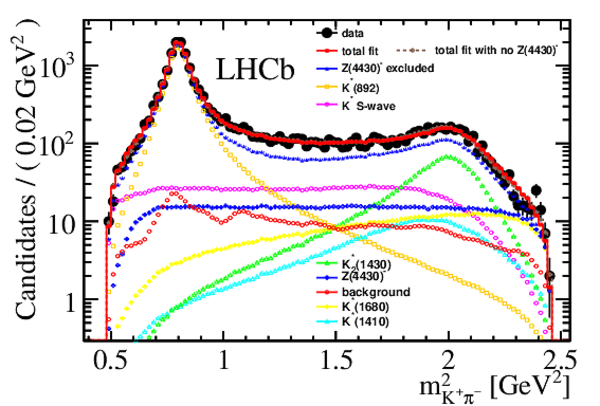
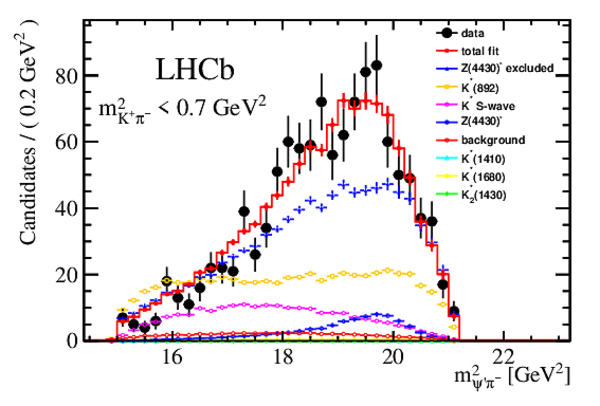
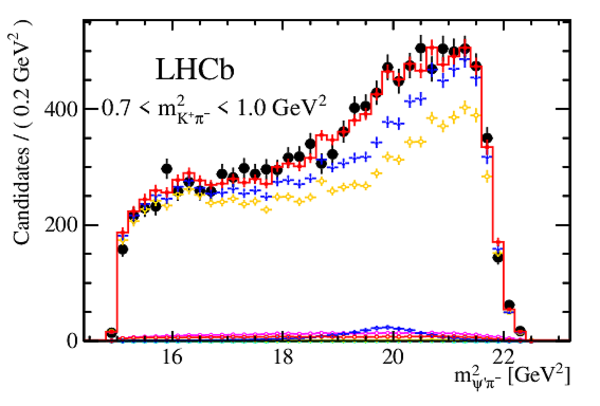
Distributions of the fit variables (black data points) together with the projections of the 4D fit. The red solid (brown dashed) histogram represents the total amplitude with (without) the $ Z_1^-$ . The other points illustrate various subcomponents of the fit that includes the $ Z_1^-$ : the upper (lower) blue points represent the $ Z_1^-$ component removed (taken alone). The orange, magenta, cyan, yellow, green, and red points represent the $K^*(892)$, total $S$-wave, $K^*(1410)$, $K^*(1680)$, $K^*_2(1430)$ and background terms, respectively. |
mpsippi2.pdf [39 KiB] HiDef png [293 KiB] Thumbnail [194 KiB] *.C file |
|
|
mkpi2.pdf [64 KiB] HiDef png [436 KiB] Thumbnail [256 KiB] *.C file |
|
|
|
cospsip.pdf [40 KiB] HiDef png [329 KiB] Thumbnail [215 KiB] *.C file |
|
|
|
phi.pdf [25 KiB] HiDef png [209 KiB] Thumbnail [163 KiB] *.C file |

|
|
|
Fitted values of the $ Z_1^-$ amplitude in six $m_{\psi'\pi^-}^2$ bins, shown in an Argand diagram (connected points with the error bars, $m_{\psi'\pi^-}^2$ increases counterclockwise). The red curve is the prediction from the Breit-Wigner formula with a resonance mass (width) of 4475 (172) $\mathrm{ Me V}$ and magnitude scaled to intersect the bin with the largest magnitude centered at (4477 MeV)$^2$. Units are arbitrary. The phase convention assumes the helicity-zero $K^*(892)$ amplitude to be real. |
argand.pdf [14 KiB] HiDef png [146 KiB] Thumbnail [130 KiB] *.C file |

|
|
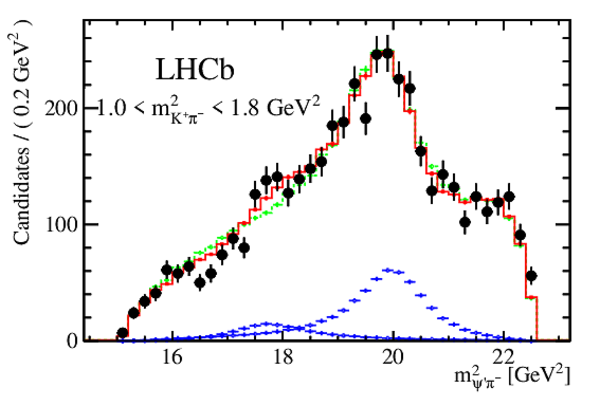
Distribution of $m_{\psi'\pi^-}^2$ in the data (black points) for $1.0<m_{K^+\pi^-}^2<1.8$ GeV$^2$ ($K^*(892)$, $K^*_2(1430)$ veto region) compared with the fit with two, $0^-$ and $1^+$ (solid-line red histogram) and only one $1^+$ (dashed-line green histogram) $Z^-$ resonances. Individual $Z^-$ terms (blue points) are shown for the fit with two $Z^-$ resonances. |
twoz.pdf [28 KiB] HiDef png [196 KiB] Thumbnail [156 KiB] *.C file |
|
|
Animated gif made out of all figures. |
PAPER-2014-014.gif Thumbnail |

|
Supplementary Material [file]


![HiDef png [218 KiB]](Directory_LHCb-PAPER-2014-014/hidef_manal2.png)
![HiDef png [293 KiB]](Directory_LHCb-PAPER-2014-014/hidef_mpsippi2.png)
![HiDef png [436 KiB]](Directory_LHCb-PAPER-2014-014/hidef_mkpi2.png)
![HiDef png [329 KiB]](Directory_LHCb-PAPER-2014-014/hidef_cospsip.png)
![HiDef png [209 KiB]](Directory_LHCb-PAPER-2014-014/hidef_phi.png)
![HiDef png [146 KiB]](Directory_LHCb-PAPER-2014-014/hidef_argand.png)
![HiDef png [196 KiB]](Directory_LHCb-PAPER-2014-014/hidef_twoz.png)
![HiDef png [176 KiB]](Directory_LHCb-PAPER-2014-014/supplementary/hidef_Fig10S.png)
![HiDef png [227 KiB]](Directory_LHCb-PAPER-2014-014/supplementary/hidef_Fig11S.png)
![HiDef png [225 KiB]](Directory_LHCb-PAPER-2014-014/supplementary/hidef_Fig12S.png)
![HiDef png [244 KiB]](Directory_LHCb-PAPER-2014-014/supplementary/hidef_Fig13S.png)
![HiDef png [190 KiB]](Directory_LHCb-PAPER-2014-014/supplementary/hidef_Fig1S.png)
![HiDef png [297 KiB]](Directory_LHCb-PAPER-2014-014/supplementary/hidef_Fig2S.png)
![HiDef png [231 KiB]](Directory_LHCb-PAPER-2014-014/supplementary/hidef_Fig3S.png)
![HiDef png [159 KiB]](Directory_LHCb-PAPER-2014-014/supplementary/hidef_Fig4S.png)
![HiDef png [488 KiB]](Directory_LHCb-PAPER-2014-014/supplementary/hidef_Fig5S.png)
![HiDef png [344 KiB]](Directory_LHCb-PAPER-2014-014/supplementary/hidef_Fig6S.png)
![HiDef png [277 KiB]](Directory_LHCb-PAPER-2014-014/supplementary/hidef_Fig7S.png)
![HiDef png [255 KiB]](Directory_LHCb-PAPER-2014-014/supplementary/hidef_Fig8S.png)
![HiDef png [261 KiB]](Directory_LHCb-PAPER-2014-014/supplementary/hidef_Fig9S.png)
Created on 26 April 2024.