Study of $\Upsilon$ production and cold nuclear matter effects in pPb collisions at $\sqrt{s_{NN}}=5 \mathrm{TeV}$
[to restricted-access page]Information
LHCb-PAPER-2014-015
CERN-PH-EP-2014-102
arXiv:1405.5152 [PDF]
(Submitted on 20 May 2014)
JHEP 07 (2014) 094
Inspire 1297230
Tools
Abstract
Production of $\Upsilon$ mesons in proton-lead collisions at a nucleon-nucleon centre-of-mass energy $\sqrt{s_{NN}}=5 \mathrm{TeV}$ is studied with the LHCb detector. The analysis is based on a data sample corresponding to an integrated luminosity of $1.6 \mathrm{nb}^{-1}$. The $\Upsilon$ mesons of transverse momenta up to $15 \mathrm{GeV}/c$ are reconstructed in the dimuon decay mode. The rapidity coverage in the centre-of-mass system is $1.5<y<4.0$ (forward region) and $-5.0<y<-2.5$ (backward region). The forward-backward production ratio and the nuclear modification factor for $\Upsilon(1S)$ mesons are determined. The data are compatible with the predictions for a suppression of $\Upsilon(1S)$ production with respect to proton-proton collisions in the forward region, and an enhancement in the backward region. The suppression is found to be smaller than in the case of prompt $J/\psi$ mesons.
Figures and captions
|
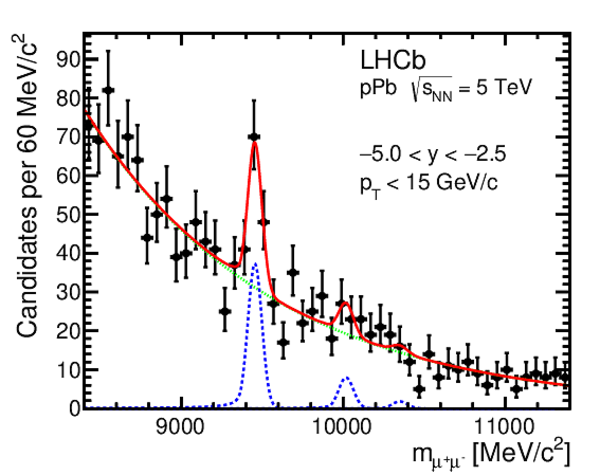
Invariant mass distribution of $\mu^{+}\mu^{-}$ pairs in the (left) forward and (right) backward samples of $ p\mathrm{Pb} $ collisions. The transverse momentum range is $ p_{\rm T} <15 {\mathrm{ Ge V /}c} $. The rapidity range is $1.5<y<4.0$ ($-5.0<y<-2.5$) for the forward (backward) sample. The black dots are the data points, the blue dashed curve indicates the signal component, the green dotted curve represents the combinatorial background, and the red solid curve is the sum of the signal and background components. |
Fig1a.pdf [22 KiB] HiDef png [258 KiB] Thumbnail [218 KiB] *.C file |

|
|
Fig1b.pdf [22 KiB] HiDef png [261 KiB] Thumbnail [242 KiB] *.C file |
|
|
|
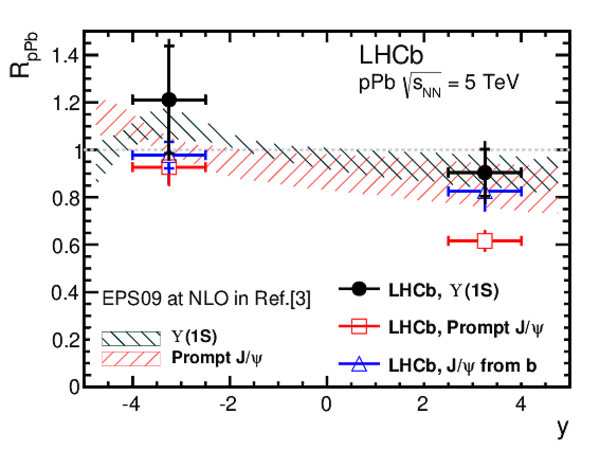
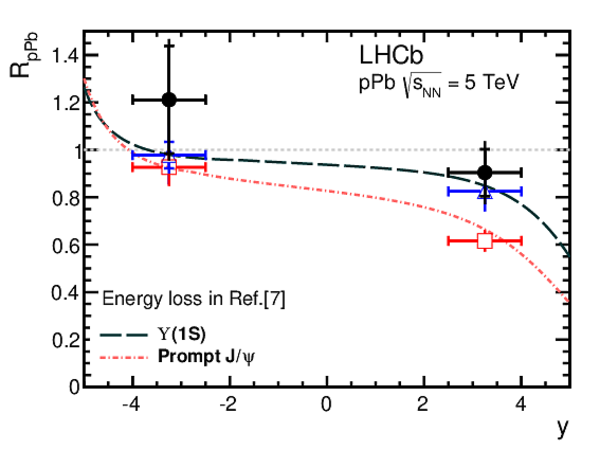
Nuclear modification factor, $R_{p\mathrm{Pb}}$, compared to other measurements and theoretical predictions. The black dots, red squares, and blue triangles indicate the LHCb measurements for $\Y1S$ mesons, prompt $ { J \mskip -3mu/\mskip -2mu\psi \mskip 2mu}$ mesons, and $ { J \mskip -3mu/\mskip -2mu\psi \mskip 2mu}$ from $b$-hadron decays, respectively [28]. The inner error bars (delimited by the horizontal lines) show the statistical uncertainties; the outer ones show the statistical and systematic uncertainties added in quadrature. The data are compared with theoretical predictions for $\Upsilon$ and prompt $ { J \mskip -3mu/\mskip -2mu\psi \mskip 2mu} $ mesons from different models, one per panel. The shaded areas indicate the uncertainties of the theoretical calculations. |
Fig2a.pdf [15 KiB] HiDef png [313 KiB] Thumbnail [215 KiB] *.C file |

|
|
Fig2b.pdf [15 KiB] HiDef png [268 KiB] Thumbnail [208 KiB] *.C file |
|
|
|
Fig2c.pdf [15 KiB] HiDef png [182 KiB] Thumbnail [147 KiB] *.C file |
|
|
|
Fig2d.pdf [15 KiB] HiDef png [190 KiB] Thumbnail [155 KiB] *.C file |

|
|
|
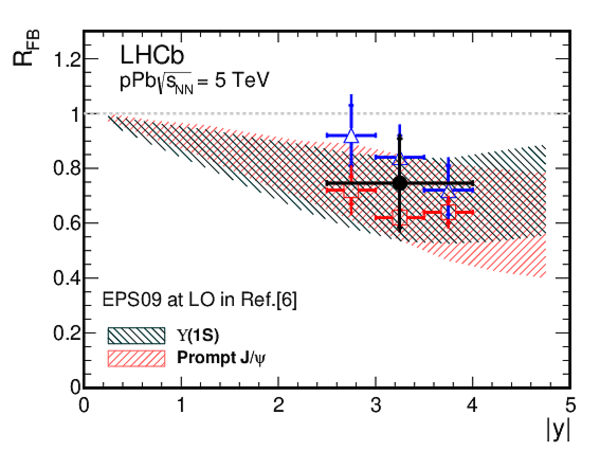
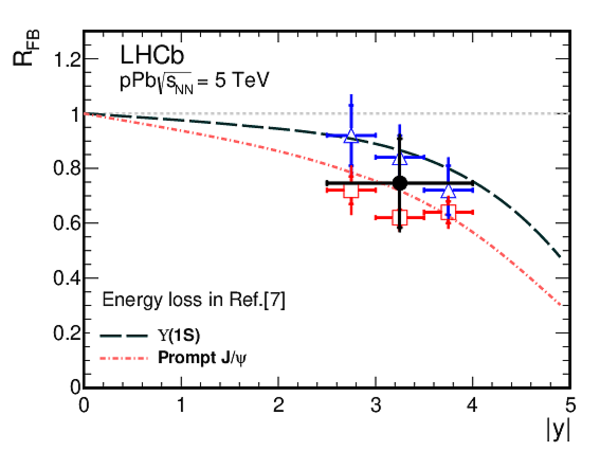
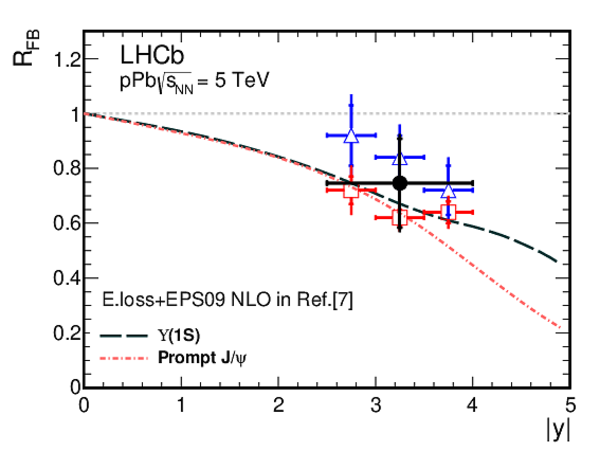
Forward-backward production ratio, $R_{ {FB}}$, as a function of absolute rapidity. The black dots, red squares, and blue triangles indicate the LHCb measurements for $\Y1S$ mesons, prompt $ { J \mskip -3mu/\mskip -2mu\psi \mskip 2mu}$ mesons, and $ { J \mskip -3mu/\mskip -2mu\psi \mskip 2mu}$ from $b$-hadron decays, respectively [28]. The inner error bars (delimited by the horizontal lines) show the statistical uncertainties; the outer ones show the statistical and systematic uncertainties added in quadrature. The data are compared with theoretical predictions for $\Upsilon$\/ and prompt $ { J \mskip -3mu/\mskip -2mu\psi \mskip 2mu} $\/ mesons from different models, one per panel. The shaded areas indicate the uncertainties of the theoretical calculations. |
Fig3a.pdf [16 KiB] HiDef png [546 KiB] Thumbnail [297 KiB] *.C file |
|
|
Fig3b.pdf [17 KiB] HiDef png [319 KiB] Thumbnail [232 KiB] *.C file |

|
|
|
Fig3c.pdf [15 KiB] HiDef png [177 KiB] Thumbnail [143 KiB] *.C file |
|
|
|
Fig3d.pdf [15 KiB] HiDef png [176 KiB] Thumbnail [144 KiB] *.C file |
|
|
|
Animated gif made out of all figures. |
PAPER-2014-015.gif Thumbnail |

|
![HiDef png [258 KiB]](Directory_LHCb-PAPER-2014-015/hidef_Fig1a.png)
![HiDef png [261 KiB]](Directory_LHCb-PAPER-2014-015/hidef_Fig1b.png)
![HiDef png [313 KiB]](Directory_LHCb-PAPER-2014-015/hidef_Fig2a.png)
![HiDef png [268 KiB]](Directory_LHCb-PAPER-2014-015/hidef_Fig2b.png)
![HiDef png [182 KiB]](Directory_LHCb-PAPER-2014-015/hidef_Fig2c.png)
![HiDef png [190 KiB]](Directory_LHCb-PAPER-2014-015/hidef_Fig2d.png)
![HiDef png [546 KiB]](Directory_LHCb-PAPER-2014-015/hidef_Fig3a.png)
![HiDef png [319 KiB]](Directory_LHCb-PAPER-2014-015/hidef_Fig3b.png)
![HiDef png [177 KiB]](Directory_LHCb-PAPER-2014-015/hidef_Fig3c.png)
![HiDef png [176 KiB]](Directory_LHCb-PAPER-2014-015/hidef_Fig3d.png)
Tables and captions
|
Relative systematic uncertainties on the cross-sections, in percent, in the full rapidity range. The values in parenthesis refer specifically to $\Y1S$ measurements when systematic uncertainties in the common rapidity range $2.5<|y|<4.0$ are notably different. |
Table_1.pdf [19 KiB] HiDef png [80 KiB] Thumbnail [37 KiB] tex code |

|
![HiDef png [80 KiB]](Directory_LHCb-PAPER-2014-015/hidef_Table_1.png)
Created on 27 April 2024.