Measurement of $CP$ violation and constraints on the CKM angle $\gamma$ in $B^{\pm}\rightarrow D K^{\pm}$ with $D \rightarrow K_S^0 \pi^+ \pi^-$ decays
[to restricted-access page]Information
LHCb-PAPER-2014-017
CERN-PH-EP-2014-166
arXiv:1407.6211 [PDF]
(Submitted on 23 Jul 2014)
Nucl. Phys. B888 (2014) 169
Inspire 1307418
Tools
Abstract
A model-dependent amplitude analysis of $B^{\pm} \rightarrow D K^{\pm}$ with $D \rightarrow K_S^0 \pi^+ \pi^-$ decays is performed using proton-proton collision data, corresponding to an integrated luminosity of $1$ fb$^{-1}$, recorded by LHCb at a centre-of-mass energy of $7$ TeV in $2011$. Values of the $CP$ violation observables $x_{\pm}$ and $y_{\pm}$, which are sensitive to the CKM angle $\gamma$, are measured to be \begin{align*} x_- &= +0.027 \pm 0.044 ^{+0.010}_{-0.008} \pm 0.001, \\ y_- &= +0.013 \pm 0.048 ^{+0.009}_{-0.007} \pm 0.003, \\ x_+ &= -0.084 \pm 0.045 \pm 0.009 \pm 0.005, \\ y_+ &= -0.032 \pm 0.048 ^{+0.010}_{-0.009} \pm 0.008, \end{align*} where the first uncertainty is statistical, the second systematic and the third arises from the uncertainty of the $D \rightarrow K_S^0 \pi^+ \pi^-$ amplitude model. The value of $\gamma$ is determined to be $(84^{+49}_{-42})^\circ$, including all sources of uncertainty. Neutral $D$ meson mixing is found to have negligible effect.
Figures and captions
|
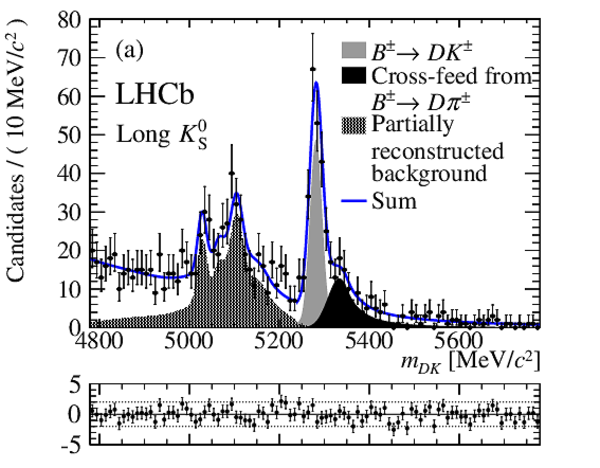
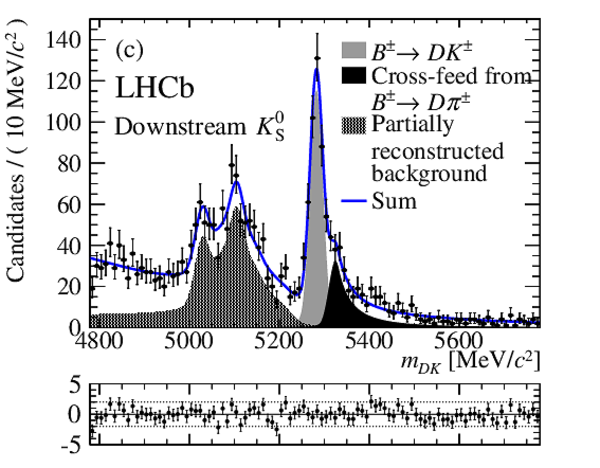
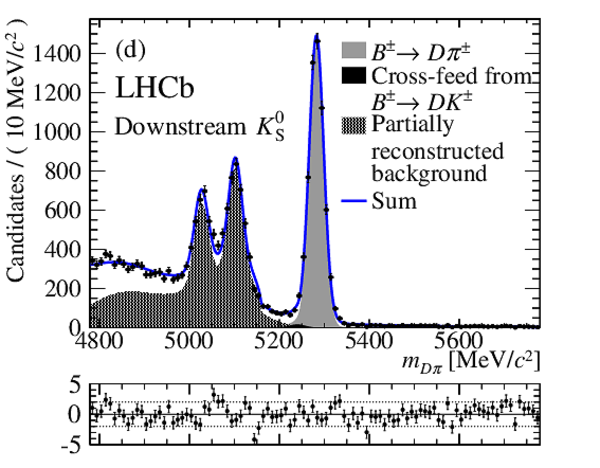
Invariant mass distributions for (a) $ B ^\pm \rightarrow D (\rightarrow K ^0_{\rm\scriptscriptstyle S} \pi ^+ \pi ^- ) K ^\pm $ {\it long}, (b) $ B ^\pm \rightarrow D (\rightarrow K ^0_{\rm\scriptscriptstyle S} \pi ^+ \pi ^- ) \pi ^\pm $ {\it long}, (c) $ B ^\pm \rightarrow D (\rightarrow K ^0_{\rm\scriptscriptstyle S} \pi ^+ \pi ^- ) K ^\pm $ {\it downstream} and (d) $ B ^\pm \rightarrow D (\rightarrow K ^0_{\rm\scriptscriptstyle S} \pi ^+ \pi ^- ) \pi ^\pm $ {\it downstream} candidates. The fit results, including signal and background components, are superimposed. The lower plots are normalised residual distributions. |
Fig1a.pdf [44 KiB] HiDef png [446 KiB] Thumbnail [363 KiB] *.C file |
|
|
Fig1b.pdf [44 KiB] HiDef png [473 KiB] Thumbnail [362 KiB] *.C file |

|
|
|
Fig1c.pdf [44 KiB] HiDef png [471 KiB] Thumbnail [373 KiB] *.C file |
|
|
|
Fig1d.pdf [44 KiB] HiDef png [480 KiB] Thumbnail [365 KiB] *.C file |
|
|
|
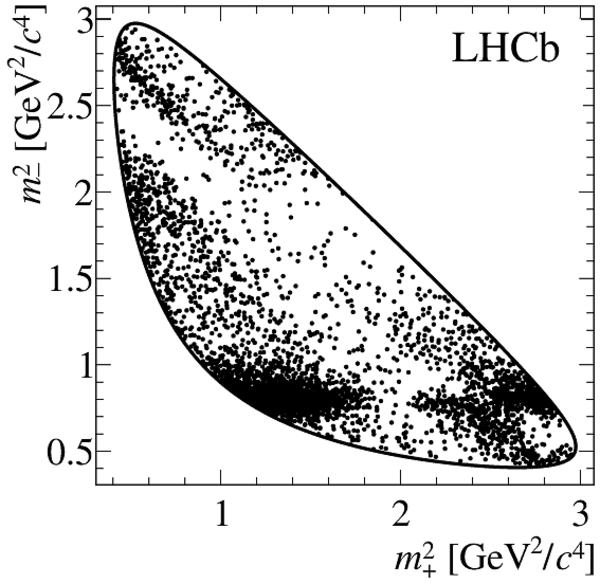
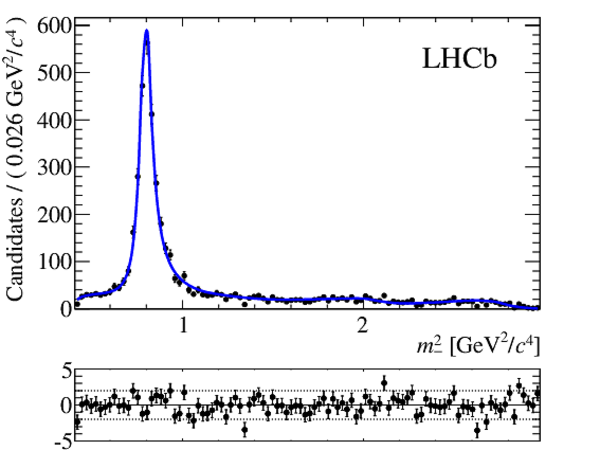
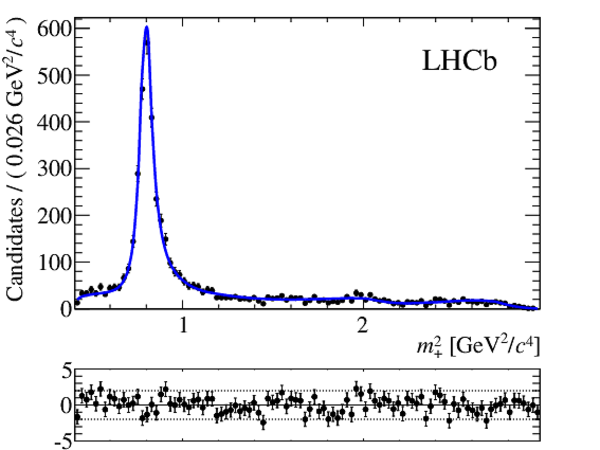
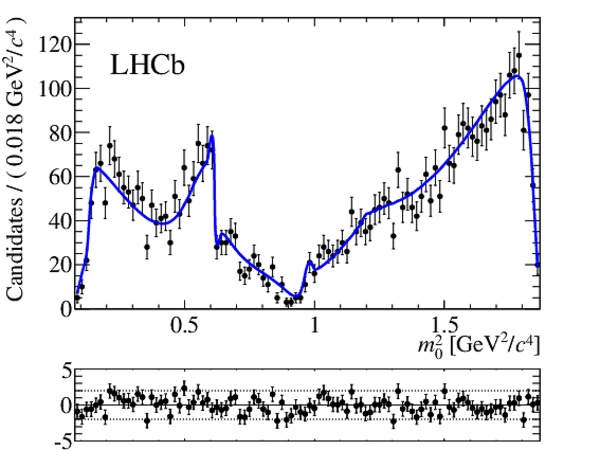
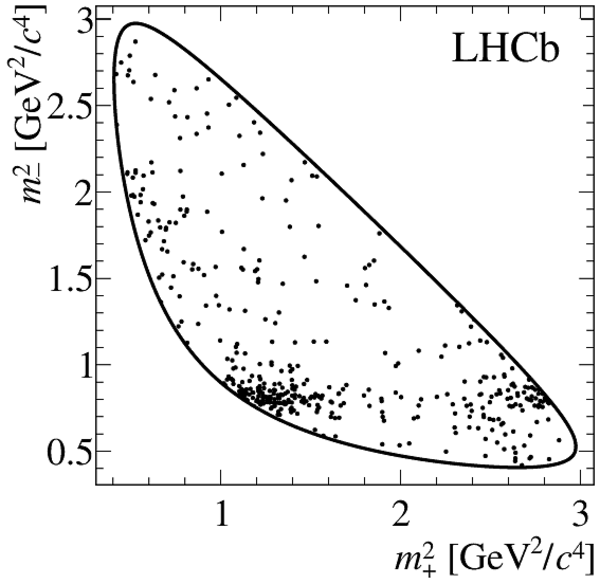
Dalitz plot and its projections, with fit result superimposed, for $B^- \rightarrow D \pi^-$ candidates; $m_{\pm}^2 \equiv m_{ K ^0_{\rm\scriptscriptstyle S} \pi ^\pm }^2$ and $m_{0}^2 \equiv m_{\pi ^+ \pi ^- }^2$. The lower parts of the figures are normalised residual distributions. |
Fig2a.pdf [173 KiB] HiDef png [311 KiB] Thumbnail [172 KiB] *.C file |
|
|
Fig2b.pdf [26 KiB] HiDef png [226 KiB] Thumbnail [198 KiB] *.C file |
|
|
|
Fig2c.pdf [29 KiB] HiDef png [268 KiB] Thumbnail [241 KiB] *.C file |
|
|
|
Fig2d.pdf [30 KiB] HiDef png [275 KiB] Thumbnail [247 KiB] *.C file |
|
|
|
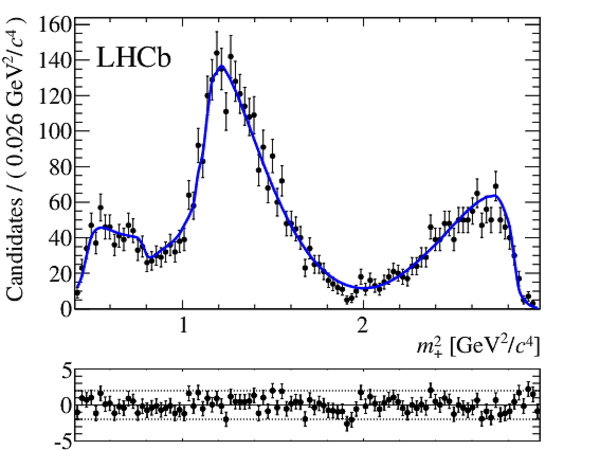
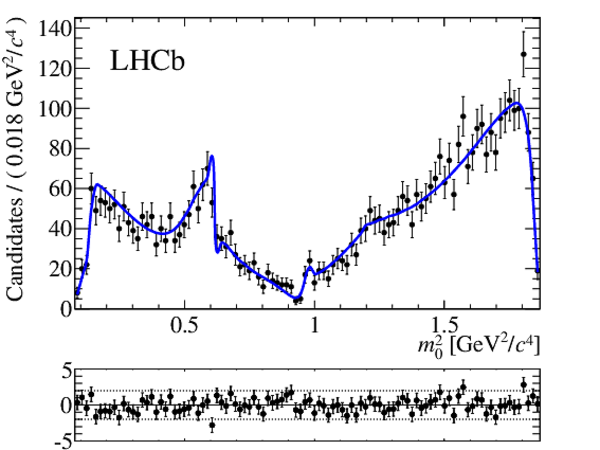
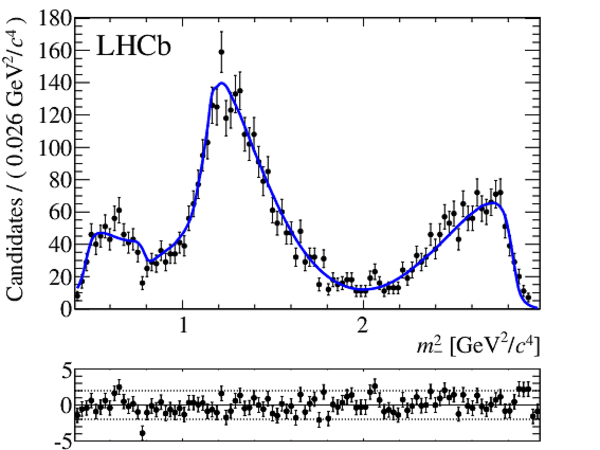
Dalitz plot and its projections, with fit result superimposed, for $B^+ \rightarrow D \pi^+$ candidates; $m_{\pm}^2 \equiv m_{ K ^0_{\rm\scriptscriptstyle S} \pi ^\pm }^2$ and $m_{0}^2 \equiv m_{\pi ^+ \pi ^- }^2$. The lower parts of the figures are normalised residual distributions. |
Fig3a.pdf [177 KiB] HiDef png [311 KiB] Thumbnail [173 KiB] *.C file |

|
|
Fig3b.pdf [30 KiB] HiDef png [268 KiB] Thumbnail [245 KiB] *.C file |
|
|
|
Fig3c.pdf [27 KiB] HiDef png [227 KiB] Thumbnail [198 KiB] *.C file |
|
|
|
Fig3d.pdf [30 KiB] HiDef png [278 KiB] Thumbnail [247 KiB] *.C file |
|
|
|
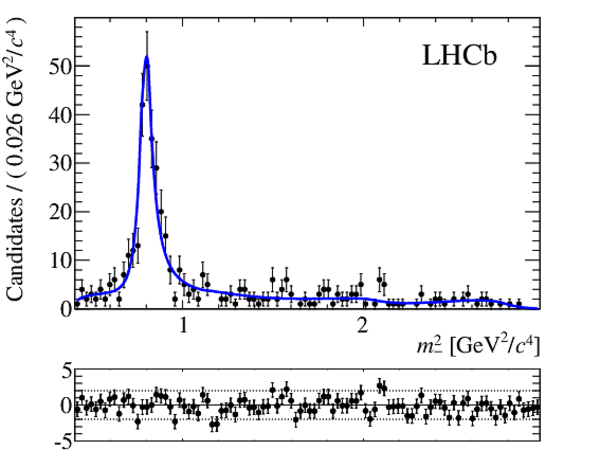
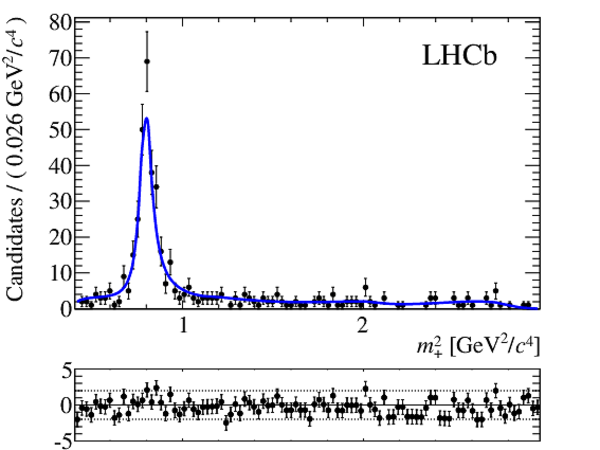
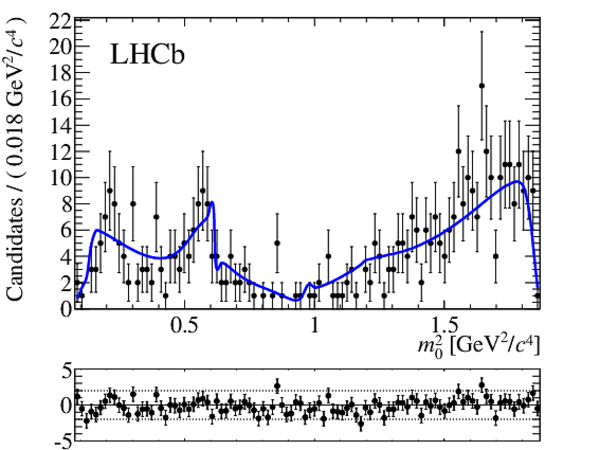
Dalitz plot and its projections, with fit result superimposed, for $B^- \rightarrow D K^-$ candidates; $m_{\pm}^2 \equiv m_{ K ^0_{\rm\scriptscriptstyle S} \pi ^\pm }^2$ and $m_{0}^2 \equiv m_{\pi ^+ \pi ^- }^2$. The lower parts of the figures are normalised residual distributions. |
Fig4a.pdf [52 KiB] HiDef png [161 KiB] Thumbnail [96 KiB] *.C file |
|
|
Fig4b.pdf [28 KiB] HiDef png [238 KiB] Thumbnail [210 KiB] *.C file |
|
|
|
Fig4c.pdf [29 KiB] HiDef png [265 KiB] Thumbnail [250 KiB] *.C file |

|
|
|
Fig4d.pdf [29 KiB] HiDef png [280 KiB] Thumbnail [254 KiB] *.C file |

|
|
|
Dalitz plot and its projections, with fit result superimposed, for $B^+ \rightarrow D K^+$ candidates; $m_{\pm}^2 \equiv m_{ K ^0_{\rm\scriptscriptstyle S} \pi ^\pm }^2$ and $m_{0}^2 \equiv m_{\pi ^+ \pi ^- }^2$. The lower parts of the figures are normalised residual distributions. |
Fig5a.pdf [52 KiB] HiDef png [156 KiB] Thumbnail [92 KiB] *.C file |

|
|
Fig5b.pdf [29 KiB] HiDef png [268 KiB] Thumbnail [250 KiB] *.C file |

|
|
|
Fig5c.pdf [28 KiB] HiDef png [232 KiB] Thumbnail [211 KiB] *.C file |
|
|
|
Fig5d.pdf [29 KiB] HiDef png [274 KiB] Thumbnail [257 KiB] *.C file |
|
|
|
Likelihood contours at 39.35%, 86.47%, 98.89% and 99.97% confidence level for $(x_{+},y_{+})$ (blue) and $(x_{-},y_{-})$ (red). |
Fig6.pdf [19 KiB] HiDef png [275 KiB] Thumbnail [204 KiB] *.C file |

|
|
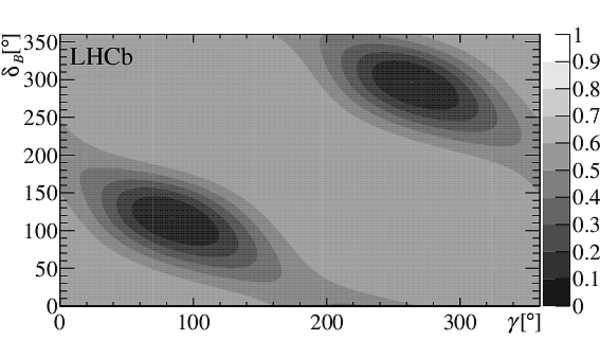
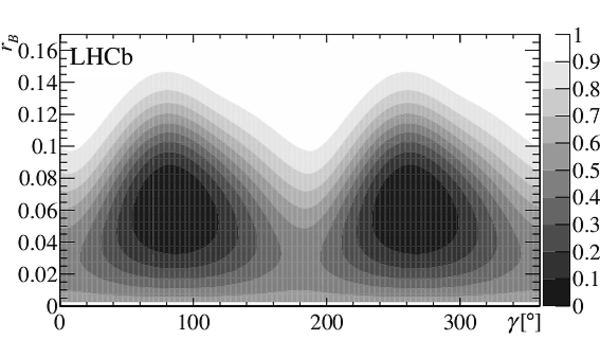
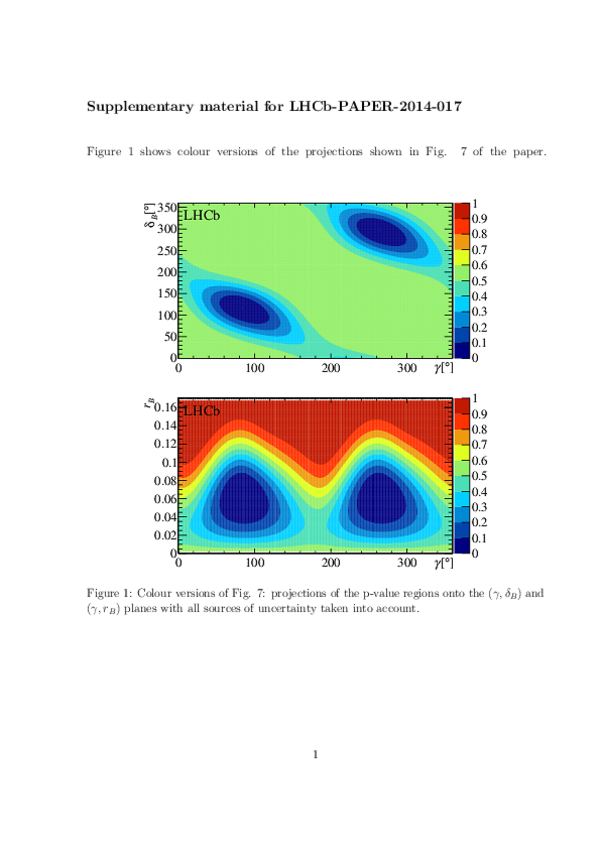
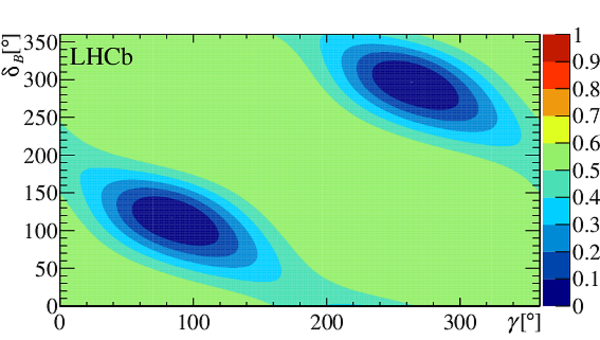
Projections of the p-value regions onto the $(\gamma, \delta_{ B })$ and $(\gamma, r_{ B })$ planes with all sources of uncertainty taken into account. |
Fig7a.pdf [1 MiB] HiDef png [908 KiB] Thumbnail [264 KiB] *.C file |
|
|
Fig7b.pdf [223 KiB] HiDef png [397 KiB] Thumbnail [189 KiB] *.C file |
|
|
|
Animated gif made out of all figures. |
PAPER-2014-017.gif Thumbnail |

|
![HiDef png [446 KiB]](Directory_LHCb-PAPER-2014-017/hidef_Fig1a.png)
![HiDef png [473 KiB]](Directory_LHCb-PAPER-2014-017/hidef_Fig1b.png)
![HiDef png [471 KiB]](Directory_LHCb-PAPER-2014-017/hidef_Fig1c.png)
![HiDef png [480 KiB]](Directory_LHCb-PAPER-2014-017/hidef_Fig1d.png)
![HiDef png [311 KiB]](Directory_LHCb-PAPER-2014-017/hidef_Fig2a.png)
![HiDef png [226 KiB]](Directory_LHCb-PAPER-2014-017/hidef_Fig2b.png)
![HiDef png [268 KiB]](Directory_LHCb-PAPER-2014-017/hidef_Fig2c.png)
![HiDef png [275 KiB]](Directory_LHCb-PAPER-2014-017/hidef_Fig2d.png)
![HiDef png [311 KiB]](Directory_LHCb-PAPER-2014-017/hidef_Fig3a.png)
![HiDef png [268 KiB]](Directory_LHCb-PAPER-2014-017/hidef_Fig3b.png)
![HiDef png [227 KiB]](Directory_LHCb-PAPER-2014-017/hidef_Fig3c.png)
![HiDef png [278 KiB]](Directory_LHCb-PAPER-2014-017/hidef_Fig3d.png)
![HiDef png [161 KiB]](Directory_LHCb-PAPER-2014-017/hidef_Fig4a.png)
![HiDef png [238 KiB]](Directory_LHCb-PAPER-2014-017/hidef_Fig4b.png)
![HiDef png [265 KiB]](Directory_LHCb-PAPER-2014-017/hidef_Fig4c.png)
![HiDef png [280 KiB]](Directory_LHCb-PAPER-2014-017/hidef_Fig4d.png)
![HiDef png [156 KiB]](Directory_LHCb-PAPER-2014-017/hidef_Fig5a.png)
![HiDef png [268 KiB]](Directory_LHCb-PAPER-2014-017/hidef_Fig5b.png)
![HiDef png [232 KiB]](Directory_LHCb-PAPER-2014-017/hidef_Fig5c.png)
![HiDef png [274 KiB]](Directory_LHCb-PAPER-2014-017/hidef_Fig5d.png)
![HiDef png [275 KiB]](Directory_LHCb-PAPER-2014-017/hidef_Fig6.png)
![HiDef png [908 KiB]](Directory_LHCb-PAPER-2014-017/hidef_Fig7a.png)
![HiDef png [397 KiB]](Directory_LHCb-PAPER-2014-017/hidef_Fig7b.png)
Tables and captions
|
Signal and background yields for components contributing to the $ C P$ asymmetry fit, in the region $\pm 50 {\mathrm{ Me V /}c^2} $ around the known $ B ^\pm$ meson mass. |
Table_1.pdf [64 KiB] HiDef png [91 KiB] Thumbnail [41 KiB] tex code |

|
|
Absolute values of systematic uncertainties. The $ C P$ asymmetry fit bias is considered as a one-sided uncertainty and is included in the quadrature sum on that side only. |
Table_2.pdf [65 KiB] HiDef png [91 KiB] Thumbnail [38 KiB] tex code |

|
|
Model related systematic uncertainties for each alternative model. The relative signs indicate full correlation or anti-correlation. |
Table_3.pdf [52 KiB] HiDef png [121 KiB] Thumbnail [55 KiB] tex code |

|
![HiDef png [91 KiB]](Directory_LHCb-PAPER-2014-017/hidef_Table_1.png)
![HiDef png [91 KiB]](Directory_LHCb-PAPER-2014-017/hidef_Table_2.png)
![HiDef png [121 KiB]](Directory_LHCb-PAPER-2014-017/hidef_Table_3.png)
Supplementary Material [file]
| Supplementary material full pdf |
supple[..].pdf [1 MiB] |
|
|
This ZIP file contains supplementary material for the publication LHCb-PAPER-2014-017. The files are: Supplementary.pdf : An overview of the extra figures (colour versions of Figure 7 of the paper) *.pdf, *.png, *.eps, *.C : The figures in various formats |
Fig1_g[..].pdf [1 MiB] HiDef png [2 MiB] Thumbnail [686 KiB] *C file |
|
|
Fig1_g[..].pdf [217 KiB] HiDef png [1 MiB] Thumbnail [529 KiB] *C file |

|
![HiDef png [2 MiB]](Directory_LHCb-PAPER-2014-017/supplementary/hidef_Fig1_gamma_deltaB.png)
![HiDef png [1 MiB]](Directory_LHCb-PAPER-2014-017/supplementary/hidef_Fig1_gamma_rB.png)
Created on 02 May 2024.