Search for $CP$ violation in $D^{\pm}\rightarrow K^0_S K^{\pm}$ and $D^{\pm}_{s}\rightarrow K^0_S \pi^{\pm}$ decays
[to restricted-access page]Information
LHCb-PAPER-2014-018
CERN-PH-EP-2014-125
arXiv:1406.2624 [PDF]
(Submitted on 10 Jun 2014)
JHEP 10 (2014) 025
Inspire 1299995
Tools
Abstract
A search for \CP violation in Cabibbo-suppressed $D^{\pm}\rightarrow K^0_{\mathrm{S}} K^{\pm}$ and $D^{\pm}_{s}\rightarrow K^0_{\mathrm{S}} \pi^{\pm}$ decays is performed using $pp$ collision data, corresponding to an integrated luminosity of 3 fb$^{-1}$, recorded by the LHCb experiment. The individual $CP$-violating asymmetries are measured to be \begin{eqnarray*} \mathcal{A}_{CP}^{D^{\pm}\rightarrow K^0_{\mathrm{S}} K^{\pm}} & = & (+0.03 \pm 0.17 \pm 0.14) \% \mathcal{A}_{CP}^{D^{\pm}_{s}\rightarrow K^0_{\mathrm{S}} \pi^{\pm}} & = & (+0.38 \pm 0.46 \pm 0.17) \%, \end{eqnarray*} assuming that $CP$ violation in the Cabibbo-favoured decays is negligible. A combination of the measured asymmetries for the four decay modes $D^{\pm}_{(s)}\rightarrow K^0_{\mathrm{S}} K^{\pm}$ and $D^{\pm}_{(s)}\rightarrow K^0_{\mathrm{S}} \pi^{\pm}$ gives the sum \[ \mathcal{A}_{CP}^{D^{\pm}\rightarrow K^0_{\mathrm{S}} K^{\pm}} + \mathcal{A}_{CP}^{D^{\pm}_{s}\rightarrow K^0_{\mathrm{S}} \pi^{\pm}} = (+0.41 \pm 0.49 \pm 0.26) \%. \] In all cases, the first uncertainties are statistical and the second systematic. The results represent the most precise measurements of these asymmetries to date and show no evidence for CP violation.
Figures and captions
|
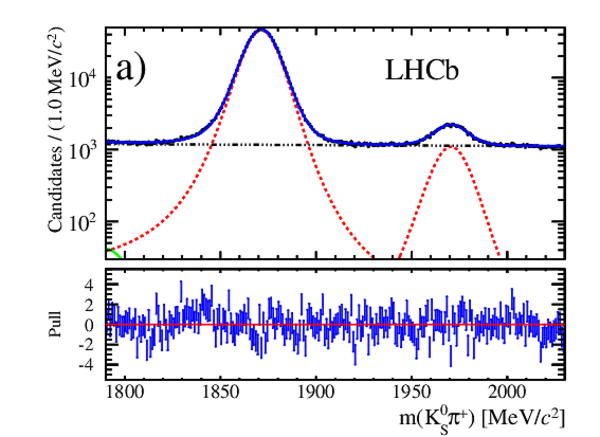
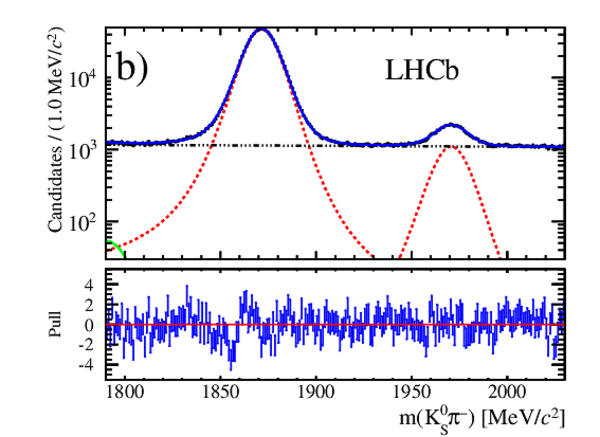
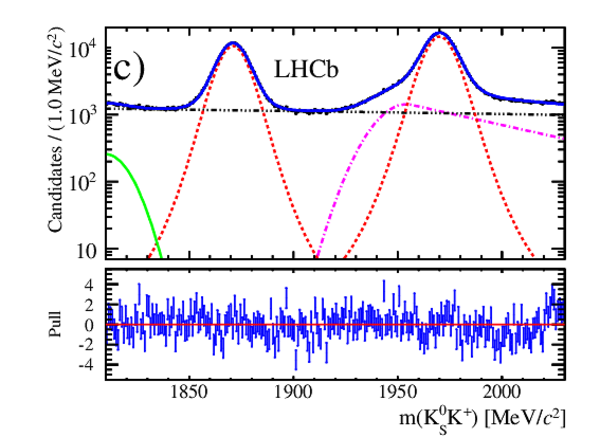
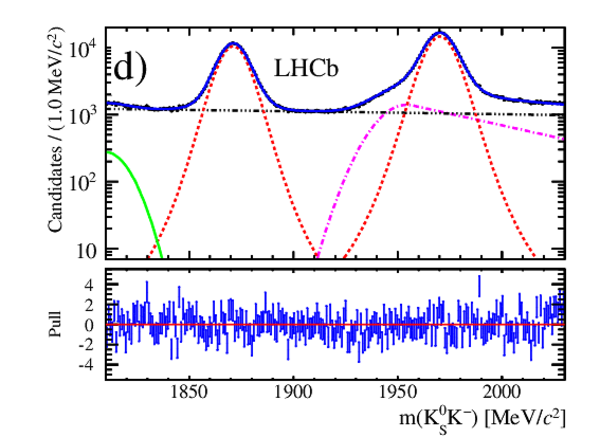
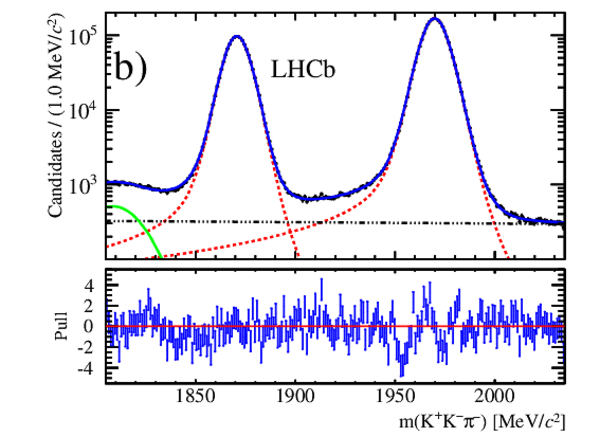
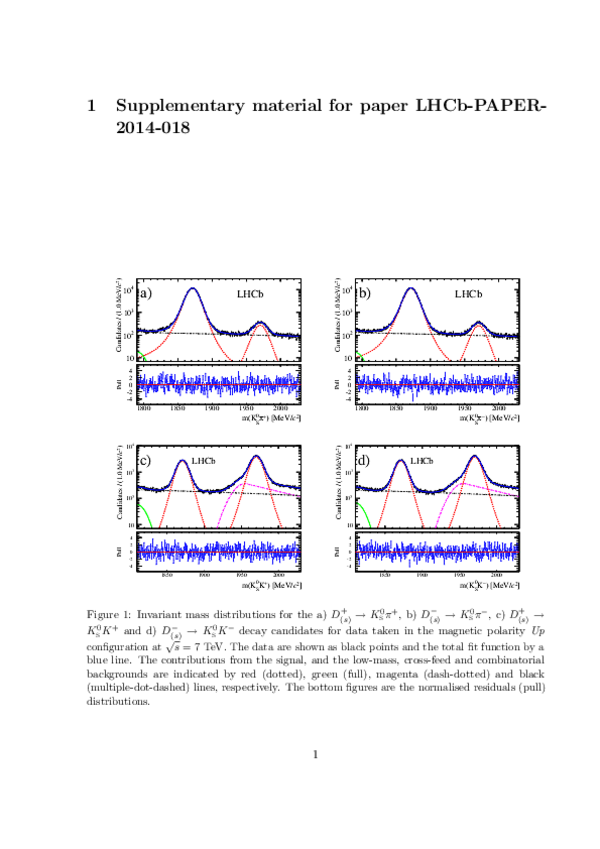
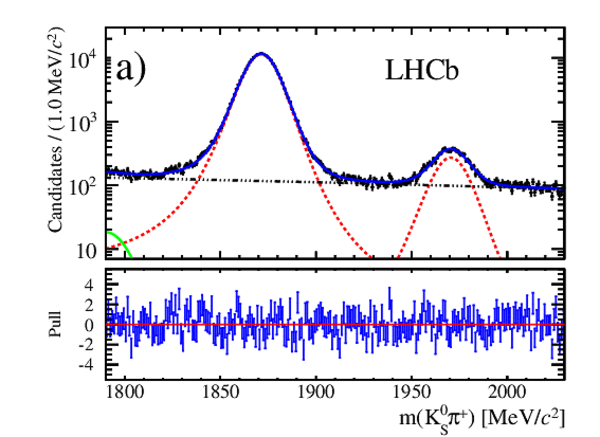
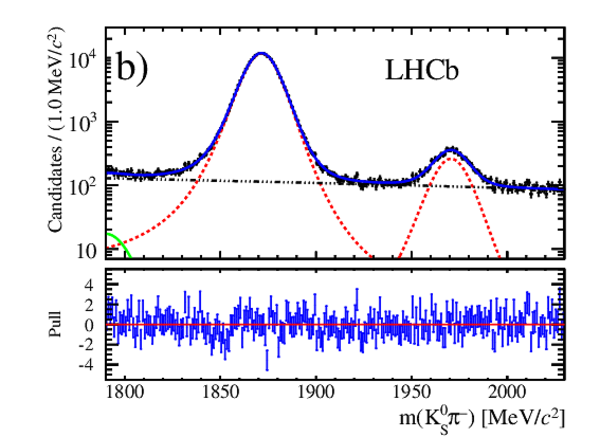
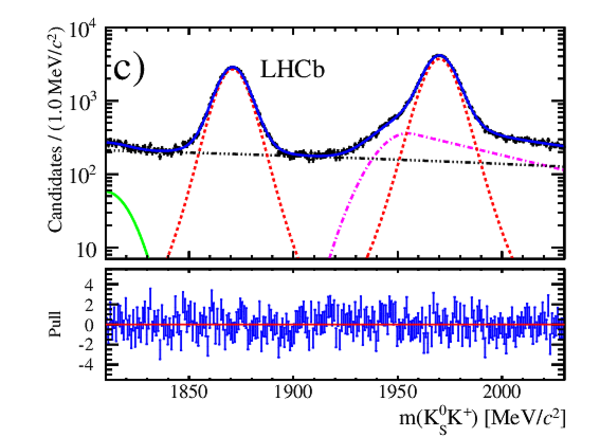
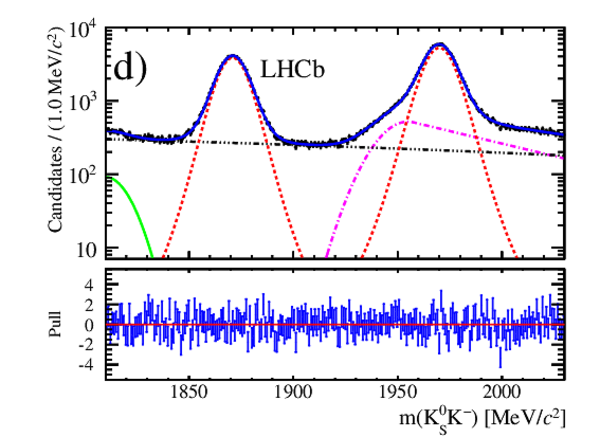
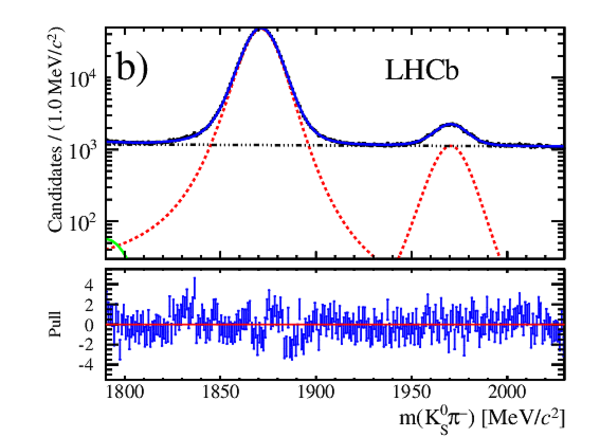
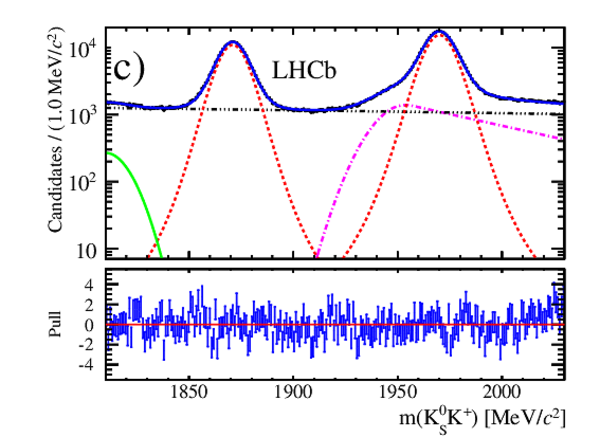
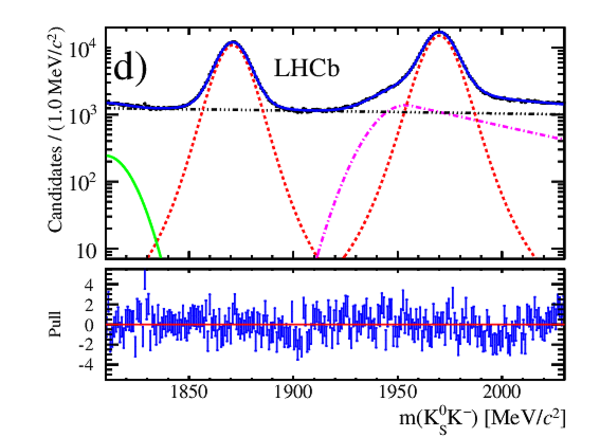
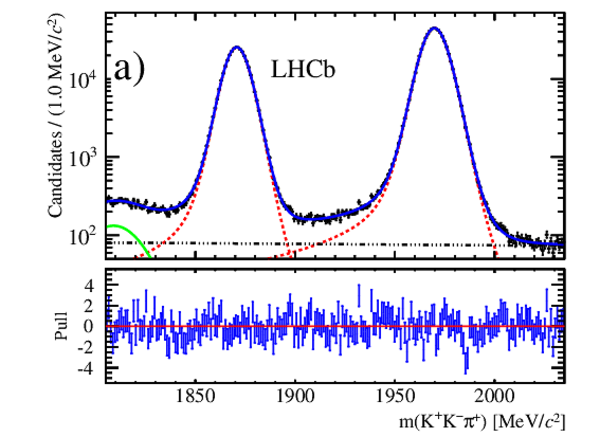
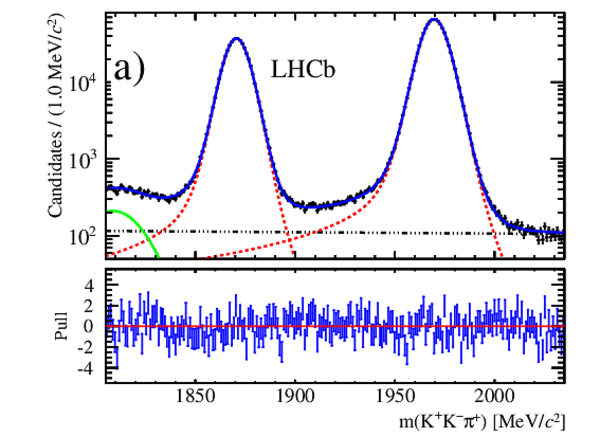
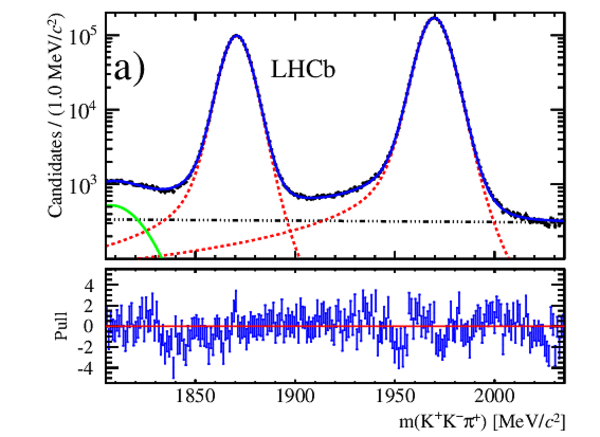
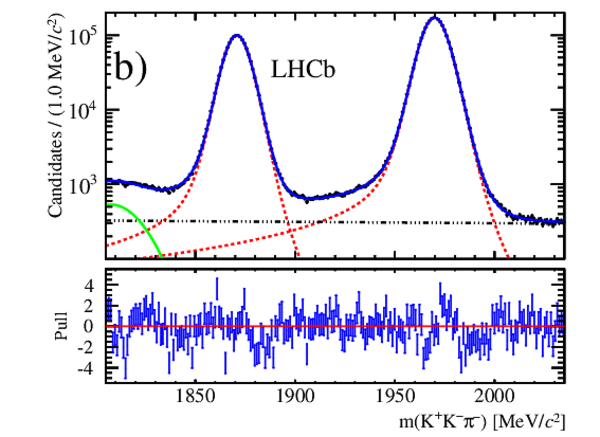
Invariant mass distributions for the a) $ D ^+ _{(s)} \rightarrow K ^0_{\rm\scriptscriptstyle S} \pi ^+ $ , b) $ D ^- _{(s)} \rightarrow K ^0_{\rm\scriptscriptstyle S} \pi ^- $ , c) $ D ^+ _{(s)} \rightarrow K ^0_{\rm\scriptscriptstyle S} K ^+ $ and d) $ D ^- _{(s)} \rightarrow K ^0_{\rm\scriptscriptstyle S} K ^- $ decay candidates for data taken in the magnetic polarity {\it Up} configuration at $\sqrt{s}=8$ TeV. The data are shown as black points and the total fit function by a blue line. The contributions from the signal and the low-mass, cross-feed and combinatorial backgrounds are indicated by red (dotted), green (full), magenta (dash-dotted) and black (multiple-dot-dashed) lines, respectively. The bottom figures are the normalised residuals (pull) distributions. |
Fig1a.pdf [37 KiB] HiDef png [303 KiB] Thumbnail [226 KiB] *.C file |
|
|
Fig1b.pdf [46 KiB] HiDef png [302 KiB] Thumbnail [223 KiB] *.C file |
|
|
|
Fig1c.pdf [47 KiB] HiDef png [325 KiB] Thumbnail [239 KiB] *.C file |
|
|
|
Fig1d.pdf [47 KiB] HiDef png [325 KiB] Thumbnail [238 KiB] *.C file |
|
|
|
Invariant mass distributions for the a) $ D ^+ _{(s)} \rightarrow \phi \pi ^+ $ and b) $ D ^- _{(s)} \rightarrow \phi \pi ^- $ decay candidates for data taken in the magnet polarity {\it Up} configuration at $\sqrt{s}=8$ TeV. The data are shown as black points and the total fit function by a blue line. The contributions from the signal and the low-mass and combinatorial backgrounds are indicated by red (dotted), green (full) and black (multiple-dot-dashed) lines, respectively. The bottom figures are the normalised residuals (pull) distributions. |
Fig2a.pdf [43 KiB] HiDef png [322 KiB] Thumbnail [240 KiB] *.C file |

|
|
Fig2b.pdf [43 KiB] HiDef png [320 KiB] Thumbnail [238 KiB] *.C file |
|
|
|
Animated gif made out of all figures. |
PAPER-2014-018.gif Thumbnail |

|
Tables and captions
|
Signal yields. |
Table_1.pdf [57 KiB] HiDef png [154 KiB] Thumbnail [66 KiB] tex code |

|
|
Measured asymmetries (in %) for the decay modes $ D ^\pm \rightarrow K ^0_{\rm\scriptscriptstyle S} \pi ^\pm $ , $ D ^{\pm}_ s \rightarrow K ^0_{\rm\scriptscriptstyle S} \pi ^\pm $ , $ D ^{\pm}_ s \rightarrow K ^0_{\rm\scriptscriptstyle S} K ^\pm $ and $ D ^{\pm}_ s \rightarrow \phi \pi ^\pm $ and the calculated $ C P$ asymmetries. The results are reported separately for $\sqrt{s}=7$ TeV and $\sqrt{s}=8$ TeV data and the two magnetic polarities ({\it Up} and {\it Down}). The combined results are given in the final column. The quoted uncertainties are statistical only. |
Table_2.pdf [83 KiB] HiDef png [96 KiB] Thumbnail [48 KiB] tex code |

|
|
Systematic uncertainties (absolute values in %) on the $ C P$ asymmetries for $\sqrt{s}=7$ and $8$ TeV data. The total systematic uncertainty is the sum in quadrature of the individual contributions. |
Table_3.pdf [77 KiB] HiDef png [67 KiB] Thumbnail [29 KiB] tex code |

|
Supplementary Material [file]


![HiDef png [303 KiB]](Directory_LHCb-PAPER-2014-018/hidef_Fig1a.png)
![HiDef png [302 KiB]](Directory_LHCb-PAPER-2014-018/hidef_Fig1b.png)
![HiDef png [325 KiB]](Directory_LHCb-PAPER-2014-018/hidef_Fig1c.png)
![HiDef png [325 KiB]](Directory_LHCb-PAPER-2014-018/hidef_Fig1d.png)
![HiDef png [322 KiB]](Directory_LHCb-PAPER-2014-018/hidef_Fig2a.png)
![HiDef png [320 KiB]](Directory_LHCb-PAPER-2014-018/hidef_Fig2b.png)
![HiDef png [154 KiB]](Directory_LHCb-PAPER-2014-018/hidef_Table_1.png)
![HiDef png [96 KiB]](Directory_LHCb-PAPER-2014-018/hidef_Table_2.png)
![HiDef png [67 KiB]](Directory_LHCb-PAPER-2014-018/hidef_Table_3.png)
![HiDef png [319 KiB]](Directory_LHCb-PAPER-2014-018/supplementary/hidef_Fig3a.png)
![HiDef png [316 KiB]](Directory_LHCb-PAPER-2014-018/supplementary/hidef_Fig3b.png)
![HiDef png [329 KiB]](Directory_LHCb-PAPER-2014-018/supplementary/hidef_Fig3c.png)
![HiDef png [329 KiB]](Directory_LHCb-PAPER-2014-018/supplementary/hidef_Fig3d.png)
![HiDef png [314 KiB]](Directory_LHCb-PAPER-2014-018/supplementary/hidef_Fig4a.png)
![HiDef png [316 KiB]](Directory_LHCb-PAPER-2014-018/supplementary/hidef_Fig4b.png)
![HiDef png [329 KiB]](Directory_LHCb-PAPER-2014-018/supplementary/hidef_Fig4c.png)
![HiDef png [327 KiB]](Directory_LHCb-PAPER-2014-018/supplementary/hidef_Fig4d.png)
![HiDef png [304 KiB]](Directory_LHCb-PAPER-2014-018/supplementary/hidef_Fig5a.png)
![HiDef png [302 KiB]](Directory_LHCb-PAPER-2014-018/supplementary/hidef_Fig5b.png)
![HiDef png [325 KiB]](Directory_LHCb-PAPER-2014-018/supplementary/hidef_Fig5c.png)
![HiDef png [327 KiB]](Directory_LHCb-PAPER-2014-018/supplementary/hidef_Fig5d.png)
![HiDef png [327 KiB]](Directory_LHCb-PAPER-2014-018/supplementary/hidef_Fig6a.png)
![HiDef png [325 KiB]](Directory_LHCb-PAPER-2014-018/supplementary/hidef_Fig6b.png)
![HiDef png [328 KiB]](Directory_LHCb-PAPER-2014-018/supplementary/hidef_Fig7a.png)
![HiDef png [329 KiB]](Directory_LHCb-PAPER-2014-018/supplementary/hidef_Fig7b.png)
![HiDef png [324 KiB]](Directory_LHCb-PAPER-2014-018/supplementary/hidef_Fig8a.png)
![HiDef png [323 KiB]](Directory_LHCb-PAPER-2014-018/supplementary/hidef_Fig8b.png)
Created on 27 April 2024.