Measurement of the CP-violating phase $\phi_s$ in $\overline{B}^0_s\rightarrow J/\psi \pi^+\pi^-$ decays
[to restricted-access page]Information
LHCb-PAPER-2014-019
CERN-PH-EP-2014-086
arXiv:1405.4140 [PDF]
(Submitted on 16 May 2014)
Phys. Lett. B736 (2014) 186
Inspire 1296831
Tools
Abstract
The mixing-induced CP-violating phase $\phi_s$ in ${B}^0_s$ and $\overline{B}^0_s$ decays is measured using the $J/\psi \pi^+\pi^-$ final state in data, taken from 3 fb$^{-1}$ of integrated luminosity, collected with the LHCb detector in 7 and 8 TeV centre-of-mass $pp$ collisions at the LHC. A time-dependent flavour-tagged amplitude analysis, allowing for direct \CP violation, yields a value for the phase $\phi_s=70\pm 68\pm 8$ mrad. This result is consistent with the Standard Model expectation and previous measurements.
Figures and captions
|
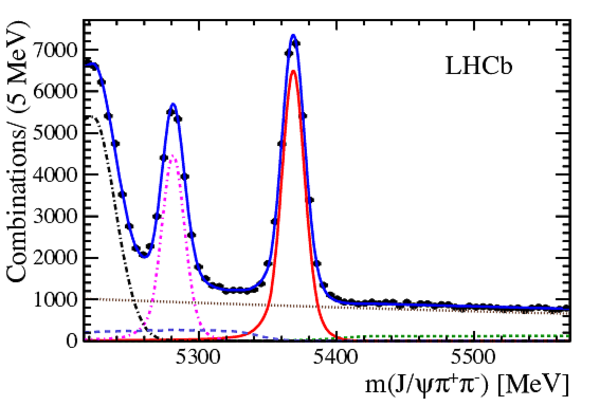
Invariant mass of $J/\psi \pi^+\pi^-$ combinations. The data are fitted with double Crystal Ball signal functions and several background functions. The (red) solid line shows the $\optbar{ B}{} ^0_{ s}$ signal, the (brown) dotted line shows the exponential combinatorial background, the (green) short-dashed line shows the $B^{\mp}$ background, the (magenta) dot-dashed line shows the $\optbar{ B}{} ^0$ signal, the (light blue) dashed line is the sum of $\optbar{ B}{} ^0_{ s}\rightarrow J/\psi\eta'$, $\optbar{ B}{} ^0_{ s}\rightarrow J/\psi\phi$, $\phi\rightarrow \pi^+\pi^-\pi^0$ backgrounds, and the $\Lambda ^0_ b \rightarrow { J \mskip -3mu/\mskip -2mu\psi \mskip 2mu} K^- p$ plus $\ensuremath\overline{{\Lambda ^0_ b }} \rightarrow { J \mskip -3mu/\mskip -2mu\psi \mskip 2mu} K^+\overline{p}$ reflections, the (black) dot-dashed line is the $\optbar{ B}{} ^0\rightarrow J/\psi K^{\mp} \pi^{\pm}$ reflection and the (blue) solid line is the total. |
fitm-ft.pdf [50 KiB] HiDef png [300 KiB] Thumbnail [217 KiB] *.C file |
|
|
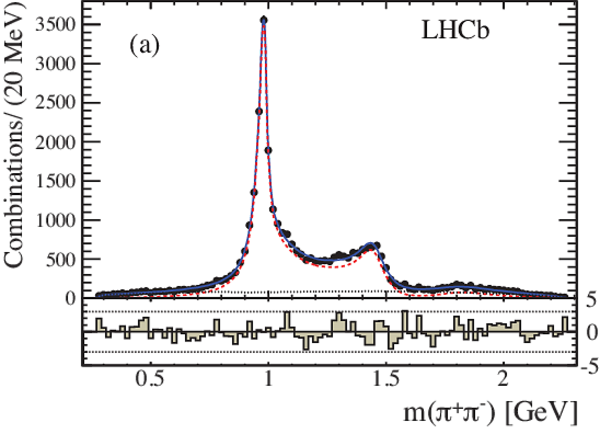
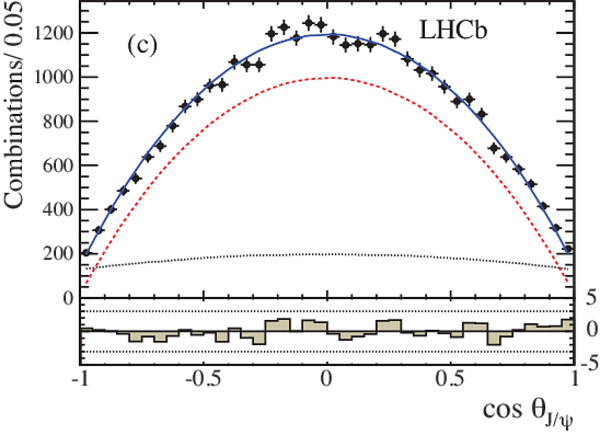
Projections of (a) $m(\pi^+\pi^-)$, (b) $\cos\theta_{\pi\pi}$, (c) $\cos \theta_{J/\psi}$ and (d) $\chi$ [13]. The points with error bars are data, the signal fits are shown with (red) dashed lines, the background with a (black) dotted lines, and the (blue) solid lines represent the total fits. The difference between the data and the fits divided by the uncertainty on the data is shown below. |
mpp6N0.pdf [40 KiB] HiDef png [391 KiB] Thumbnail [258 KiB] *.C file |
|
|
cospp6N0.pdf [39 KiB] HiDef png [345 KiB] Thumbnail [231 KiB] *.C file |

|
|
|
cosH6N0.pdf [40 KiB] HiDef png [363 KiB] Thumbnail [236 KiB] *.C file |
|
|
|
chi6N0.pdf [47 KiB] HiDef png [305 KiB] Thumbnail [214 KiB] *.C file |

|
|
|
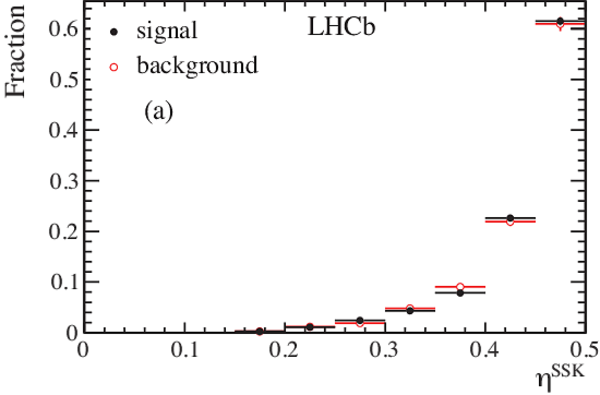
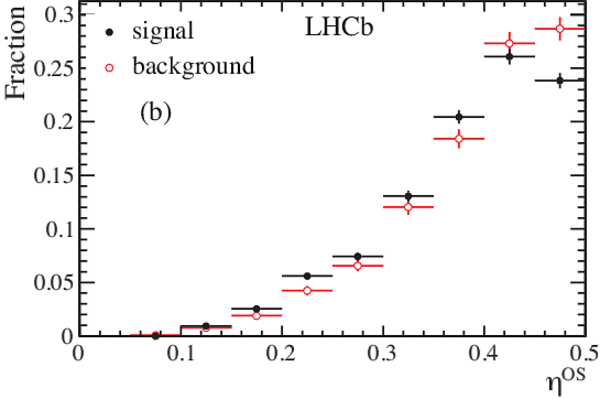
Estimated fractions of mistag probabilities from (a) the SSK tagger, $\eta^{\rm SSK}$, and (b) the OS tagger, $\eta^{\rm OS}$. |
etaSS_1d.pdf [31 KiB] HiDef png [154 KiB] Thumbnail [113 KiB] *.C file |
|
|
etaOS_1d.pdf [32 KiB] HiDef png [170 KiB] Thumbnail [127 KiB] *.C file |
|
|
|
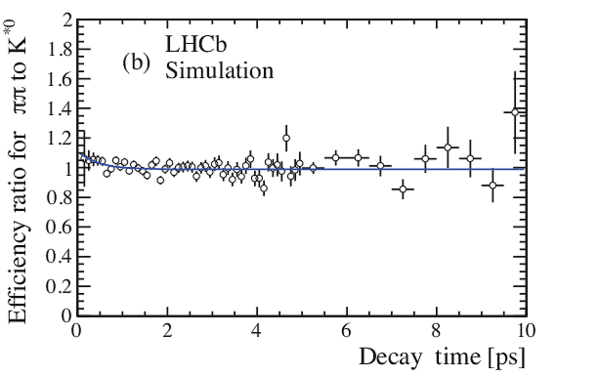
Distributions of (a) decay time of $\optbar{ B}{} ^0 \rightarrow J/\psi \optbar{ K}{} ^{ *0}$ candidates in data, (b) ratio of time acceptance between $\overline{ B }{} ^0_ s \rightarrow { J \mskip -3mu/\mskip -2mu\psi \mskip 2mu} \pi^+\pi^-$ and $\overline{ B }{} ^0 \rightarrow J/\psi \overline{ K }{} ^{*0} $ decays from simulation. |
fitkst.pdf [35 KiB] HiDef png [269 KiB] Thumbnail [166 KiB] *.C file |

|
|
eff-ratio.pdf [35 KiB] HiDef png [288 KiB] Thumbnail [153 KiB] *.C file |
|
|
|
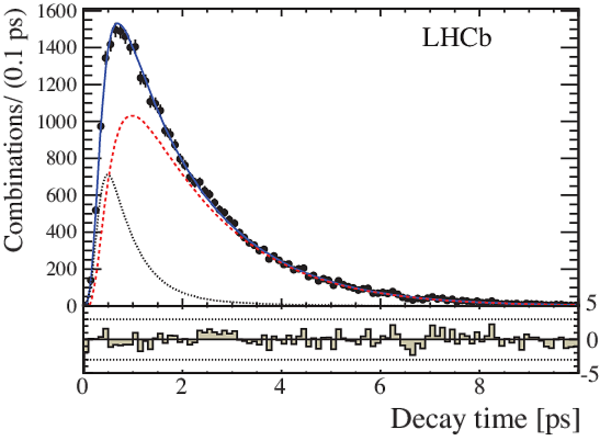
Decay time distribution of $\optbar{ B}{} ^0\rightarrow { J \mskip -3mu/\mskip -2mu\psi \mskip 2mu} \pi^+\pi^-$ candidates. The signal PDF is shown with a (red) dashed line, the background with a (black) dotted line, and the (blue) solid line represents the total. |
time6NII5.pdf [39 KiB] HiDef png [402 KiB] Thumbnail [256 KiB] *.C file |
|
|
Animated gif made out of all figures. |
PAPER-2014-019.gif Thumbnail |

|
![HiDef png [300 KiB]](Directory_LHCb-PAPER-2014-019/hidef_fitm-ft.png)
![HiDef png [391 KiB]](Directory_LHCb-PAPER-2014-019/hidef_mpp6N0.png)
![HiDef png [345 KiB]](Directory_LHCb-PAPER-2014-019/hidef_cospp6N0.png)
![HiDef png [363 KiB]](Directory_LHCb-PAPER-2014-019/hidef_cosH6N0.png)
![HiDef png [305 KiB]](Directory_LHCb-PAPER-2014-019/hidef_chi6N0.png)
![HiDef png [154 KiB]](Directory_LHCb-PAPER-2014-019/hidef_etaSS_1d.png)
![HiDef png [170 KiB]](Directory_LHCb-PAPER-2014-019/hidef_etaOS_1d.png)
![HiDef png [269 KiB]](Directory_LHCb-PAPER-2014-019/hidef_fitkst.png)
![HiDef png [288 KiB]](Directory_LHCb-PAPER-2014-019/hidef_eff-ratio.png)
![HiDef png [402 KiB]](Directory_LHCb-PAPER-2014-019/hidef_time6NII5.png)
Tables and captions
|
Acceptance function parameter values and their correlations. |
Table_1.pdf [45 KiB] HiDef png [70 KiB] Thumbnail [21 KiB] tex code |

|
|
Systematic uncertainties. The total is the sum in quadrature of each entry. |
Table_2.pdf [40 KiB] HiDef png [96 KiB] Thumbnail [43 KiB] tex code |

|
![HiDef png [70 KiB]](Directory_LHCb-PAPER-2014-019/hidef_Table_1.png)
![HiDef png [96 KiB]](Directory_LHCb-PAPER-2014-019/hidef_Table_2.png)
Created on 27 April 2024.