Measurement of the ratio of $B_c^+$ branching fractions to $J/\psi\pi^+$ and $J/\psi\mu^+\nu_\mu$ final states
[to restricted-access page]Information
LHCb-PAPER-2014-025
CERN-PH-EP-2014-163
arXiv:1407.2126 [PDF]
(Submitted on 08 Jul 2014)
Phys. Rev. D90 (2014) 032009
Inspire 1305287
Tools
Abstract
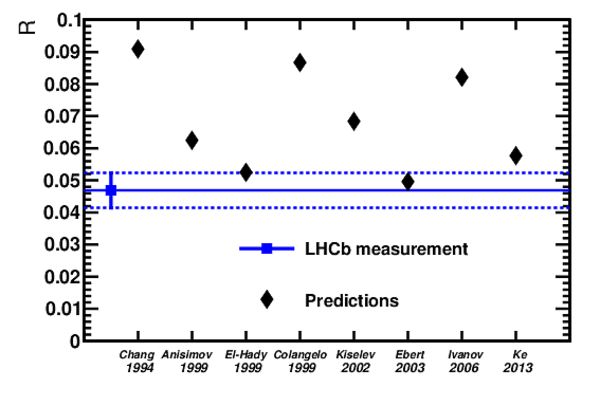
The first measurement that relates semileptonic and hadronic decay rates of the $B_c^+$ meson is performed using proton-proton collision data corresponding to 1.0 fb$^{-1}$ of integrated luminosity collected with the LHCb detector. The measured value of the ratio of branching fractions, ${\cal B}(B_c^+ \to J/\psi \pi^+)/{\cal B}(B_c^+\to J/\psi\mu^+\nu_\mu)=0.0469 \pm 0.0028 (stat.) \pm 0.0046 (syst.)$, is at the lower end of available theoretical predictions.
Figures and captions
|
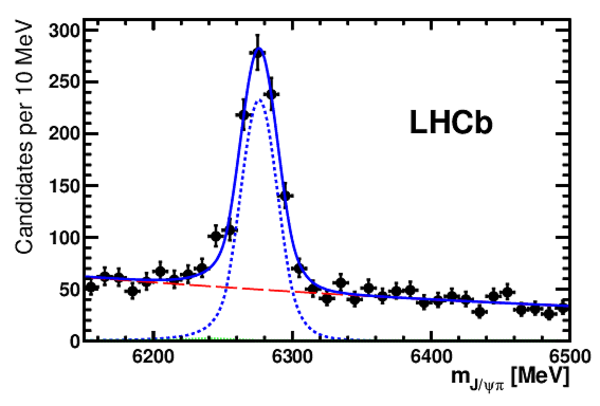
Invariant-mass distribution of $B_c^+\rightarrow { J \mskip -3mu/\mskip -2mu\psi \mskip 2mu} \pi^+$ candidates (black data points). The maximum likelihood fit of the $B_c^+$ signal is superimposed (blue solid line). Individual fit components are also shown: (dashed blue line) the signal, (red long-dashed line) the background and (green dotted line) $B_c^+\rightarrow { J \mskip -3mu/\mskip -2mu\psi \mskip 2mu} K^+$ feeddown. |
JpsiPi[..].pdf [18 KiB] HiDef png [208 KiB] Thumbnail [172 KiB] *.C file |
|
|
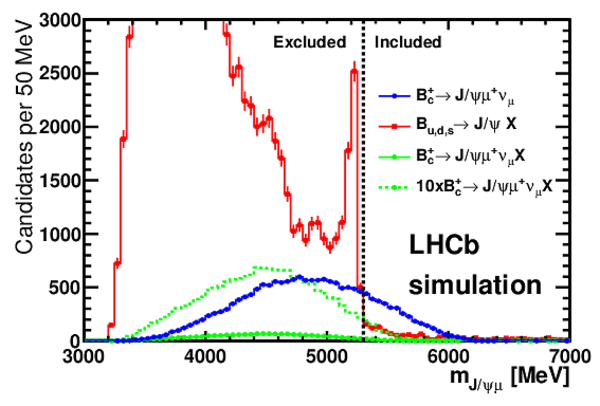
Distribution of $m_{ { J \mskip -3mu/\mskip -2mu\psi \mskip 2mu} \mu}$ for $B_c^+\rightarrow { J \mskip -3mu/\mskip -2mu\psi \mskip 2mu} \mu^+\nu_\mu$ candidates selected in simulated event samples of (blue filled points) the signal, (green filled points) the $B_c^+$ feeddown and (red filled squares) the $B_{u,d,s}$ backgrounds. Relative normalization is derived from the fit to the data described later in the text. The part of the spectrum included in the fit is indicated with a vertical dashed black line. The $B_c^+$ feeddown distribution is also shown after magnifying its normalization by a factor of ten (green dashed histogram). |
JpsiMu_MC.pdf [21 KiB] HiDef png [233 KiB] Thumbnail [214 KiB] *.C file |
|
|
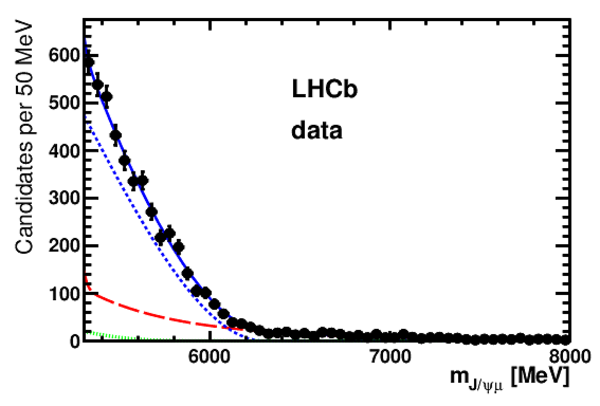
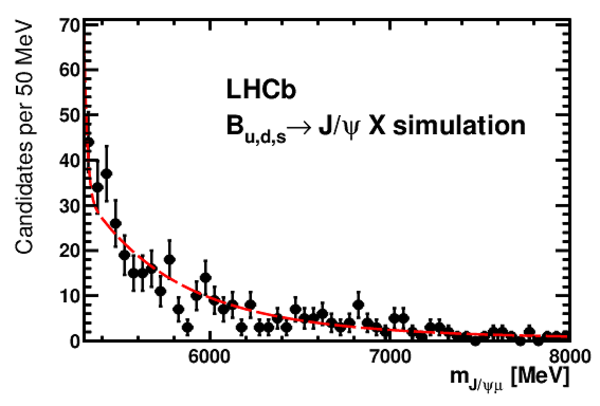
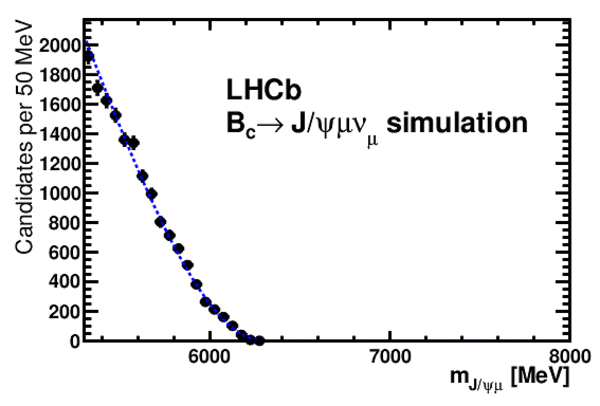
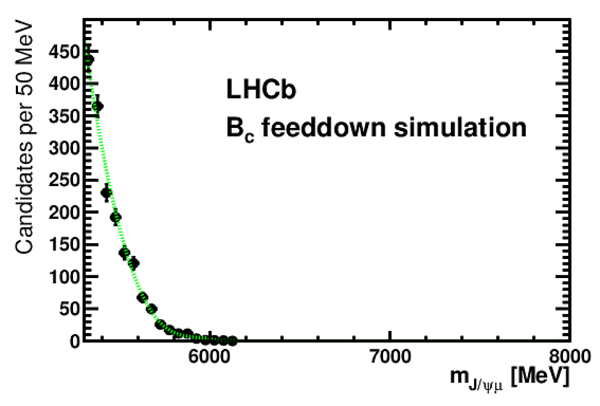
Invariant-mass distribution of $ { J \mskip -3mu/\mskip -2mu\psi \mskip 2mu} \mu^+$ pairs from $B_c^+\rightarrow { J \mskip -3mu/\mskip -2mu\psi \mskip 2mu} \mu^+\nu_\mu$ candidates (black data points) for (top left) the data, (bottom left) $B_c^+\rightarrow { J \mskip -3mu/\mskip -2mu\psi \mskip 2mu} \mu^+\nu_\mu$ signal simulation, (top right) $B_{u,d,s}\rightarrow { J \mskip -3mu/\mskip -2mu\psi \mskip 2mu} X$ background simulation and (bottom right) $B_c^+$ feeddown simulation. The unbinned maximum likelihood fit of the $B_c^+$ signal is superimposed (blue solid line). Individual fit components are also shown: (blue short-dashed line) the signal, (red long-dashed line) the background and (green dotted line) $B_c^+$ feeddown. |
JpsiMu[..].pdf [20 KiB] HiDef png [154 KiB] Thumbnail [134 KiB] *.C file |
|
|
JpsiMu[..].pdf [18 KiB] HiDef png [159 KiB] Thumbnail [157 KiB] *.C file |
|
|
|
JpsiMu[..].pdf [16 KiB] HiDef png [148 KiB] Thumbnail [148 KiB] *.C file |
|
|
|
JpsiMu[..].pdf [15 KiB] HiDef png [152 KiB] Thumbnail [143 KiB] *.C file |
|
|
|
The measured value of $\cal R$ (horizontal solid line) and its $\pm1\sigma$ uncertainty band (dashed lines) compared to the predictions (diamonds). A nonrelativistic reduction of the Bethe-Salpeter equation is used in the predictions of Chang {\slshape et al.\/} [17], El-Hady \eta [20], and Colangelo \eta [21], while the latter also utilizes heavy quark symmetry. A light-front constituent quark model is used by Anisimov \eta [18] and Ke \eta [25]. QCD sum rules are used by Kiselev \eta [22], a relativistic quasipotential Schr\"odinger model is used by Ebert \eta [23], and a relativistic constituent quark model in used by Ivanov \eta [24]. |
Theory[..].pdf [14 KiB] HiDef png [159 KiB] Thumbnail [151 KiB] *.C file |
|
|
Animated gif made out of all figures. |
PAPER-2014-025.gif Thumbnail |

|
![HiDef png [208 KiB]](Directory_LHCb-PAPER-2014-025/hidef_JpsiPiMassFit.png)
![HiDef png [233 KiB]](Directory_LHCb-PAPER-2014-025/hidef_JpsiMu_MC.png)
![HiDef png [154 KiB]](Directory_LHCb-PAPER-2014-025/hidef_JpsiMu_Data.png)
![HiDef png [159 KiB]](Directory_LHCb-PAPER-2014-025/hidef_JpsiMu_BkgMC.png)
![HiDef png [148 KiB]](Directory_LHCb-PAPER-2014-025/hidef_JpsiMu_SignalMC.png)
![HiDef png [152 KiB]](Directory_LHCb-PAPER-2014-025/hidef_JpsiMu_FeedDown.png)
![HiDef png [159 KiB]](Directory_LHCb-PAPER-2014-025/hidef_TheoryCompPlot.png)
Tables and captions
|
Values of the parameters affecting the estimate of the feeddown fraction in the fit to the $m_{ { J \mskip -3mu/\mskip -2mu\psi \mskip 2mu} \mu}$ distribution. For $B_c^+\rightarrow \chi_{cJ}\mu^+\nu_\mu$, $\sum_{J=0,1,2} R_{{\it f J}} \cal B_{\rm casc {\it f J}}$ is listed. |
Table_1.pdf [54 KiB] HiDef png [45 KiB] Thumbnail [20 KiB] tex code |

|
|
Summary of systematic uncertainties. The total systematic errors are obtained by adding in quadrature the individual contributions. |
Table_2.pdf [53 KiB] HiDef png [170 KiB] Thumbnail [80 KiB] tex code |

|
![HiDef png [45 KiB]](Directory_LHCb-PAPER-2014-025/hidef_Table_1.png)
![HiDef png [170 KiB]](Directory_LHCb-PAPER-2014-025/hidef_Table_2.png)
Created on 26 April 2024.