Study of $\chi_{b}$ meson production in pp collisions at $\sqrt{s}=7$ and 8TeV and observation of the decay $\chi_{b}(3P) \rightarrow \Upsilon(3S) \gamma$
[to restricted-access page]Information
LHCb-PAPER-2014-031
CERN-PH-EP-2014-178
arXiv:1407.7734 [PDF]
(Submitted on 29 Jul 2014)
Eur. Phys. J. C74 (2014)3092
Inspire 1308738
Tools
Abstract
A study of $\chi_{b}$ meson production at LHCb is performed on proton-proton collision data, corresponding to 3.0fb$^{-1}$ of integrated luminosity collected at centre-of-mass energies $\sqrt{s}=7$ and 8TeV. The fraction of $\Upsilon(nS)$ mesons originating from $\chi_{b}$ decays is measured as a function of the $\Upsilon$ transverse momentum in the rapidity range $2.0 < y^{\Upsilon} < 4.5$. The radiative transition of the $\chi_{b}(3P)$ meson to $\Upsilon(3S)$ is observed for the first time. The $\chi_{b1}(3P)$ mass is determined to be $$m(\chi_{b1}(3P)) = 10 511.3 \pm 1.7 \pm 2.5 MeV/c^2,$$ where the first uncertainty is statistical and the second is systematic.
Figures and captions
|
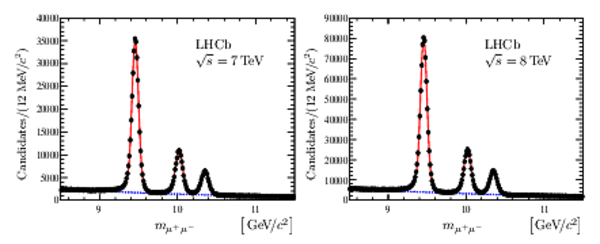
Invariant mass distributions for selected dimuon candidates in the kinematic range $6<p_{\mathrm{T}}^{\mu ^+\mu ^- }<40 {\mathrm{ Ge V /}c} $ and $2.0<y^{\mu ^+\mu ^- }<4.5$ for (left) data collected at $\sqrt{s} =7 \mathrm{TeV}$ and (right) $8 \mathrm{TeV}$. The three peaks on each plot correspond to the \Y1S, \Y2S and \Y3S signals (low-mass to high-mass). The result of the fit, described in the text, is illustrated with a red solid line, while the background component is shown with a blue dashed line. |
Fig_1.pdf [161 KiB] HiDef png [175 KiB] Thumbnail [161 KiB] *.C file tex code |
|
|
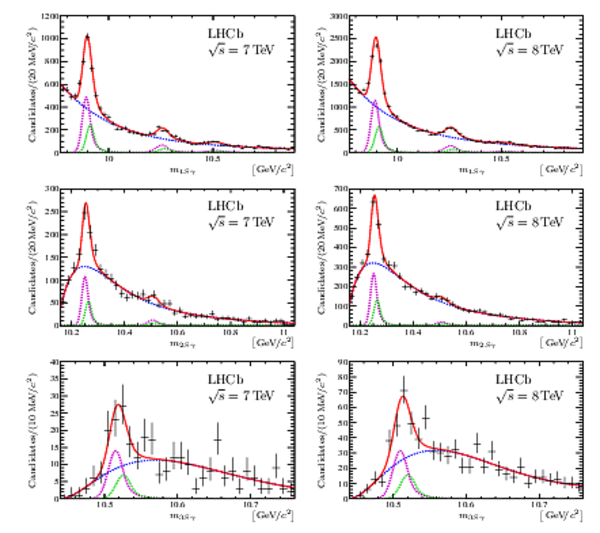
Distributions of the corrected mass $m_{\Upsilon\mathrm{(nS)} \gamma }$ for the selected $\chi _{ b }$ candidates (black points) decaying into (top row) \Y1S, (middle row) \Y2S and (bottom row) \Y3S, in the transverse momentum ranges given in the text, for (left) $\sqrt{s} =7 \mathrm{TeV}$ and (right) $8 \mathrm{TeV}$ data. Each plot shows also the result of the fit (solid red curve), including the background (dotted blue curve) and the signal (dashed green and magenta curves) contributions. The green dashed curve corresponds to the $\chi _{ b 1}$ signal and the magenta dashed curve to the $\chi _{ b 2}$ signal. |
Fig_2.pdf [164 KiB] HiDef png [562 KiB] Thumbnail [420 KiB] *.C file tex code |
|
|
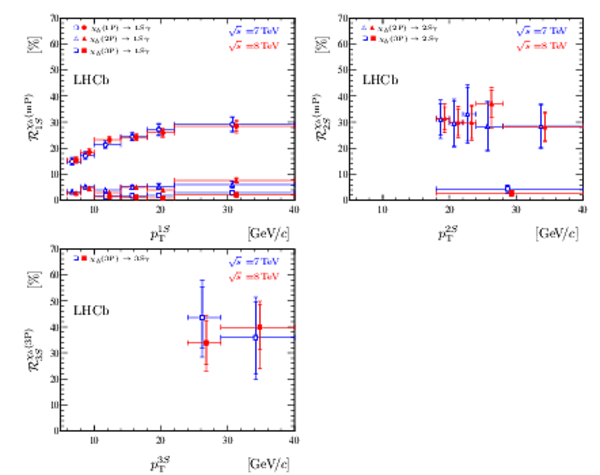
Fractions $\mathcal{R}^{\chi _{ b }\mathrm{(mP)} }_{\Upsilon\mathrm{(nS)} }$ as functions of $p_{\mathrm{T}}^{\Upsilon }$. Points with blue open (red solid) symbols correspond to data collected at $\sqrt{s} =7(8) \mathrm{TeV}$, respectively. For better visualization the data points are slightly displaced from the bin centres. The inner error bars represent statistical uncertainties, while the outer error bars indicate statistical and systematic uncertainties added in quadrature. |
Fig_3.pdf [121 KiB] HiDef png [225 KiB] Thumbnail [206 KiB] *.C file tex code |
|
|
Animated gif made out of all figures. |
PAPER-2014-031.gif Thumbnail |

|
![HiDef png [175 KiB]](Directory_LHCb-PAPER-2014-031/hidef_Fig_1.png)
![HiDef png [562 KiB]](Directory_LHCb-PAPER-2014-031/hidef_Fig_2.png)
![HiDef png [225 KiB]](Directory_LHCb-PAPER-2014-031/hidef_Fig_3.png)
Tables and captions
|
Yields of $\Upsilon\mathrm{(nS)}$ mesons, determined by fitting the dimuon invariant mass in the range $6<p_{\mathrm{T}}^{\mu ^+\mu ^- }<40 {\mathrm{ Ge V /}c} $ and $2.0<y^{\mu ^+\mu ^- }<4.5$, for data collected at $\sqrt{s} =7$ and $8 \mathrm{TeV}$. Only statistical uncertainties are shown. |
Table_1.pdf [43 KiB] HiDef png [54 KiB] Thumbnail [25 KiB] tex code |

|
|
Signal yields resulting from fits to the corrected mass $m_{\Upsilon\mathrm{(nS)} \gamma }$ distributions in the transverse momentum ranges $14<p_{\mathrm{T}}^{\Y1S}<40 {\mathrm{ Ge V /}c} $, $18<p_{\mathrm{T}}^{\Y2S}<40 {\mathrm{ Ge V /}c} $ and $24<p_{\mathrm{T}}^{\Y3S}<40 {\mathrm{ Ge V /}c} $. Only statistical uncertainties are shown. |
Table_2.pdf [58 KiB] HiDef png [82 KiB] Thumbnail [40 KiB] tex code |

|
|
Summary of the relative systematic uncertainties for the fractions $\mathcal{R}^{\chi _{ b }\mathrm{(mP)} }_{\Upsilon\mathrm{(nS)} }$. |
Table_3.pdf [61 KiB] HiDef png [97 KiB] Thumbnail [44 KiB] tex code |

|
|
Summary of systematic uncertainties for $m_{\chi _{ b 1}\mathrm{(3P)} }$. |
Table_4.pdf [68 KiB] HiDef png [81 KiB] Thumbnail [35 KiB] tex code |

|
|
Fractions $\mathcal{R}^{\chi _{ b }\mathrm{(mP)} }_{\Upsilon\mathrm{(nS)} }$ in bins of $p_{\mathrm{T}}^{\Upsilon }$, measured for data collected at $\sqrt{s} =7 \mathrm{TeV}$. The first block corresponds to $\mathcal{R}^{\chi _{ b }\mathrm{(mP)} }_{\Y1S}$, the second to $\mathcal{R}^{\chi _{ b }\mathrm{(mP)} }_{\Y2S}$ and the third to $\mathcal{R}^{\chi _{ b }\mathrm{(mP)} }_{\Y3S}$. The first uncertainty is statistical and the second systematic. |
Table_5.pdf [58 KiB] HiDef png [90 KiB] Thumbnail [48 KiB] tex code |

|
|
Fractions $\mathcal{R}^{\chi _{ b }\mathrm{(mP)} }_{\Upsilon\mathrm{(nS)} }$ in bins of $p_{\mathrm{T}}^{\Upsilon }$, measured for data collected at $\sqrt{s} =8 \mathrm{TeV}$. The first block corresponds to $\mathcal{R}^{\chi _{ b }\mathrm{(mP)} }_{\Y1S}$, the second to $\mathcal{R}^{\chi _{ b }\mathrm{(mP)} }_{\Y2S}$ and the third to $\mathcal{R}^{\chi _{ b }\mathrm{(mP)} }_{\Y3S}$. The first uncertainty is statistical and the second systematic. |
Table_6.pdf [59 KiB] HiDef png [88 KiB] Thumbnail [47 KiB] tex code |

|
![HiDef png [54 KiB]](Directory_LHCb-PAPER-2014-031/hidef_Table_1.png)
![HiDef png [82 KiB]](Directory_LHCb-PAPER-2014-031/hidef_Table_2.png)
![HiDef png [97 KiB]](Directory_LHCb-PAPER-2014-031/hidef_Table_3.png)
![HiDef png [81 KiB]](Directory_LHCb-PAPER-2014-031/hidef_Table_4.png)
![HiDef png [90 KiB]](Directory_LHCb-PAPER-2014-031/hidef_Table_5.png)
![HiDef png [88 KiB]](Directory_LHCb-PAPER-2014-031/hidef_Table_6.png)
Created on 26 April 2024.