Measurement of $C P$ asymmetries in the decays $B^0 \rightarrow K^{*0} \mu^+ \mu^-$ and $B^+ \rightarrow K^{+} \mu^+ \mu^-$
[to restricted-access page]Information
LHCb-PAPER-2014-032
CERN-PH-EP-2014-191
arXiv:1408.0978 [PDF]
(Submitted on 05 Aug 2014)
JHEP 09 (2014) 177
Inspire 1309881
Tools
Abstract
The direct $C P$ asymmetries of the decays $B^0 \rightarrow K^{*0} \mu^+ \mu^-$ and $B^+ \rightarrow K^{+} \mu^+ \mu^-$ are measured using $pp$ collision data corresponding to an integrated luminosity of 3.0$ fb^{-1}$ collected with the LHCb detector. The respective control modes $B^0 \rightarrow J/\psi K^{*0}$ and $B^+ \rightarrow J/\psi K^{+}$ are used to account for detection and production asymmetries. The measurements are made in several intervals of $\mu^+ \mu^-$ invariant mass squared, with the $\phi(1020)$ and charmonium resonance regions excluded. Under the hypothesis of zero $C P$ asymmetry in the control modes, the average values of the asymmetries are \begin{align} {\cal A}_{C P}(B^0 \rightarrow K^{*0} \mu^+ \mu^-) &= -0.035 \pm 0.024 \pm 0.003, \cr {\cal A}_{C P}(B^+ \rightarrow K^{+} \mu^+ \mu^-) &= \phantom{-}0.012 \pm 0.017 \pm 0.001, \end{align} where the first uncertainties are statistical and the second are due to systematic effects. Both measurements are consistent with the Standard Model prediction of small $C P$ asymmetry in these decays.
Figures and captions
|
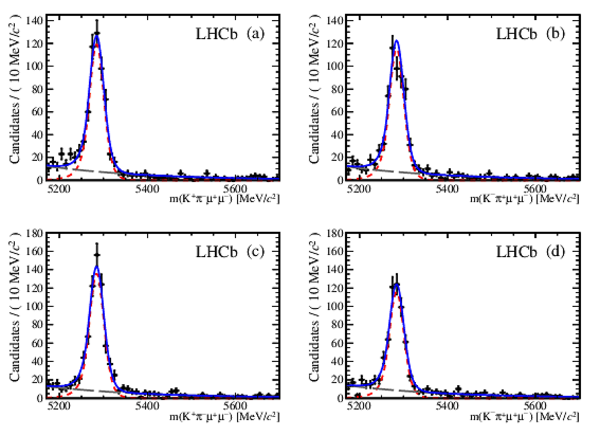
Unbinned maximum-likelihood fits to the $ K ^+ \pi ^- \mu ^+\mu ^- $ mass distributions of the integrated data set for (a) $ { B ^0 \rightarrow K^{*0} \mu^+ \mu^-}$ and (b) $\overline{ B }{} ^0 \rightarrow \overline{ K }{} ^{*0} \mu^+ \mu^-$ decays for one magnet polarity, and (c) $ { B ^0 \rightarrow K^{*0} \mu^+ \mu^-}$ and (d) $\overline{ B }{} ^0 \rightarrow \overline{ K }{} ^{*0} \mu^+ \mu^-$ for the other. The blue, solid line represents the total fit, the red, short-dashed line represents the signal component and the grey, long-dashed line represents the combinatorial background. |
Fig1.pdf [41 KiB] HiDef png [372 KiB] Thumbnail [282 KiB] *.C file |
|
|
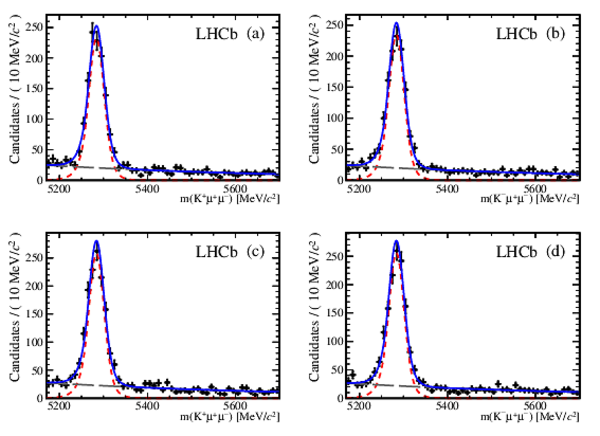
Unbinned maximum-likelihood fits to the $ K ^+ \mu ^+\mu ^- $ mass distributions of the integrated data set for (a) $ { B ^+ \rightarrow K^{+} \mu^+ \mu^-}$ and (b) $ B ^- \rightarrow K^{-} \mu^+ \mu^-$ decays for one magnet polarity, and (c) $ { B ^+ \rightarrow K^{+} \mu^+ \mu^-}$ and (d) $ B ^- \rightarrow K^{-} \mu^+ \mu^-$ for the other. The blue, solid line represents the total fit, the red, short-dashed line represents the signal component and the grey, long-dashed line represents the combinatorial background. |
Fig2.pdf [42 KiB] HiDef png [384 KiB] Thumbnail [288 KiB] *.C file |
|
|
Values of $ {\cal A}_{ C P }$ for $ { B ^0 \rightarrow K^{*0} \mu^+ \mu^-}$ decays in each of the the 14 $ q^2$ bins used in the analysis. The error bars are the sum of the statistical and systematic uncertainties in quadrature. The dashed line represents the weighted average value, and the grey band indicates $\pm1\sigma$. The vertical red lines show the $\phi(1020)$, $ { J \mskip -3mu/\mskip -2mu\psi \mskip 2mu}$ , and $\psi {(2S)}$ regions, which are vetoed. |
Fig3.pdf [15 KiB] HiDef png [114 KiB] Thumbnail [115 KiB] *.C file |

|
|
Values of $ {\cal A}_{ C P }$ for $ { B ^+ \rightarrow K^{+} \mu^+ \mu^-}$ decays in each of the the 17 $ q^2$ bins used in the analysis. The error bars are the sum of the statistical and systematic uncertainties in quadrature. The dashed line represents the weighted average value, and the grey band indicates $\pm1\sigma$. The vertical red lines show the $\phi(1020)$, $ { J \mskip -3mu/\mskip -2mu\psi \mskip 2mu}$ , and $\psi {(2S)}$ regions, which are vetoed. |
Fig4.pdf [16 KiB] HiDef png [129 KiB] Thumbnail [132 KiB] *.C file |

|
|
Animated gif made out of all figures. |
PAPER-2014-032.gif Thumbnail |

|
![HiDef png [372 KiB]](Directory_LHCb-PAPER-2014-032/hidef_Fig1.png)
![HiDef png [384 KiB]](Directory_LHCb-PAPER-2014-032/hidef_Fig2.png)
![HiDef png [114 KiB]](Directory_LHCb-PAPER-2014-032/hidef_Fig3.png)
![HiDef png [129 KiB]](Directory_LHCb-PAPER-2014-032/hidef_Fig4.png)
Tables and captions
|
Summary of the sources of systematic uncertainty for the measurements of $ {\cal A}_{ C P } ( {B \rightarrow K^{(*)} \mu^+ \mu^-} )$. The ranges shown in parentheses indicate the minimum and maximum values of the systematic uncertainties in different $ q^2$ bins, while the numbers outside the parentheses are the values averaged over $ q^2$ . These may be outside the ranges as the uncertainties are determined by methods affected by statistical fluctuations. There is no systematic uncertainty due to duplicate candidates in the $ { B ^+ \rightarrow K^{+} \mu^+ \mu^-}$ decay. |
Table_1.pdf [46 KiB] HiDef png [70 KiB] Thumbnail [30 KiB] tex code |

|
|
Values of $ {\cal A}_{ C P }$ in $ { B ^0 \rightarrow K^{*0} \mu^+ \mu^-}$ decays in each of the 14 $ q^2$ bins used in the analysis. The first uncertainties are statistical and the second are systematic. |
Table_2.pdf [43 KiB] HiDef png [178 KiB] Thumbnail [91 KiB] tex code |

|
|
Values of $ {\cal A}_{ C P }$ in $ { B ^+ \rightarrow K^{+} \mu^+ \mu^-}$ decays in each of the 17 $ q^2$ bins used in the analysis. The first uncertainties are statistical and the second are systematic. |
Table_3.pdf [43 KiB] HiDef png [224 KiB] Thumbnail [110 KiB] tex code |

|
![HiDef png [70 KiB]](Directory_LHCb-PAPER-2014-032/hidef_Table_1.png)
![HiDef png [178 KiB]](Directory_LHCb-PAPER-2014-032/hidef_Table_2.png)
![HiDef png [224 KiB]](Directory_LHCb-PAPER-2014-032/hidef_Table_3.png)
Supplementary Material [file]
| Supplementary material full pdf |
Supple[..].pdf [77 KiB] |

|
|
This ZIP file contains supplemetary material for the publication LHCb-PAPER-2014-032. The files are: Supplementary.pdf : An overview of the extra figures *.pdf, *.png, *.eps : The figures in various formats |
Fig1.pdf [15 KiB] HiDef png [120 KiB] Thumbnail [120 KiB] *C file |

|
|
Fig2.pdf [16 KiB] HiDef png [133 KiB] Thumbnail [134 KiB] *C file |

|
![HiDef png [120 KiB]](Directory_LHCb-PAPER-2014-032/supplementary/hidef_Fig1.png)
![HiDef png [133 KiB]](Directory_LHCb-PAPER-2014-032/supplementary/hidef_Fig2.png)
Created on 27 April 2024.