Measurement of the forward $W$ boson cross-section in $pp$ collisions at $\sqrt{s} $ = 7 TeV
[to restricted-access page]Information
LHCb-PAPER-2014-033
CERN-PH-EP-2014-175
arXiv:1408.4354 [PDF]
(Submitted on 19 Aug 2014)
JHEP 12 (2014) 079
Inspire 1311488
Tools
Abstract
A measurement of the inclusive $W \to \mu\nu$ production cross-section using data from $pp$ collisions at a centre-of-mass energy of $\sqrt{s} = 7 {\rm TeV}$ is presented. The analysis is based on an integrated luminosity of about $1.0 {\rm fb}^{-1}$ recorded with the LHCb detector. Results are reported for muons with a transverse momentum greater than $20 {\rm Ge V /}c$ and pseudorapidity between 2.0 and 4.5. The $W^{+}$ and $W^{-}$ production cross-sections are measured to be $$\sigma_{W^{+} \to \mu^{+}\nu} = 861.0 \pm 2.0 \pm 11.2 \pm 14.7 {\rm pb},$$ $$\sigma_{W^{-} \to \mu^{-}\overline{\nu}} = 675.8 \pm 1.9 \pm 8.8 \pm 11.6 {\rm pb},$$ where the first uncertainty is statistical, the second is systematic and the third is due to the luminosity determination. Cross-section ratios and differential distributions as functions of the muon pseudorapidity are also presented. The ratio of $W^{+}$ to $W^{-}$ cross-sections in the same fiducial kinematic region is determined to be $$\frac{\sigma_{W^{+} \to \mu^{+}\nu}}{\sigma_{W^{-} \to \mu^{-}\overline{\nu}}} = 1.274 \pm 0.005 \pm 0.009,$$ where the uncertainties are statistical and systematic, respectively. Results are in good agreement with theoretical predictions at next-to-next-to-leading order in perturbative quantum chromodynamics.
Figures and captions
|
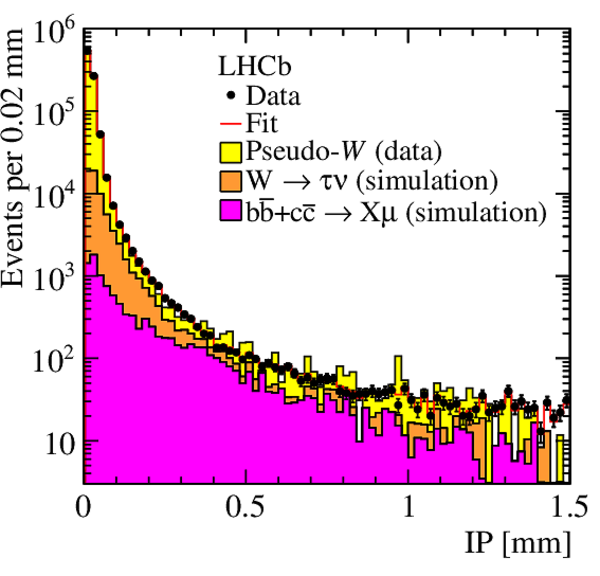
Fit to (left) the impact parameter distribution and (right) the relative energy deposition in the calorimeters. The data are compared to fitted contributions described in the legends. |
Fig1l.pdf [26 KiB] HiDef png [262 KiB] Thumbnail [238 KiB] *.C file |
|
|
Fig1r.pdf [23 KiB] HiDef png [189 KiB] Thumbnail [174 KiB] *.C file |

|
|
|
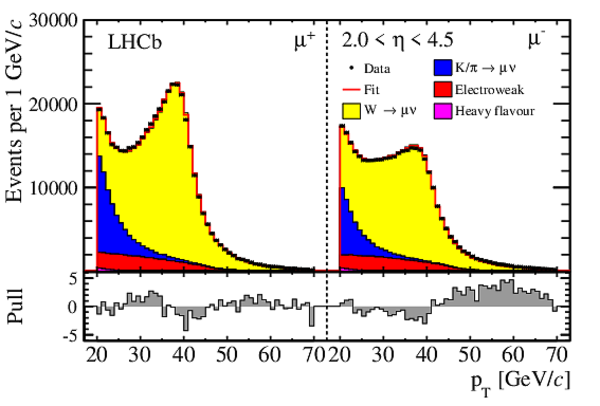
Transverse momentum distribution of the (left panel) positive and (right panel) negative muon candidates in the fiducial pseudorapidity range. The data are compared to fitted contributions described in the legend. The fit residuals normalised to the data uncertainty are shown at the bottom of each distribution. |
Fig2.pdf [32 KiB] HiDef png [215 KiB] Thumbnail [196 KiB] *.C file |
|
|
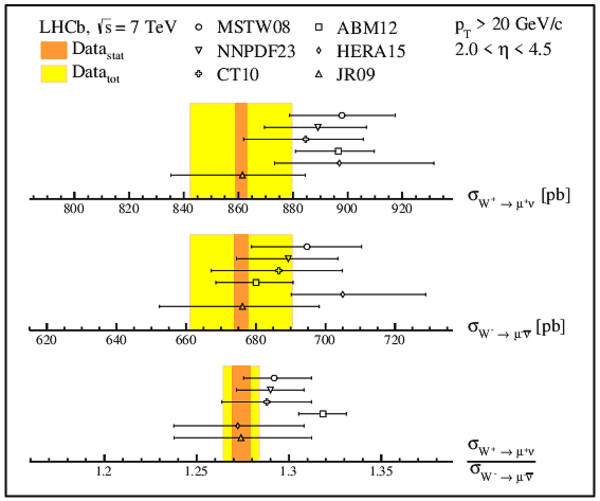
Summary of the $ W $ cross-section determinations. Measurements, represented as bands corresponding to the statistical (orange) and total (yellow) uncertainty, are compared to NNLO predictions for various parameterisations of the PDFs (black markers). |
Fig3.pdf [15 KiB] HiDef png [168 KiB] Thumbnail [151 KiB] *.C file |
|
|
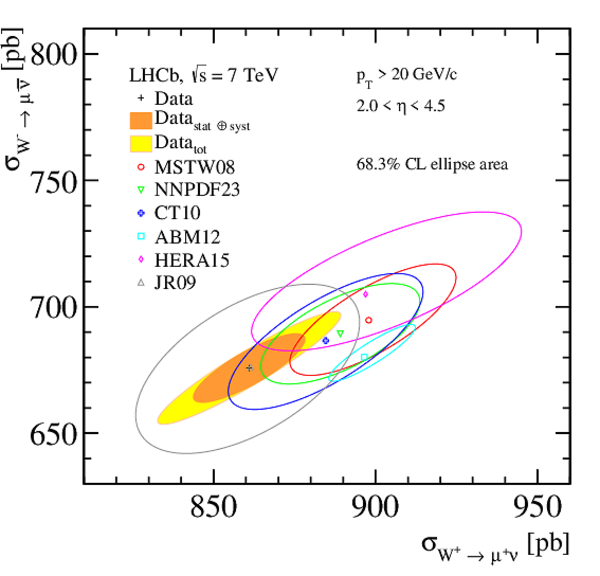
Two-dimensional plot of the measured (total (yellow) and excluding the luminosity (orange) uncertainty) $ W ^+$ and $ W ^-$ cross-sections compared to NNLO predictions for various parameterisations of the PDFs (coloured markers). The uncertainty of the theoretical predictions corresponds to the PDF uncertainty only; the correlation is determined using the different error eigenvector sets. The ellipses correspond to a $68.3\%$ CL coverage. |
Fig4.pdf [67 KiB] HiDef png [287 KiB] Thumbnail [215 KiB] *.C file |
|
|
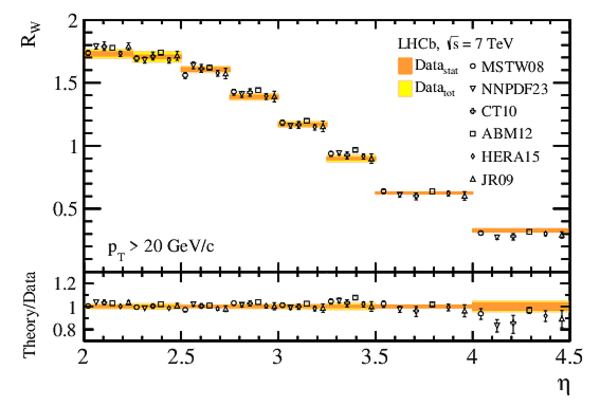
Differential $ W ^+$ and $ W ^-$ cross-section in bins of muon pseudorapidity. Measurements, represented as bands corresponding to the statistical (orange (blue) for $ W ^+$ ( $ W ^-$ )) and total (yellow (light blue) for $ W ^+$ ( $ W ^-$ )) uncertainty, are compared to NNLO predictions with different parameterisations of the PDFs (black (blue) markers for $ W ^+$ ( $ W ^-$ ), displaced horizontally for presentation). |
Fig5.pdf [29 KiB] HiDef png [389 KiB] Thumbnail [249 KiB] *.C file |

|
|
Fig6.pdf [21 KiB] HiDef png [212 KiB] Thumbnail [163 KiB] *.C file |
|
|
|
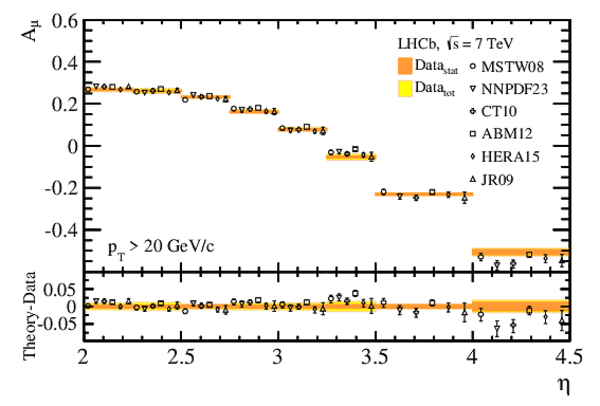
Lepton charge asymmetry in bins of muon pseudorapidity. Measurements, represented as bands corresponding to the statistical (orange) and total (yellow) uncertainty, are compared to NNLO predictions for various parameterisations of the PDFs (black markers, displaced horizontally for presentation). |
Fig7.pdf [20 KiB] HiDef png [222 KiB] Thumbnail [177 KiB] *.C file |
|
|
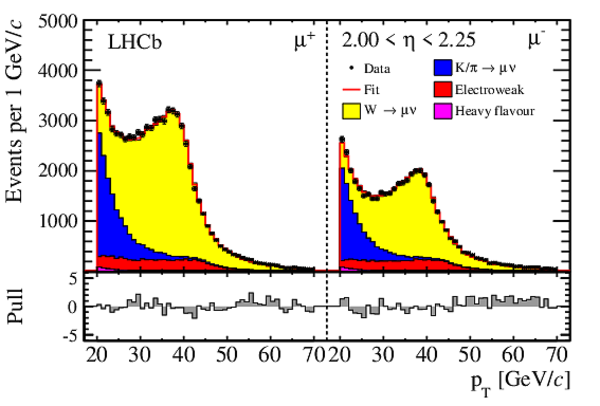
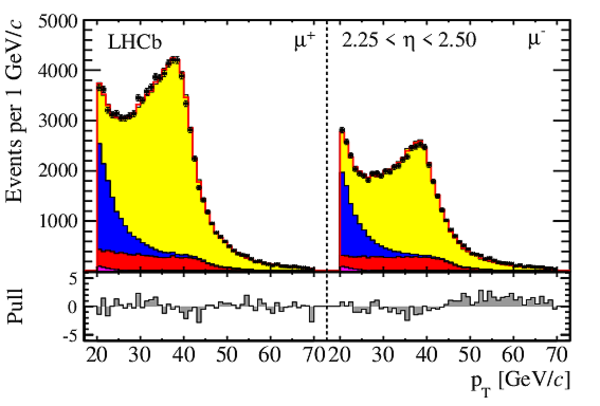
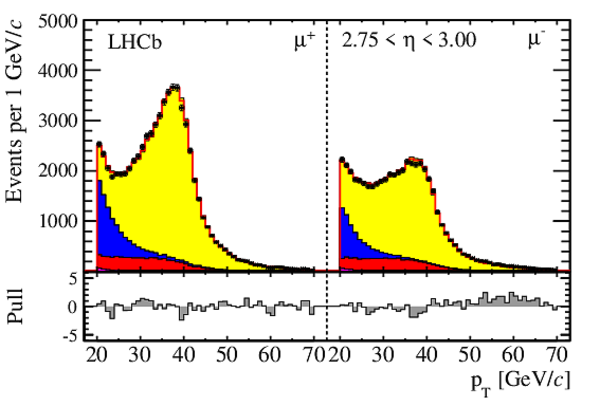
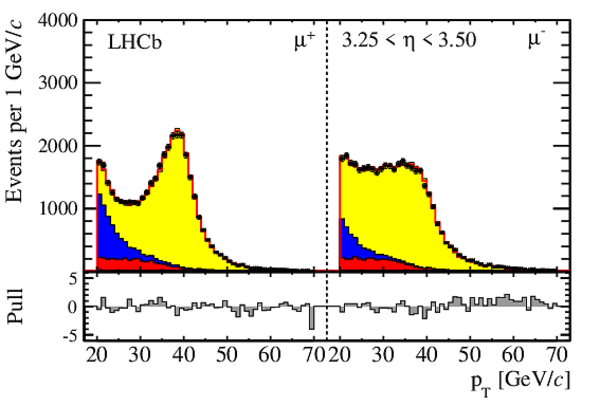
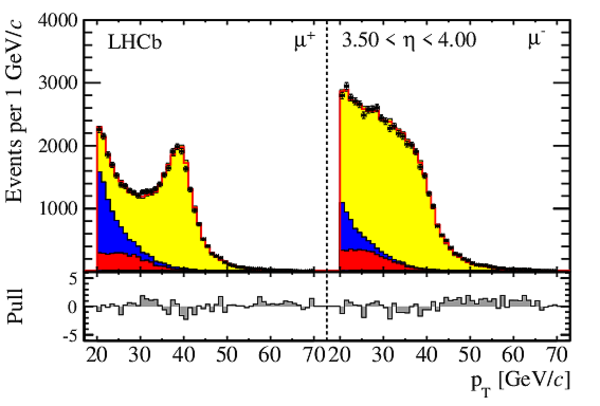
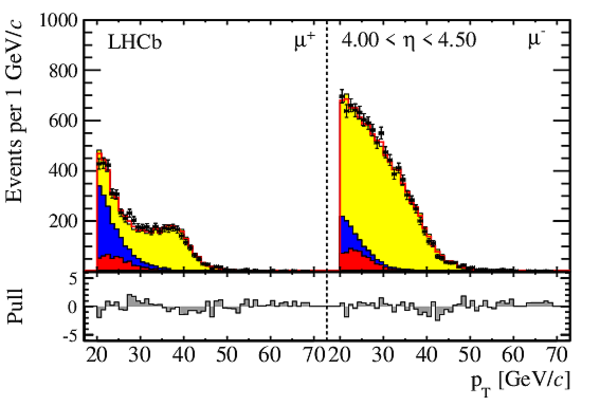
Transverse momentum distribution of the (left panel) positive and (right panel) negative muon candidates in eight bins of pseudorapidity. The data are compared to fitted contributions described in the legend. The fit residuals normalised to the data uncertainty are shown at the bottom of each distribution. |
Fig8_1.pdf [35 KiB] HiDef png [233 KiB] Thumbnail [210 KiB] *.C file |
|
|
Fig8_2.pdf [35 KiB] HiDef png [218 KiB] Thumbnail [194 KiB] *.C file |
|
|
|
Fig8_3.pdf [34 KiB] HiDef png [215 KiB] Thumbnail [192 KiB] *.C file |

|
|
|
Fig8_4.pdf [34 KiB] HiDef png [209 KiB] Thumbnail [186 KiB] *.C file |
|
|
|
Transverse momentum distribution of the (left panel) positive and (right panel) negative muon candidates in eight bins of pseudorapidity. The data are compared to fitted contributions described in the legend. The fit residuals normalised to the data uncertainty are shown at the bottom of each distribution. |
Fig9_1.pdf [35 KiB] HiDef png [230 KiB] Thumbnail [203 KiB] *.C file |

|
|
Fig9_2.pdf [34 KiB] HiDef png [200 KiB] Thumbnail [178 KiB] *.C file |
|
|
|
Fig9_3.pdf [33 KiB] HiDef png [202 KiB] Thumbnail [179 KiB] *.C file |
|
|
|
Fig9_4.pdf [32 KiB] HiDef png [202 KiB] Thumbnail [178 KiB] *.C file |
|
|
|
Animated gif made out of all figures. |
PAPER-2014-033.gif Thumbnail |

|
![HiDef png [262 KiB]](Directory_LHCb-PAPER-2014-033/hidef_Fig1l.png)
![HiDef png [189 KiB]](Directory_LHCb-PAPER-2014-033/hidef_Fig1r.png)
![HiDef png [215 KiB]](Directory_LHCb-PAPER-2014-033/hidef_Fig2.png)
![HiDef png [168 KiB]](Directory_LHCb-PAPER-2014-033/hidef_Fig3.png)
![HiDef png [287 KiB]](Directory_LHCb-PAPER-2014-033/hidef_Fig4.png)
![HiDef png [389 KiB]](Directory_LHCb-PAPER-2014-033/hidef_Fig5.png)
![HiDef png [212 KiB]](Directory_LHCb-PAPER-2014-033/hidef_Fig6.png)
![HiDef png [222 KiB]](Directory_LHCb-PAPER-2014-033/hidef_Fig7.png)
![HiDef png [233 KiB]](Directory_LHCb-PAPER-2014-033/hidef_Fig8_1.png)
![HiDef png [218 KiB]](Directory_LHCb-PAPER-2014-033/hidef_Fig8_2.png)
![HiDef png [215 KiB]](Directory_LHCb-PAPER-2014-033/hidef_Fig8_3.png)
![HiDef png [209 KiB]](Directory_LHCb-PAPER-2014-033/hidef_Fig8_4.png)
![HiDef png [230 KiB]](Directory_LHCb-PAPER-2014-033/hidef_Fig9_1.png)
![HiDef png [200 KiB]](Directory_LHCb-PAPER-2014-033/hidef_Fig9_2.png)
![HiDef png [202 KiB]](Directory_LHCb-PAPER-2014-033/hidef_Fig9_3.png)
![HiDef png [202 KiB]](Directory_LHCb-PAPER-2014-033/hidef_Fig9_4.png)
Tables and captions
|
Summary of the systematic uncertainties on the inclusive cross-sections and their ratio. |
Table_1.pdf [53 KiB] HiDef png [52 KiB] Thumbnail [23 KiB] tex code |

|
|
Correction for final state radiation for $ W ^+ \rightarrow \mu ^+ \nu $ and $ W ^- \rightarrow \mu ^- \overline{\nu } $ in bins of muon pseudorapidity. No loss due FSR is observed for $ W ^-$ in the last pseudorapidity bin because of lack of statistics. |
Table_2.pdf [72 KiB] HiDef png [91 KiB] Thumbnail [41 KiB] tex code |

|
|
Ratio of $ W ^+$ to $ W ^-$ cross-section in bins of muon pseudorapidity. The uncertainties are statistical and systematic. |
Table_4.pdf [35 KiB] HiDef png [109 KiB] Thumbnail [53 KiB] tex code |

|
|
Correlation coefficients (statistical and systematic uncertainties) between $ W ^+$ and $ W ^-$ cross-sections in bins of muon pseudorapidity. The luminosity uncertainty is not included. |
Table_6.pdf [26 KiB] HiDef png [81 KiB] Thumbnail [31 KiB] tex code |

|
![HiDef png [52 KiB]](Directory_LHCb-PAPER-2014-033/hidef_Table_1.png)
![HiDef png [91 KiB]](Directory_LHCb-PAPER-2014-033/hidef_Table_2.png)
![HiDef png [109 KiB]](Directory_LHCb-PAPER-2014-033/hidef_Table_4.png)
![HiDef png [81 KiB]](Directory_LHCb-PAPER-2014-033/hidef_Table_6.png)
Supplementary Material [file]
| Supplementary material full pdf |
supple[..].pdf [191 KiB] |
|
|
This ZIP file contains supplementary material for the publication LHCb-PAPER-2014-033 The files are supplementary.pdf : an overview of the extra figures *.pdf, *.png, *.eps, *.C : the figures in various formats |
Fig1-S.pdf [28 KiB] HiDef png [184 KiB] Thumbnail [152 KiB] *C file |

|
|
Fig2-S.pdf [16 KiB] HiDef png [217 KiB] Thumbnail [176 KiB] *C file |
|
|
|
Fig3-S.pdf [14 KiB] HiDef png [125 KiB] Thumbnail [120 KiB] *C file |
|
|
|
Fig4-S.pdf [14 KiB] HiDef png [102 KiB] Thumbnail [98 KiB] *C file |
|
![HiDef png [184 KiB]](Directory_LHCb-PAPER-2014-033/supplementary/hidef_Fig1-S.png)
![HiDef png [217 KiB]](Directory_LHCb-PAPER-2014-033/supplementary/hidef_Fig2-S.png)
![HiDef png [125 KiB]](Directory_LHCb-PAPER-2014-033/supplementary/hidef_Fig3-S.png)
![HiDef png [102 KiB]](Directory_LHCb-PAPER-2014-033/supplementary/hidef_Fig4-S.png)
Created on 27 April 2024.