Information
LHCb-PAPER-2014-037
CERN-PH-EP-2014-165
arXiv:1407.5873 [PDF]
(Submitted on 22 Jul 2014)
Phys. Rev. Lett. 113 (2014) 172001
Inspire 1307246
Tools
Abstract
We present a measurement of the ratio of the Bs meson lifetime, in the flavor-specific decay to $D_s^+\pi^-$, to that of the B0 meson. The pp collision data used correspond to an integrated luminosity of 1/fb, collected with the LHCb detector, at a center-of-mass energy of 7 TeV. Combining our measured value of 1.010 +/- 0.010 +/- 0.008 for this ratio with the known lifetime, we determine the flavor-specific Bs lifetime to be tau(Bs) = 1.535 +/- 0.015 +/- 0.014 ps, where the uncertainties are statistical and systematic, respectively. This is the most precise measurement to date, and is consistent with previous measurements and theoretical predictions.
Figures and captions
|
Fits to the invariant mass spectra of candidates for the decays (a) ${B^-}\rightarrow{D^0[K\pi]\pi^-}$, (b) ${B^-}\rightarrow{D^0[K\pi\pi\pi]\pi^-}$, (c) ${\overline{ B }{} ^0 }\rightarrow{D^+[K\pi\pi]\pi^-}$, (d) ${\overline{ B }{} ^0_ s }\rightarrow{D^+_s[KK\pi]\pi^-}$. The points are the data and the superimposed curves show the fit components. The solid (blue) curve gives the total. The $DK^-$ component is not visible, but is included. |
fig1.pdf [74 KiB] HiDef png [553 KiB] Thumbnail [322 KiB] *.C file |

|
|
Decay time distributions for ${B^-}\rightarrow{D^0[K\pi]\pi^-}$ shown as triangles (blue), ${B^-}\rightarrow{D^0[K\pi\pi\pi]\pi^-}$ shown as inverted triangles (cyan), ${B^0}\rightarrow{D^+[K\pi\pi]\pi^-}$ shown as squares (red), ${\overline{ B }{} ^0_ s }\rightarrow{D^+_s[KK\pi]\pi^-}$ shown as circles (magenta). For most entries the error bars are smaller than the point markers. |
fig2.pdf [43 KiB] HiDef png [247 KiB] Thumbnail [167 KiB] *.C file |

|
|
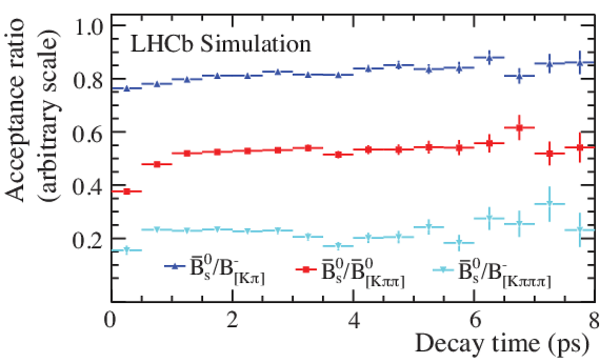
Ratio of the decay time acceptances between ${\overline{ B }{} ^0_ s }\rightarrow{D^+_s[KK\pi]\pi^-}$ and ${B^-}\rightarrow{D^0[K\pi]\pi^-}$ shown as triangles (blue), ${B^0}\rightarrow{D^+[K\pi\pi]\pi^-}$ shown as squares (red), and ${B^-}\rightarrow{D^0[K\pi\pi\pi]\pi^-}$ shown as inverted triangles (cyan). The vertical axis is shown in an arbitrary scale, different for each mode ratio to improve clarity. |
fig3.pdf [40 KiB] HiDef png [146 KiB] Thumbnail [166 KiB] *.C file |
|
|
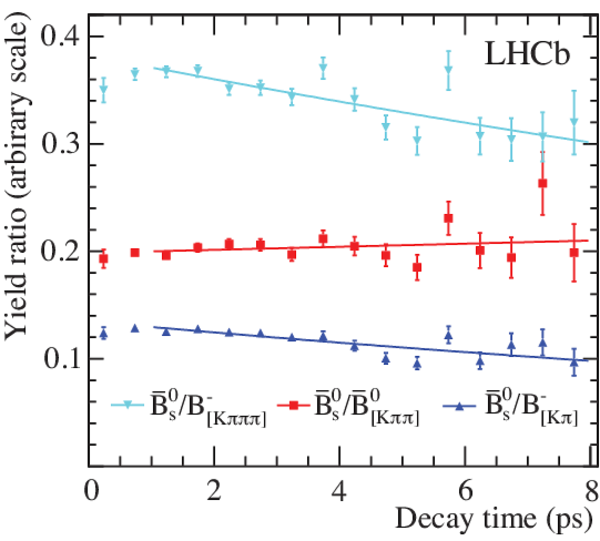
Efficiency-corrected yield ratios of ${\overline{ B }{} ^0_ s }\rightarrow{D^+_s[KK\pi]\pi^-}$ relative to ${B^-}\rightarrow{D^0[K\pi]\pi^-}$ shown as triangles (blue), ${\overline{ B }{} ^0 }\rightarrow{D^+[K\pi\pi]\pi^-}$ shown as squares (red), and ${B^-}\rightarrow{D^0[K\pi\pi\pi]\pi^-}$ shown as inverted triangles (cyan). The simulation uncertainties are not included. The exponential fits are also shown. The vertical axis is shown in an arbitrary scale, different for each case to improve clarity. |
fig4.pdf [43 KiB] HiDef png [189 KiB] Thumbnail [224 KiB] *.C file |
|
|
Animated gif made out of all figures. |
PAPER-2014-037.gif Thumbnail |

|
![HiDef png [553 KiB]](Directory_LHCb-PAPER-2014-037/hidef_fig1.png)
![HiDef png [247 KiB]](Directory_LHCb-PAPER-2014-037/hidef_fig2.png)
![HiDef png [146 KiB]](Directory_LHCb-PAPER-2014-037/hidef_fig3.png)
![HiDef png [189 KiB]](Directory_LHCb-PAPER-2014-037/hidef_fig4.png)
Tables and captions
|
Measured lifetime ratios, compared with the known values, and the difference (fitted -- known), as well as the resulting measured lifetime $\tau_{\rm meas}$. Errors are statistical only. $B_x$ and $B_y$ indicate the modes used. |
Table_1.pdf [69 KiB] HiDef png [53 KiB] Thumbnail [22 KiB] tex code |

|
|
Systematic uncertainties for $\Delta_{\overline{ B }{} ^0_ s B_x}$. |
Table_2.pdf [45 KiB] HiDef png [28 KiB] Thumbnail [10 KiB] tex code |

|
![HiDef png [53 KiB]](Directory_LHCb-PAPER-2014-037/hidef_Table_1.png)
![HiDef png [28 KiB]](Directory_LHCb-PAPER-2014-037/hidef_Table_2.png)
Created on 02 May 2024.