Measurement of the $\chi_b(3P)$ mass and of the relative rate of $\chi_{b1}(1P)$ and $\chi_{b2}(1P)$ production
[to restricted-access page]Information
LHCb-PAPER-2014-040
CERN-PH-EP-2014-206
arXiv:1409.1408 [PDF]
(Submitted on 04 Sep 2014)
JHEP 10 (2014) 088
Inspire 1315113
Tools
Abstract
The production of $\chi_b$ mesons in proton-proton collisions is studied using a data sample collected by the LHCb detector, at centre-of-mass energies of $\sqrt{s}=7$ and $8$ TeV and corresponding to an integrated luminosity of 3.0 fb$^{-1}$. The $\chi_b$ mesons are identified through their decays to $\Upsilon(1S)\gamma$ and $\Upsilon(2S)\gamma$ using photons that converted to $e^+e^-$ pairs in the detector. The relative prompt production rate of $\chi_{b1}(1P)$ and $\chi_{b2}(1P)$ mesons is measured as a function of the $\Upsilon(1S)$ transverse momentum in the $\chi_b$ rapidity range $2.0<y<4.5$. A precise measurement of the $\chi_b(3P)$ mass is also performed. Assuming a mass splitting between the $\chi_{b1}(3P)$ and the $\chi_{b2}(3P)$ states of 10.5 MeV/$c^2$, the measured mass of the $\chi_{b1}(3P)$ meson is $ m(\chi_{b1}(3P))= 10515.7^{+2.2}_{-3.9}(stat) ^{+1.5}_{-2.1}(syst) MeV/c^2.$
Figures and captions
|
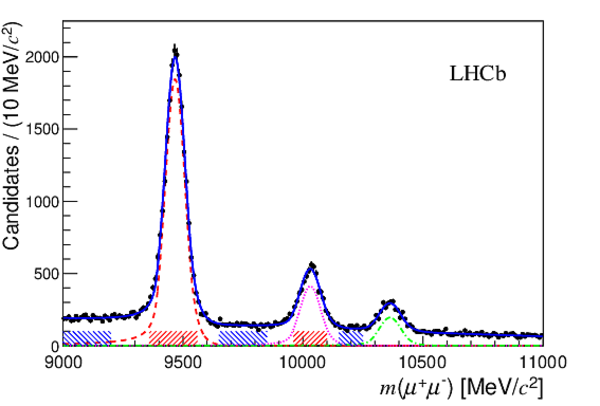
Invariant dimuon mass of the $\Upsilon$ candidates after the event selection requirements and before the $\Upsilon$ mass range requirement. The distribution is fitted with the sum (blue line) of a double-sided Crystal Ball function for each $\Upsilon$ state (dashed red line for $\Y1S$, dotted pink line for $\Y2S$, dash-dotted green line for $\Y3S$) and a second-order polynomial for the background (not shown). The hatched red bands show the signal regions and the hatched blue bands show the mass sidebands used for background studies. |
FitUps[..].pdf [49 KiB] HiDef png [235 KiB] Thumbnail [146 KiB] *.C file |
|
|
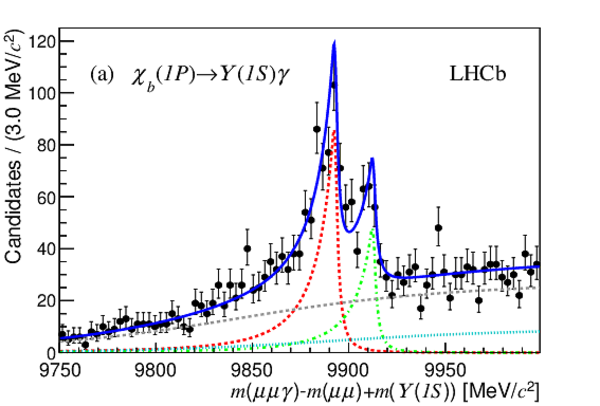
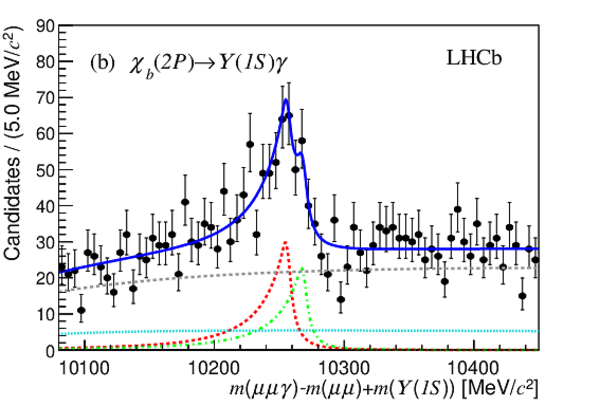
Distribution of $m^*(\mu ^+ \mu ^- \gamma )\equiv m(\mu ^+ \mu ^- \gamma )-m(\mu ^+ \mu ^- )+m(\Upsilon)$ for $\chi _{ b }$ candidates with fit projections overlaid for (a) $\chi _{ b }(1P)\rightarrow \Y1S\gamma $, (b) $\chi _{ b }(2P)\rightarrow \Y1S\gamma $, (c,e) $\chi _{ b }(3P)\rightarrow \Y1S\gamma $ and (d,f) $\chi _{ b }(3P)\rightarrow \Y2S\gamma $ channels. The result of the simultaneous fit to the $\chi _{ b }(3P)\rightarrow \Y1S\gamma $ and $\chi _{ b }(3P)\rightarrow \Y2S\gamma $ mass distributions is shown in (e) and (f). The cyan dotted line shows the non-$\Upsilon$ background, the grey dashed line shows the combinatorial background, the red dashed line the $\chi_{b1}$ contribution, the green dash-dotted line the $\chi _{ b 2}$ contribution, and the blue full line the sum of all these contributions. |
Chib1P[..].pdf [25 KiB] HiDef png [308 KiB] Thumbnail [233 KiB] *.C file |
|
|
Chib2P[..].pdf [24 KiB] HiDef png [288 KiB] Thumbnail [238 KiB] *.C file |
|
|
|
Chib3P[..].pdf [25 KiB] HiDef png [303 KiB] Thumbnail [250 KiB] *.C file |

|
|
|
Chib3P[..].pdf [25 KiB] HiDef png [309 KiB] Thumbnail [248 KiB] *.C file |

|
|
|
Chib3P[..].pdf [26 KiB] HiDef png [325 KiB] Thumbnail [276 KiB] *.C file |

|
|
|
Chib3P[..].pdf [25 KiB] HiDef png [328 KiB] Thumbnail [269 KiB] *.C file |

|
|
|
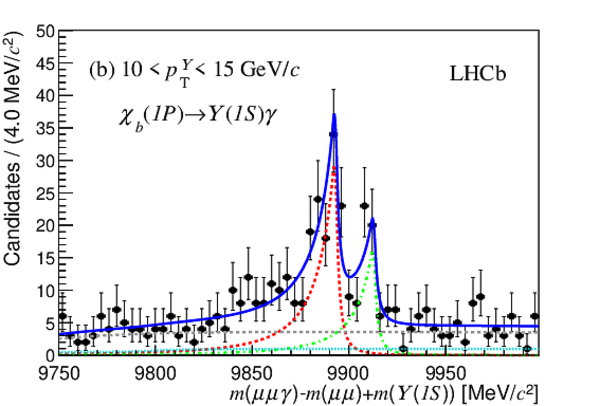
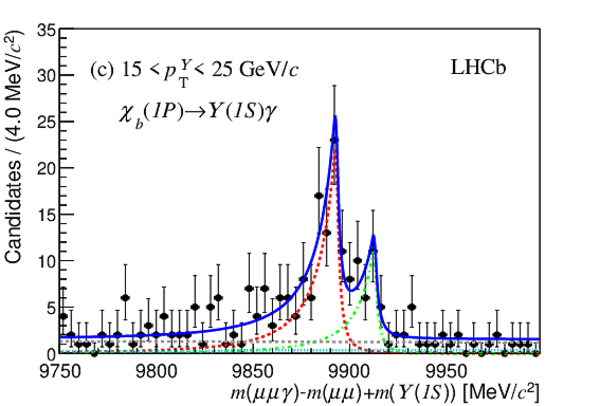
Distribution of $m^*(\mu ^+ \mu ^- \gamma )\equiv m(\mu ^+ \mu ^- \gamma )-m(\mu ^+ \mu ^- )+m(\Upsilon)$ for $\chi _{ b }(1P)$ candidates with fit projections overlaid for each of the three ranges in $p_{\rm T}^{\Upsilon}$ : (a) 5--10 $ {\mathrm{ Ge V /}c}$ , (b) 10--15 $ {\mathrm{ Ge V /}c}$ and (c) 15--25 $ {\mathrm{ Ge V /}c}$ . The cyan dotted line show the non-$\Upsilon$ background, the grey dashed line shows the combinatorial background, the red dashed line the $\chi_{b1}$ contribution, the green dash-dotted line the $\chi_{b2}$ contribution and the blue full line the sum of all these contributions. |
Chib1P[..].pdf [23 KiB] HiDef png [318 KiB] Thumbnail [247 KiB] *.C file |

|
|
Chib1P[..].pdf [23 KiB] HiDef png [310 KiB] Thumbnail [242 KiB] *.C file |
|
|
|
Chib1P[..].pdf [22 KiB] HiDef png [296 KiB] Thumbnail [220 KiB] *.C file |
|
|
|
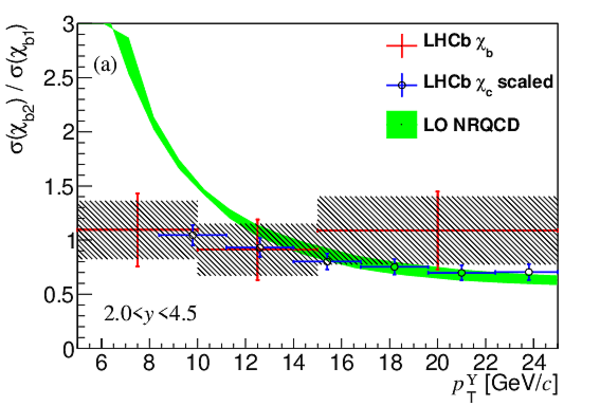
Relative production cross-sections of $\chi_{b1}$ to $\chi_{b2}$ mesons as a function of $ p_{\rm T}^{\Upsilon} $. Panel (a) shows the comparison of this measurement (the hatched rectangles show the statistical uncertainties and the red crosses the total experimental uncertainty) to the LO NRQCD prediction [9] (green band), and to the LHCb $\chi _{ c }$ result (blue crosses), where the $p_{\rm T}$ axis has been scaled by $m(\chi _{ b })/m(\chi _{ c })=2.8$. Panel (b) compares this measurement (empty squares) to CMS results [31] (filled squares) and to the scaled LHCb $\chi _{ c }$ results (empty circles). The error bars are the total experimental uncertainties and do not include the uncertainties on the branching fractions. |
Chibra[..].pdf [16 KiB] HiDef png [384 KiB] Thumbnail [297 KiB] *.C file |
|
|
sigmar[..].pdf [15 KiB] HiDef png [131 KiB] Thumbnail [116 KiB] *.C file |

|
|
|
Animated gif made out of all figures. |
PAPER-2014-040.gif Thumbnail |

|
![HiDef png [235 KiB]](Directory_LHCb-PAPER-2014-040/hidef_FitUpsilon_datacuts1P.png)
![HiDef png [308 KiB]](Directory_LHCb-PAPER-2014-040/hidef_Chib1P1S_uFitnew.png)
![HiDef png [288 KiB]](Directory_LHCb-PAPER-2014-040/hidef_Chib2P1S_uFitnew.png)
![HiDef png [303 KiB]](Directory_LHCb-PAPER-2014-040/hidef_Chib3P1S_uFitnew.png)
![HiDef png [309 KiB]](Directory_LHCb-PAPER-2014-040/hidef_Chib3P2S_uFitnew.png)
![HiDef png [325 KiB]](Directory_LHCb-PAPER-2014-040/hidef_Chib3P1S_cFitnew.png)
![HiDef png [328 KiB]](Directory_LHCb-PAPER-2014-040/hidef_Chib3P2S_cFitnew.png)
![HiDef png [318 KiB]](Directory_LHCb-PAPER-2014-040/hidef_Chib1P1S_uFit5-10GeV.png)
![HiDef png [310 KiB]](Directory_LHCb-PAPER-2014-040/hidef_Chib1P1S_uFit10-15GeV.png)
![HiDef png [296 KiB]](Directory_LHCb-PAPER-2014-040/hidef_Chib1P1S_uFit15-25GeV.png)
![HiDef png [384 KiB]](Directory_LHCb-PAPER-2014-040/hidef_Chibrationew.png)
![HiDef png [131 KiB]](Directory_LHCb-PAPER-2014-040/hidef_sigmarationew_compCMS.png)
Tables and captions
|
Selection criteria for each $\chi _{ b }(nP)\rightarrow \Upsilon(mS)\gamma $ transition. SB indicates sideband. |
Table_1.pdf [47 KiB] HiDef png [55 KiB] Thumbnail [23 KiB] tex code |

|
|
Fitted values of the $\chi _{ b }(nP)$ $(n=1,2)$ masses (in $ {\mathrm{ Me V /}c^2}$ ) from the $\chi _{ b }(nP)\rightarrow \Y1S\gamma $ transitions, compared to the world average values. The uncertainties are statistical only. |
Table_2.pdf [36 KiB] HiDef png [55 KiB] Thumbnail [27 KiB] tex code |

|
|
Fitted values of the $\chi _{ b }(3P)$ mass (in $ {\mathrm{ Me V /}c^2}$ ) for the $\chi _{ b }(3P)\rightarrow \Upsilon(mS)\gamma $ ($m=1,2$) transitions. The last column gives the result of the simultaneous fit to the two transitions. The values are corrected for the mass bias ($-3$ $ {\mathrm{ Me V /}c^2}$ and $-0.5$ $ {\mathrm{ Me V /}c^2}$ for the $\Y1S$ and $\Y2S$ transitions, respectively). The last row gives the total $\chi _{ b }$ yields. The uncertainties are statistical only. |
Table_3.pdf [50 KiB] HiDef png [55 KiB] Thumbnail [26 KiB] tex code |

|
|
Summary of the systematic uncertainties on the $\chi _{ b }(nP)$ ($n=1,2$) mass splitting and on the $\chi _{ b 1}(3P)$ mass in $ {\mathrm{ Me V /}c^2}$ . The last column refers to the simultaneous fit to the two transitions. |
Table_4.pdf [54 KiB] HiDef png [52 KiB] Thumbnail [25 KiB] tex code |

|
|
Relative rate of $\chi _{ b 1}(1P)$ and $\chi _{ b 2}(1P)$ production and ratio of total efficiency (in the three $p_{\rm T}^{\Upsilon}$ ranges). Uncertainties only refer to the statistical contributions. |
Table_5.pdf [43 KiB] HiDef png [35 KiB] Thumbnail [18 KiB] tex code |

|
|
Summary of the systematic uncertainties on the $\chi _{ b }(1P)$ relative rates, expressed as fractions of the relative rate. |
Table_6.pdf [54 KiB] HiDef png [87 KiB] Thumbnail [42 KiB] tex code |

|
|
Relative production cross section of $\chi_{b1}$ to $\chi_{b2}$ mesons for the $1P$ state for each $p_{\rm T}^{\Upsilon}$ bin. The first uncertainty is statistical, the second is the systematic uncertainty and the third is due to the uncertainty on the branching fractions. |
Table_7.pdf [52 KiB] HiDef png [50 KiB] Thumbnail [24 KiB] tex code |

|
![HiDef png [55 KiB]](Directory_LHCb-PAPER-2014-040/hidef_Table_1.png)
![HiDef png [55 KiB]](Directory_LHCb-PAPER-2014-040/hidef_Table_2.png)
![HiDef png [55 KiB]](Directory_LHCb-PAPER-2014-040/hidef_Table_3.png)
![HiDef png [52 KiB]](Directory_LHCb-PAPER-2014-040/hidef_Table_4.png)
![HiDef png [35 KiB]](Directory_LHCb-PAPER-2014-040/hidef_Table_5.png)
![HiDef png [87 KiB]](Directory_LHCb-PAPER-2014-040/hidef_Table_6.png)
![HiDef png [50 KiB]](Directory_LHCb-PAPER-2014-040/hidef_Table_7.png)
Created on 26 April 2024.