Measurement of the $\bar{B}^0-B^0$ and $\bar{B}^0_s-B^0_s$ production asymmetries in $pp$ collisions at $\sqrt{s}=7$ TeV
[to restricted-access page]Information
LHCb-PAPER-2014-042
CERN-PH-EP-2014-181
arXiv:1408.0275 [PDF]
(Submitted on 01 Aug 2014)
Phys. Lett. B739 (2014) 218
Inspire 1309439
Tools
Abstract
The B0bar-B0 and Bsbar-Bs production asymmetries, AP(B0) and AP(Bs), are measured by means of a time-dependent analysis of B0 -> J/\psi K*0, B0 -> D- pi+ and Bs -> Ds- pi+ decays, using a data sample corresponding to an integrated luminosity of 1.0 fb^{-1}, collected by LHCb in pp collisions at a centre-of-mass energy of 7 TeV. The measurements are performed as a function of transverse momentum and pseudorapidity of the B0 and Bs mesons within the LHCb acceptance. The production asymmetries, integrated over pT and eta in the range 4 < pT< 30 GeV/c and 2.5<eta<4.5, are determined to be AP(B0) = (-0.35 +/- 0.76 +/- 0.28) and AP(Bs) = (1.09 +/- 2.61 +/- 0.66), where the first uncertainties are statistical and the second systematic.
Figures and captions
|
Distributions of (left) invariant mass and (right) decay time for (top) $ B ^0 \rightarrow { J \mskip -3mu/\mskip -2mu\psi \mskip 2mu} K ^{*0} $, (middle) $ B ^0 \rightarrow D ^- \pi ^+ $ and (bottom) $ B ^0_ s \rightarrow D ^-_ s \pi ^+ $ decays, with the results of the fit overlaid. The contributions of the various background sources are also shown. |
massBd[..].pdf [149 KiB] HiDef png [163 KiB] Thumbnail [140 KiB] *.C file |

|
|
timeBd[..].pdf [155 KiB] HiDef png [174 KiB] Thumbnail [156 KiB] *.C file |

|
|
|
massBd[..].pdf [173 KiB] HiDef png [201 KiB] Thumbnail [173 KiB] *.C file |

|
|
|
timeBd[..].pdf [160 KiB] HiDef png [215 KiB] Thumbnail [192 KiB] *.C file |

|
|
|
massBs[..].pdf [163 KiB] HiDef png [216 KiB] Thumbnail [184 KiB] *.C file |

|
|
|
timeBs[..].pdf [173 KiB] HiDef png [218 KiB] Thumbnail [188 KiB] *.C file |

|
|
|
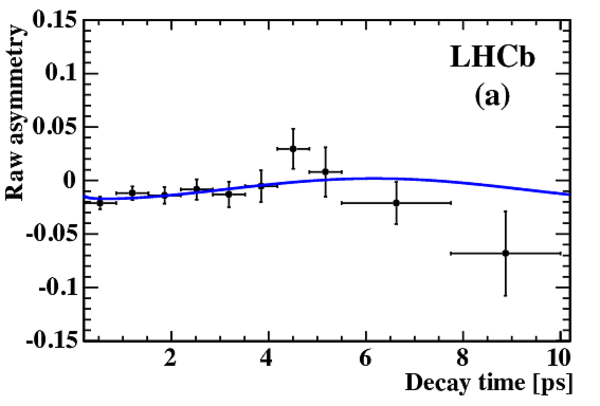
Time-dependent raw asymmetries for candidates in the (a) $ B ^0 \rightarrow { J \mskip -3mu/\mskip -2mu\psi \mskip 2mu} K ^{*0} $ , (b) $ B ^0 \rightarrow D ^- \pi ^+ $ and (c) $ B ^0_ s \rightarrow D ^-_ s \pi ^+ $ signal mass regions with the results of the global fits overlaid. In (c) the asymmetry is obtained by folding the $\overline{ B }{} {}^0_ s $ and $ B ^0_ s $ decay time distributions into one oscillation period, and the offset $t_0 = 0.2$ $ {\rm ps}$ corresponds to the selection requirement on the decay time. |
asymBd[..].pdf [99 KiB] HiDef png [114 KiB] Thumbnail [115 KiB] *.C file |
|
|
asymBd2Dpi.pdf [96 KiB] HiDef png [109 KiB] Thumbnail [113 KiB] *.C file |

|
|
|
asymBs[..].pdf [123 KiB] HiDef png [113 KiB] Thumbnail [119 KiB] *.C file |

|
|
|
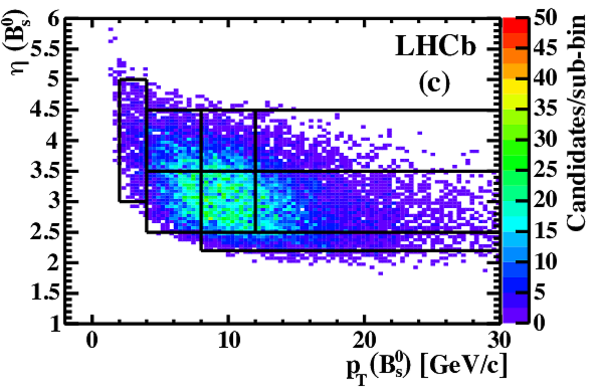
Distributions of $p_\mathrm{T}$ and $\eta$, where the background components are subtracted using the sPlot technique [23], for (a) $ B ^0 \rightarrow { J \mskip -3mu/\mskip -2mu\psi \mskip 2mu} K ^{*0} $ , (b) $ B ^0 \rightarrow D ^- \pi ^+ $ and (c) $ B ^0_ s \rightarrow D ^-_ s \pi ^+ $ decays. The definition of the various kinematic bins is superimposed. |
Bd2Jps[..].pdf [238 KiB] HiDef png [420 KiB] Thumbnail [298 KiB] *.C file |

|
|
Bd2Dpi[..].pdf [210 KiB] HiDef png [421 KiB] Thumbnail [296 KiB] *.C file |

|
|
|
Bs2Dsp[..].pdf [194 KiB] HiDef png [419 KiB] Thumbnail [332 KiB] *.C file |
|
|
|
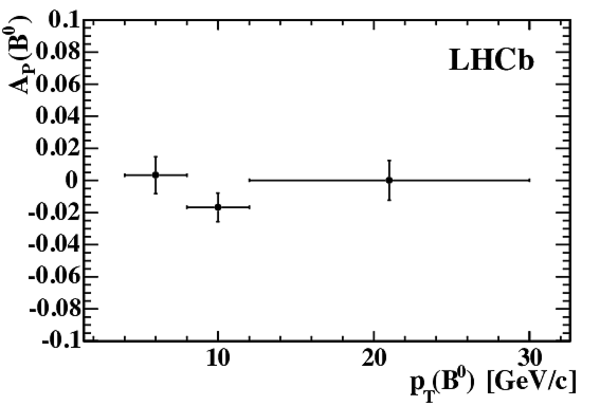
Dependence of (top) $A_\mathrm{P}(B^0)$ and (bottom) $A_\mathrm{P}(B^0_s)$ on (left) $p_{\rm T}$ and (right) $\eta$. The error bars include both statistical and systematic uncertainties. |
ApB0_pt.pdf [100 KiB] HiDef png [77 KiB] Thumbnail [47 KiB] *.C file |
|
|
ApB0_eta.pdf [103 KiB] HiDef png [75 KiB] Thumbnail [46 KiB] *.C file |

|
|
|
ApBs_pt.pdf [100 KiB] HiDef png [64 KiB] Thumbnail [38 KiB] *.C file |

|
|
|
ApBs_eta.pdf [103 KiB] HiDef png [61 KiB] Thumbnail [37 KiB] *.C file |

|
|
|
Animated gif made out of all figures. |
PAPER-2014-042.gif Thumbnail |

|
![HiDef png [163 KiB]](Directory_LHCb-PAPER-2014-042/hidef_massBd2JpsiKstar_plain.png)
![HiDef png [174 KiB]](Directory_LHCb-PAPER-2014-042/hidef_timeBd2JpsiKstar_plain.png)
![HiDef png [201 KiB]](Directory_LHCb-PAPER-2014-042/hidef_massBd2Dpi_plain.png)
![HiDef png [215 KiB]](Directory_LHCb-PAPER-2014-042/hidef_timeBd2Dpi_plain.png)
![HiDef png [216 KiB]](Directory_LHCb-PAPER-2014-042/hidef_massBs2Dspi_plain.png)
![HiDef png [218 KiB]](Directory_LHCb-PAPER-2014-042/hidef_timeBs2Dspi_plain.png)
![HiDef png [114 KiB]](Directory_LHCb-PAPER-2014-042/hidef_asymBd2JpsiKstar.png)
![HiDef png [109 KiB]](Directory_LHCb-PAPER-2014-042/hidef_asymBd2Dpi.png)
![HiDef png [113 KiB]](Directory_LHCb-PAPER-2014-042/hidef_asymBs2Dspi.png)
![HiDef png [420 KiB]](Directory_LHCb-PAPER-2014-042/hidef_Bd2JpsiKstar_bins_paper.png)
![HiDef png [421 KiB]](Directory_LHCb-PAPER-2014-042/hidef_Bd2Dpi_bins_paper.png)
![HiDef png [419 KiB]](Directory_LHCb-PAPER-2014-042/hidef_Bs2Dspi_bins_paper.png)
![HiDef png [77 KiB]](Directory_LHCb-PAPER-2014-042/hidef_ApB0_pt.png)
![HiDef png [75 KiB]](Directory_LHCb-PAPER-2014-042/hidef_ApB0_eta.png)
![HiDef png [64 KiB]](Directory_LHCb-PAPER-2014-042/hidef_ApBs_pt.png)
![HiDef png [61 KiB]](Directory_LHCb-PAPER-2014-042/hidef_ApBs_eta.png)
Tables and captions
|
Values of the various physical inputs used in the fits. |
Table_1.pdf [66 KiB] HiDef png [109 KiB] Thumbnail [51 KiB] tex code |

|
|
Values of signal yields, $A_{\rm P}$, $A_{f}$ and of the correlations $\rho(A_{\rm P}, A_f)$ obtained from global fits. The smaller value of the correlation in the $ B ^0_ s $ case is due to the much larger mixing frequency of $ B ^0_ s $ mesons. |
Table_2.pdf [53 KiB] HiDef png [50 KiB] Thumbnail [24 KiB] tex code |

|
|
Combined values of $A_\mathrm{P}( B ^0 )$ from $B^0\rightarrow J/\psi K^{*0}$ and $ B ^0 \rightarrow D ^- \pi ^+ $ decays, corresponding to the various kinematic bins. The first uncertainties are statistical and the second systematic. For completeness, the values obtained either from $B^0\rightarrow J/\psi K^{*0}$ or $ B ^0 \rightarrow D ^- \pi ^+ $ decays are also reported in the last two columns, with statistical uncertainties only. The values of the last two bins are obtained from $B^0\rightarrow J/\psi K^{*0}$ decays alone. |
Table_3.pdf [45 KiB] HiDef png [191 KiB] Thumbnail [88 KiB] tex code |

|
|
Values of $A_\mathrm{P}( B ^0_ s )$ from $ B ^0_ s \rightarrow D ^-_ s \pi ^+ $ decays, corresponding to the various kinematic bins. The first uncertainties are statistical and the second systematic. |
Table_4.pdf [42 KiB] HiDef png [118 KiB] Thumbnail [58 KiB] tex code |

|
|
Values of $\omega_i$ determined from simulation and $\omega_i^{\rm data}$ extracted from data using $B^0\rightarrow J/\psi K^{*0}$ decays in two different binning schemes. The $\omega_i$ values and the difference between $\omega_i$ and $\omega_i^{\rm data}$ values are used to determine the integrated results and to evaluate the related systematic uncertainties, respectively. |
Table_5.pdf [42 KiB] HiDef png [206 KiB] Thumbnail [69 KiB] tex code |

|
|
Absolute values of systematic uncertainties. The total systematic uncertainties are obtained by summing the individual contributions in quadrature. |
Table_6.pdf [47 KiB] HiDef png [48 KiB] Thumbnail [20 KiB] tex code |

|
|
Values of the production asymmetry $A_\mathrm{P}(B^0)$ in bins of $p_{\rm T}$ and $\eta$ from $ B ^0 \rightarrow J/\psi K ^{*0} $ and $ B ^0 \rightarrow D ^- \pi ^+ $ decays. The first uncertainties are statistical and the second systematic. |
Table_7.pdf [37 KiB] HiDef png [81 KiB] Thumbnail [39 KiB] tex code |

|
|
Values of the production asymmetry $A_\mathrm{P}(B^0_s)$ in bins of $p_{\rm T}$ and $\eta$ from $ B ^0_ s \rightarrow D ^-_ s \pi ^+ $ decays. The first uncertainties are statistical and the second systematic. |
Table_8.pdf [44 KiB] HiDef png [72 KiB] Thumbnail [34 KiB] tex code |

|
![HiDef png [109 KiB]](Directory_LHCb-PAPER-2014-042/hidef_Table_1.png)
![HiDef png [50 KiB]](Directory_LHCb-PAPER-2014-042/hidef_Table_2.png)
![HiDef png [191 KiB]](Directory_LHCb-PAPER-2014-042/hidef_Table_3.png)
![HiDef png [118 KiB]](Directory_LHCb-PAPER-2014-042/hidef_Table_4.png)
![HiDef png [206 KiB]](Directory_LHCb-PAPER-2014-042/hidef_Table_5.png)
![HiDef png [48 KiB]](Directory_LHCb-PAPER-2014-042/hidef_Table_6.png)
![HiDef png [81 KiB]](Directory_LHCb-PAPER-2014-042/hidef_Table_7.png)
![HiDef png [72 KiB]](Directory_LHCb-PAPER-2014-042/hidef_Table_8.png)
Created on 27 April 2024.