Measurements of $C P$ violation in the three-body phase space of charmless $B^{\pm}$ decays
[to restricted-access page]Information
LHCb-PAPER-2014-044
CERN-PH-EP-2014-203
arXiv:1408.5373 [PDF]
(Submitted on 22 Aug 2014)
Phys. Rev. D90 (2014) 112004
Inspire 1311994
Tools
Abstract
The charmless three-body decay modes $B^{\pm} \rightarrow K^{\pm} \pi^{+} \pi^{-}$, $B^{\pm} \rightarrow K^{\pm} K^{+} K^{-}$, $B^{\pm} \rightarrow \pi^{\pm} K^{+} K^{-}$ and $B^{\pm} \rightarrow \pi^{\pm} \pi^{+} \pi^{-}$ are reconstructed using data, corresponding to an integrated luminosity of 3.0\;$ fb^{-1}$, collected by the LHCb detector. The inclusive $C P$ asymmetries of these modes are measured to be $$ A_{C P}(B^{\pm} \rightarrow K^{\pm} \pi^{+} \pi^{-})= +0.025 \pm 0.004 \pm 0.004 \pm 0.007 \\ A_{C P}(B^{\pm} \rightarrow K^{\pm} K^{+} K^{-}) = -0.036 \pm 0.004 \pm 0.002 \pm 0.007 \\ A_{C P}(B^{\pm} \rightarrow \pi^{\pm} \pi^{+} \pi^{-})= +0.058 \pm 0.008 \pm 0.009 \pm 0.007 \\ A_{C P}(B^{\pm} \rightarrow \pi^{\pm} K^{+} K^{-})= -0.123 \pm 0.017 \pm 0.012 \pm 0.007 $$ where the first uncertainty is statistical, the second systematic, and the third is due to the $C P$ asymmetry of the $B^{\pm} \rightarrow J/\psi K^{\pm}$ reference mode. The distributions of these asymmetries are also studied as functions of position in the Dalitz plot and suggest contributions from rescattering and resonance interference processes.
Figures and captions
|
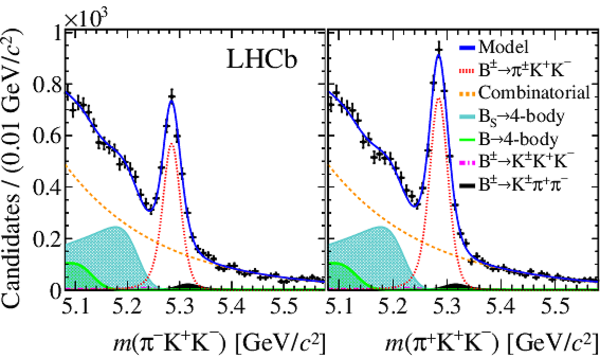
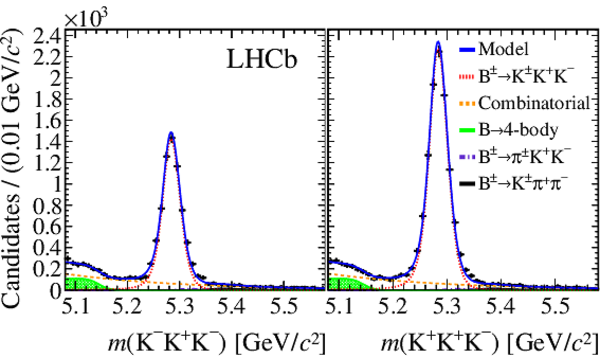
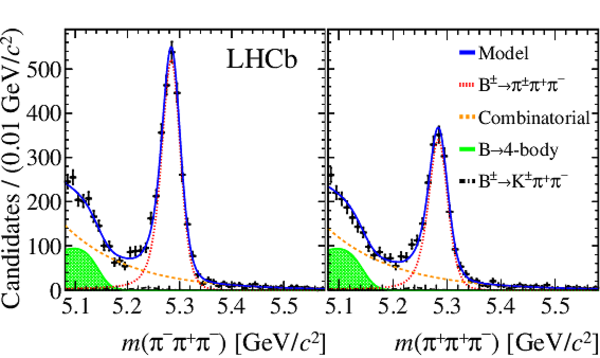
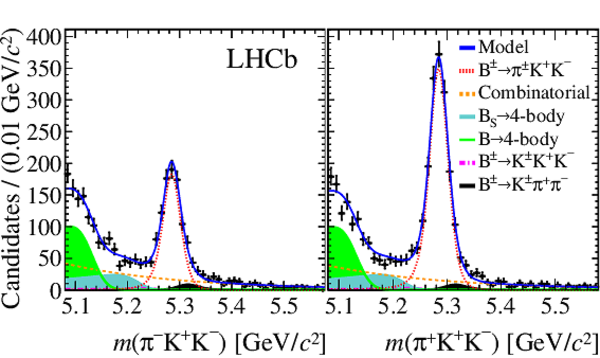
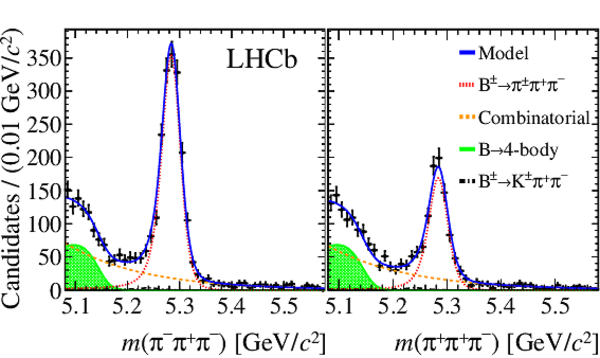
Invariant mass spectra of (a) $ { B ^\pm \rightarrow K ^\pm \pi ^+ \pi ^- }$ , (b) $ { B ^\pm \rightarrow K ^\pm K ^+ K ^- }$ , (c) $ { B ^\pm \rightarrow \pi ^\pm \pi ^+ \pi ^- }$ and (d) $ { B ^\pm \rightarrow \pi ^\pm K ^+ K ^- }$ decays. The left panel on each figure shows the $ B ^- $ candidates and the right panel shows the $ B ^+ $ candidates. The results of the unbinned maximum likelihood fits are overlaid. The main components of the fits are also shown. |
Fig1a.pdf [38 KiB] HiDef png [382 KiB] Thumbnail [275 KiB] *.C file |

|
|
Fig1b.pdf [36 KiB] HiDef png [310 KiB] Thumbnail [238 KiB] *.C file |

|
|
|
Fig1c.pdf [35 KiB] HiDef png [368 KiB] Thumbnail [262 KiB] *.C file |

|
|
|
Fig1d.pdf [38 KiB] HiDef png [539 KiB] Thumbnail [319 KiB] *.C file |
|
|
|
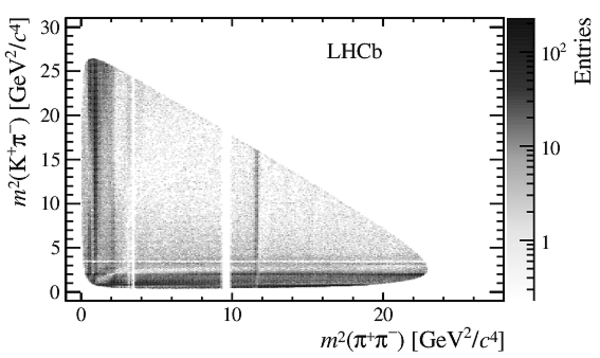
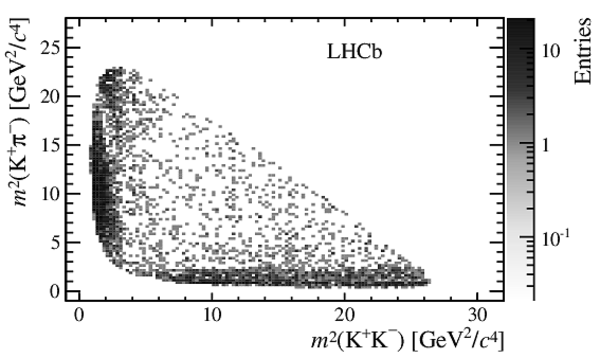
Dalitz plot distributions of (a) $ { B ^\pm \rightarrow K ^\pm K ^+ K ^- }$ , (b) $ { B ^\pm \rightarrow K ^\pm \pi ^+ \pi ^- }$ , (c) $ { B ^\pm \rightarrow \pi ^\pm \pi ^+ \pi ^- }$ and (d) $ { B ^\pm \rightarrow \pi ^\pm K ^+ K ^- }$ candidates. The visible gaps correspond to the exclusion of the $J/\psi$ (in the $ { B ^\pm \rightarrow K ^\pm \pi ^+ \pi ^- }$ decay) and $ D ^0$ (all plots, except for the $ { B ^\pm \rightarrow \pi ^\pm K ^+ K ^- }$ decay) mesons from the samples. |
Fig2a.pdf [89 KiB] HiDef png [440 KiB] Thumbnail [140 KiB] *.C file |

|
|
Fig2b.pdf [137 KiB] HiDef png [507 KiB] Thumbnail [152 KiB] *.C file |
|
|
|
Fig2c.pdf [59 KiB] HiDef png [370 KiB] Thumbnail [151 KiB] *.C file |

|
|
|
Fig2d.pdf [31 KiB] HiDef png [235 KiB] Thumbnail [118 KiB] *.C file |
|
|
|
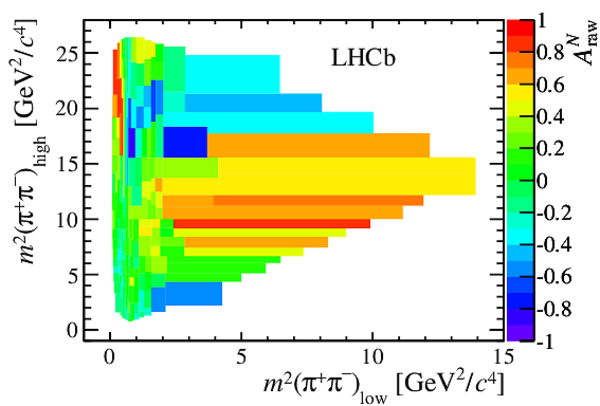
(colour online) Measured $ A_{\rm raw}^{N}$ in Dalitz plot bins of background-subtracted and acceptance-corrected events for (a) $ { B ^\pm \rightarrow K ^\pm K ^+ K ^- }$ , (b) $ { B ^\pm \rightarrow K ^\pm \pi ^+ \pi ^- }$ , (c) $ { B ^\pm \rightarrow \pi ^\pm \pi ^+ \pi ^- }$ and (d) $ { B ^\pm \rightarrow \pi ^\pm K ^+ K ^- }$ decays. |
Fig3a.pdf [31 KiB] HiDef png [244 KiB] Thumbnail [224 KiB] *.C file |

|
|
Fig3b.pdf [31 KiB] HiDef png [216 KiB] Thumbnail [196 KiB] *.C file |

|
|
|
Fig3c.pdf [18 KiB] HiDef png [158 KiB] Thumbnail [152 KiB] *.C file |
|
|
|
Fig3d.pdf [15 KiB] HiDef png [126 KiB] Thumbnail [123 KiB] *.C file |

|
|
|
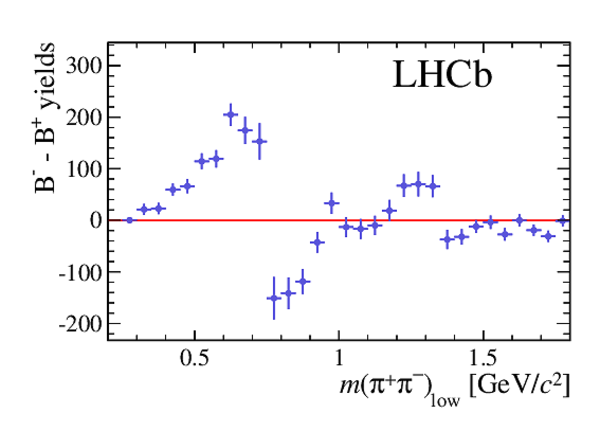
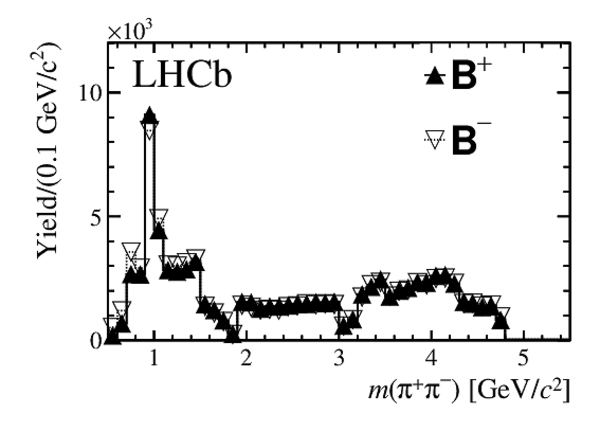
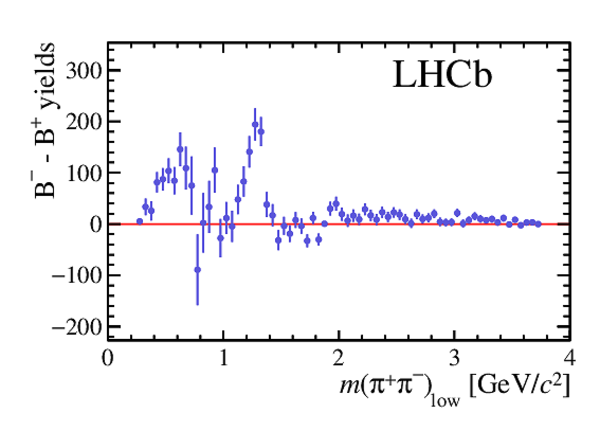
Projections in bins of the $ m(\pi ^+ \pi ^- )_{\rm low}$ variable of (a, b) the number of $ B ^- $ and $ B ^+ $ signal events and (c, d) their difference for $ { B ^\pm \rightarrow \pi ^\pm \pi ^+ \pi ^- }$ decays. The plots are restricted to events with (a, c) $\cos\theta<0$ and (b, d) $\cos\theta>0$, with $\cos\theta$ defined in the text. The yields are acceptance-corrected and background-subtracted. A guide line for zero (horizontal red line) was included on plots (c, d). |
Fig4a.pdf [15 KiB] HiDef png [198 KiB] Thumbnail [163 KiB] *.C file |

|
|
Fig4b.pdf [15 KiB] HiDef png [183 KiB] Thumbnail [150 KiB] *.C file |

|
|
|
Fig4c.pdf [15 KiB] HiDef png [135 KiB] Thumbnail [114 KiB] *.C file |
|
|
|
Fig4d.pdf [15 KiB] HiDef png [130 KiB] Thumbnail [111 KiB] *.C file |

|
|
|
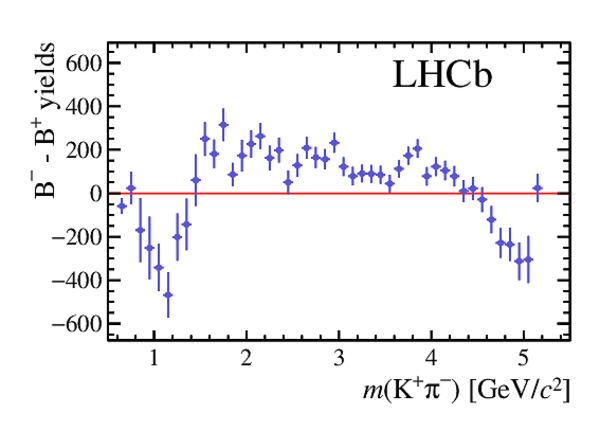
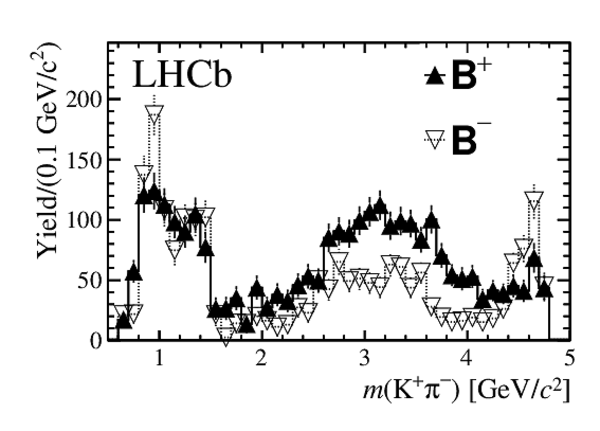
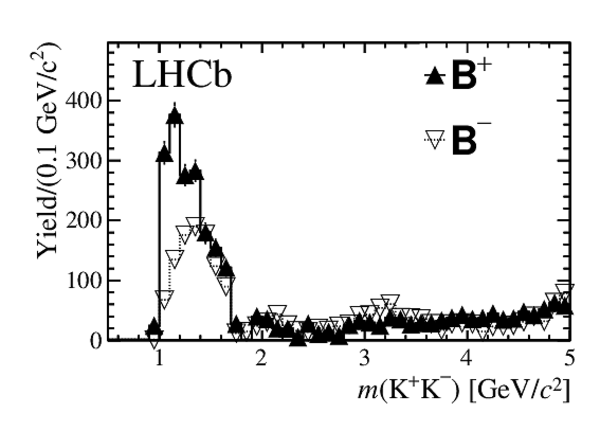
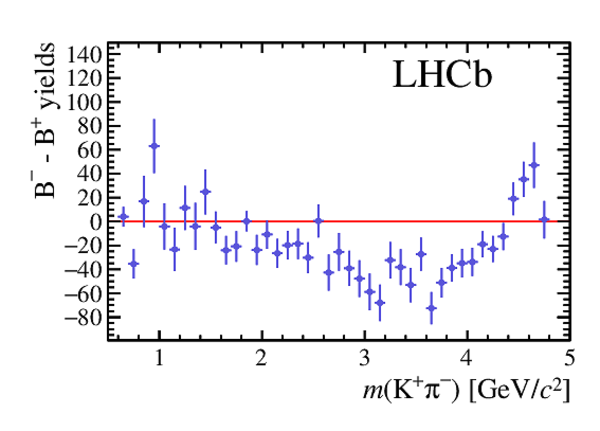
Projections in bins of the $ m(\pi ^+ \pi ^- )$ variable of (a, b) the number of $ B ^- $ and $ B ^+ $ signal events and (c, d) their difference for $ { B ^\pm \rightarrow K ^\pm \pi ^+ \pi ^- }$ decays. The plots are restricted to events with (a, c) $\cos\theta<0$ and (b, d) $\cos\theta>0$. The yields are acceptance-corrected and background-subtracted. A guide line for zero (horizontal red line) was included on plots (c, d). |
Fig5a.pdf [15 KiB] HiDef png [123 KiB] Thumbnail [67 KiB] *.C file |

|
|
Fig5b.pdf [15 KiB] HiDef png [105 KiB] Thumbnail [58 KiB] *.C file |

|
|
|
Fig5c.pdf [15 KiB] HiDef png [131 KiB] Thumbnail [112 KiB] *.C file |

|
|
|
Fig5d.pdf [15 KiB] HiDef png [130 KiB] Thumbnail [110 KiB] *.C file |

|
|
|
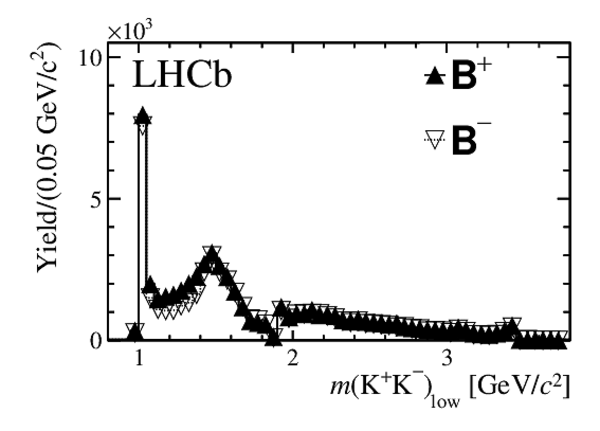
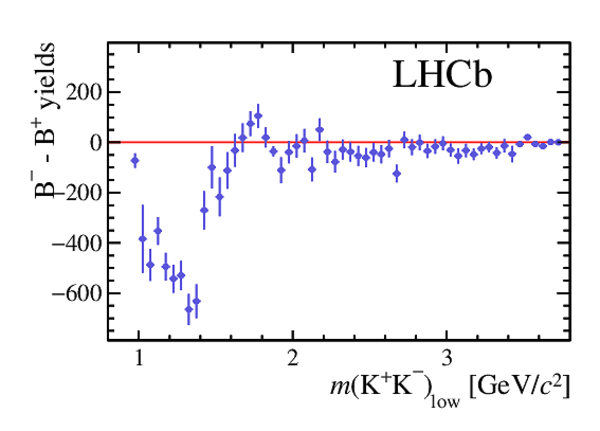
Projections in bins of the $ m( K ^+ K ^- )_{\rm low}$ variable of (a, b) the number of $ B ^- $ and $ B ^+ $ signal events and (c, d) their difference for $ { B ^\pm \rightarrow K ^\pm K ^+ K ^- }$ decays. The inset plots show the $\phi$ resonance region of $ m( K ^+ K ^- )_{\rm low}$ between 1.00 and $1.05 {\mathrm{ Ge V /}c^2} $, which is excluded from the main plots. The plots are restricted to events with (a, c) $\cos\theta<0$ and (b, d) $\cos\theta>0$. The yields are acceptance-corrected and background-subtracted. A guide line for zero (horizontal red line) was included on plots (c, d). |
Fig6a.pdf [17 KiB] HiDef png [244 KiB] Thumbnail [222 KiB] *.C file |

|
|
Fig6b.pdf [17 KiB] HiDef png [244 KiB] Thumbnail [216 KiB] *.C file |

|
|
|
Fig6c.pdf [16 KiB] HiDef png [160 KiB] Thumbnail [148 KiB] *.C file |

|
|
|
Fig6d.pdf [16 KiB] HiDef png [153 KiB] Thumbnail [140 KiB] *.C file |

|
|
|
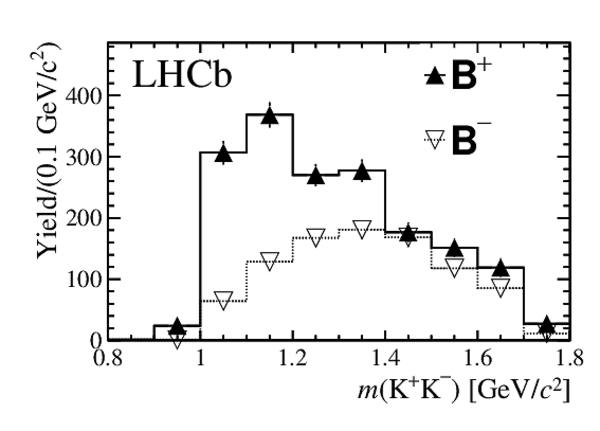
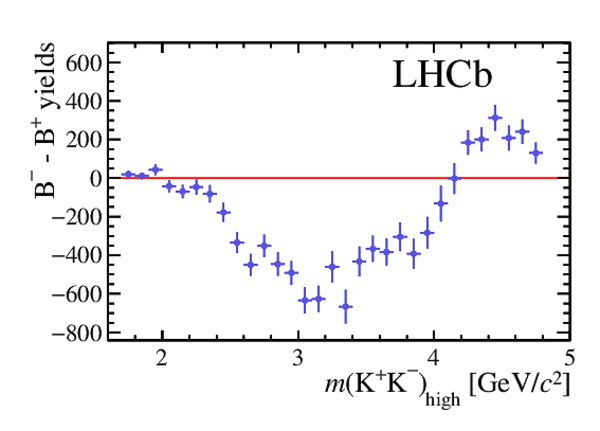
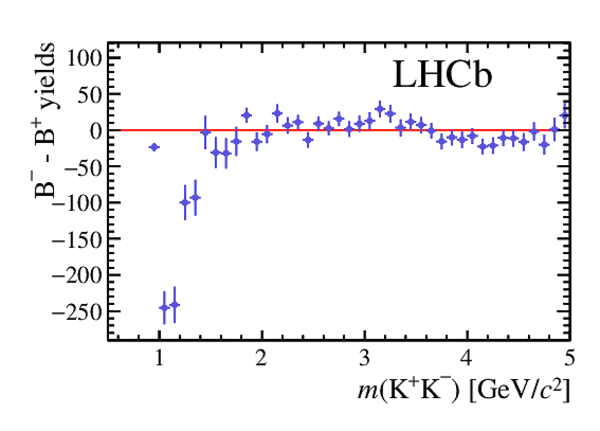
Projections in bins of the $ m( K ^+ K ^- )$ variable of (a) the number of $ B ^- $ and $ B ^+ $ signal events and (b) their difference for $ { B ^\pm \rightarrow \pi ^\pm K ^+ K ^- }$ decays. The yields are acceptance-corrected and background-subtracted. A guide line for zero (horizontal red line) was included on plot (b). |
Fig7a.pdf [14 KiB] HiDef png [108 KiB] Thumbnail [60 KiB] *.C file |
|
|
Fig7b.pdf [14 KiB] HiDef png [109 KiB] Thumbnail [105 KiB] *.C file |

|
|
|
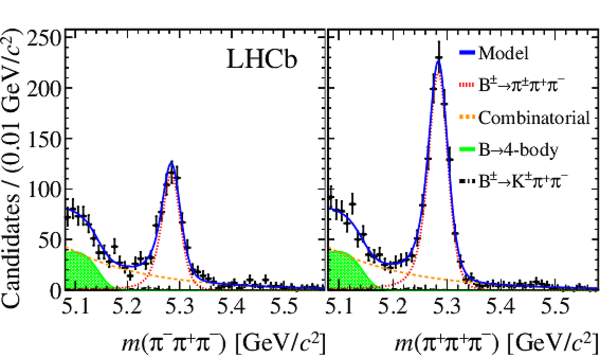
Invariant mass distributions in the rescattering regions ($ m(\pi ^+ \pi ^- ) $ or $ m( K ^+ K ^- ) $ between $1.0$ and $1.5 {\mathrm{ Ge V /}c^2} $) for (a) $ { B ^\pm \rightarrow K ^\pm \pi ^+ \pi ^- }$ , (b) $ { B ^\pm \rightarrow K ^\pm K ^+ K ^- }$ , (c) $ { B ^\pm \rightarrow \pi ^\pm \pi ^+ \pi ^- }$ and (d) $ { B ^\pm \rightarrow \pi ^\pm K ^+ K ^- }$ decays. The left panel in each figure shows the $B^{-}$ candidates and the right panel shows the $B^{+}$ candidates. |
Fig8a.pdf [37 KiB] HiDef png [373 KiB] Thumbnail [275 KiB] *.C file |

|
|
Fig8b.pdf [37 KiB] HiDef png [325 KiB] Thumbnail [257 KiB] *.C file |
|
|
|
Fig8c.pdf [34 KiB] HiDef png [340 KiB] Thumbnail [252 KiB] *.C file |
|
|
|
Fig8d.pdf [34 KiB] HiDef png [380 KiB] Thumbnail [279 KiB] *.C file |
|
|
|
Invariant mass distribution of $ { B ^\pm \rightarrow \pi ^\pm \pi ^+ \pi ^- }$ candidates restricted to (a) sector I, (b) sector II, (c) sector III and (d) sector IV. The left panel in each figure shows the $B^{-}$ candidates and the right panel shows the $B^{+}$ candidates. |
Fig9a.pdf [35 KiB] HiDef png [349 KiB] Thumbnail [262 KiB] *.C file |
|
|
Fig9b.pdf [34 KiB] HiDef png [334 KiB] Thumbnail [248 KiB] *.C file |
|
|
|
Fig9c.pdf [35 KiB] HiDef png [352 KiB] Thumbnail [256 KiB] *.C file |

|
|
|
Fig9d.pdf [34 KiB] HiDef png [330 KiB] Thumbnail [244 KiB] *.C file |

|
|
|
Animated gif made out of all figures. |
PAPER-2014-044.gif Thumbnail |

|
Tables and captions
|
Signal yields of charmless three-body $ B ^\pm$ decays for the full data set. |
Table_1.pdf [43 KiB] HiDef png [77 KiB] Thumbnail [36 KiB] tex code |

|
|
Systematic uncertainties on the measured asymmetries, where the total is the sum in quadrature of the individual contributions. The $ A_{\rm D}^{\pi}$ uncertainty is taken from Ref. [37]. |
Table_2.pdf [47 KiB] HiDef png [111 KiB] Thumbnail [48 KiB] tex code |

|
|
Signal yields and charge asymmetries in the rescattering regions of $ m(\pi ^+ \pi ^- )$ or $ m( K ^+ K ^- )$ between $1.0$ and $1.5 {\mathrm{ Ge V /}c^2} $. For the charge asymmetries, the first uncertainty is statistical, the second systematic, and the third is due to the $ C P$ asymmetry of the $ { B ^\pm \rightarrow { J \mskip -3mu/\mskip -2mu\psi \mskip 2mu} K ^\pm }$ reference mode. |
Table_3.pdf [49 KiB] HiDef png [51 KiB] Thumbnail [25 KiB] tex code |

|
|
Signal yields and charge asymmetries in the regions dominated by the vector resonances. For the charge asymmetries, the first uncertainty is statistical, the second systematic, and the third is due to the $ C P$ asymmetry of the $ { B ^\pm \rightarrow { J \mskip -3mu/\mskip -2mu\psi \mskip 2mu} K ^\pm }$ reference mode. |
Table_4.pdf [54 KiB] HiDef png [121 KiB] Thumbnail [56 KiB] tex code |

|
Supplementary Material [file]


![HiDef png [382 KiB]](Directory_LHCb-PAPER-2014-044/hidef_Fig1a.png)
![HiDef png [310 KiB]](Directory_LHCb-PAPER-2014-044/hidef_Fig1b.png)
![HiDef png [368 KiB]](Directory_LHCb-PAPER-2014-044/hidef_Fig1c.png)
![HiDef png [539 KiB]](Directory_LHCb-PAPER-2014-044/hidef_Fig1d.png)
![HiDef png [440 KiB]](Directory_LHCb-PAPER-2014-044/hidef_Fig2a.png)
![HiDef png [507 KiB]](Directory_LHCb-PAPER-2014-044/hidef_Fig2b.png)
![HiDef png [370 KiB]](Directory_LHCb-PAPER-2014-044/hidef_Fig2c.png)
![HiDef png [235 KiB]](Directory_LHCb-PAPER-2014-044/hidef_Fig2d.png)
![HiDef png [244 KiB]](Directory_LHCb-PAPER-2014-044/hidef_Fig3a.png)
![HiDef png [216 KiB]](Directory_LHCb-PAPER-2014-044/hidef_Fig3b.png)
![HiDef png [158 KiB]](Directory_LHCb-PAPER-2014-044/hidef_Fig3c.png)
![HiDef png [126 KiB]](Directory_LHCb-PAPER-2014-044/hidef_Fig3d.png)
![HiDef png [198 KiB]](Directory_LHCb-PAPER-2014-044/hidef_Fig4a.png)
![HiDef png [183 KiB]](Directory_LHCb-PAPER-2014-044/hidef_Fig4b.png)
![HiDef png [135 KiB]](Directory_LHCb-PAPER-2014-044/hidef_Fig4c.png)
![HiDef png [130 KiB]](Directory_LHCb-PAPER-2014-044/hidef_Fig4d.png)
![HiDef png [123 KiB]](Directory_LHCb-PAPER-2014-044/hidef_Fig5a.png)
![HiDef png [105 KiB]](Directory_LHCb-PAPER-2014-044/hidef_Fig5b.png)
![HiDef png [131 KiB]](Directory_LHCb-PAPER-2014-044/hidef_Fig5c.png)
![HiDef png [130 KiB]](Directory_LHCb-PAPER-2014-044/hidef_Fig5d.png)
![HiDef png [244 KiB]](Directory_LHCb-PAPER-2014-044/hidef_Fig6a.png)
![HiDef png [244 KiB]](Directory_LHCb-PAPER-2014-044/hidef_Fig6b.png)
![HiDef png [160 KiB]](Directory_LHCb-PAPER-2014-044/hidef_Fig6c.png)
![HiDef png [153 KiB]](Directory_LHCb-PAPER-2014-044/hidef_Fig6d.png)
![HiDef png [108 KiB]](Directory_LHCb-PAPER-2014-044/hidef_Fig7a.png)
![HiDef png [109 KiB]](Directory_LHCb-PAPER-2014-044/hidef_Fig7b.png)
![HiDef png [373 KiB]](Directory_LHCb-PAPER-2014-044/hidef_Fig8a.png)
![HiDef png [325 KiB]](Directory_LHCb-PAPER-2014-044/hidef_Fig8b.png)
![HiDef png [340 KiB]](Directory_LHCb-PAPER-2014-044/hidef_Fig8c.png)
![HiDef png [380 KiB]](Directory_LHCb-PAPER-2014-044/hidef_Fig8d.png)
![HiDef png [349 KiB]](Directory_LHCb-PAPER-2014-044/hidef_Fig9a.png)
![HiDef png [334 KiB]](Directory_LHCb-PAPER-2014-044/hidef_Fig9b.png)
![HiDef png [352 KiB]](Directory_LHCb-PAPER-2014-044/hidef_Fig9c.png)
![HiDef png [330 KiB]](Directory_LHCb-PAPER-2014-044/hidef_Fig9d.png)
![HiDef png [77 KiB]](Directory_LHCb-PAPER-2014-044/hidef_Table_1.png)
![HiDef png [111 KiB]](Directory_LHCb-PAPER-2014-044/hidef_Table_2.png)
![HiDef png [51 KiB]](Directory_LHCb-PAPER-2014-044/hidef_Table_3.png)
![HiDef png [121 KiB]](Directory_LHCb-PAPER-2014-044/hidef_Table_4.png)
![HiDef png [116 KiB]](Directory_LHCb-PAPER-2014-044/supplementary/hidef_Fig1a.png)
![HiDef png [109 KiB]](Directory_LHCb-PAPER-2014-044/supplementary/hidef_Fig1b.png)
![HiDef png [161 KiB]](Directory_LHCb-PAPER-2014-044/supplementary/hidef_Fig1c.png)
![HiDef png [141 KiB]](Directory_LHCb-PAPER-2014-044/supplementary/hidef_Fig1d.png)
![HiDef png [122 KiB]](Directory_LHCb-PAPER-2014-044/supplementary/hidef_Fig2a.png)
![HiDef png [108 KiB]](Directory_LHCb-PAPER-2014-044/supplementary/hidef_Fig2b.png)
![HiDef png [145 KiB]](Directory_LHCb-PAPER-2014-044/supplementary/hidef_Fig2c.png)
![HiDef png [156 KiB]](Directory_LHCb-PAPER-2014-044/supplementary/hidef_Fig2d.png)
![HiDef png [137 KiB]](Directory_LHCb-PAPER-2014-044/supplementary/hidef_Fig3a.png)
![HiDef png [118 KiB]](Directory_LHCb-PAPER-2014-044/supplementary/hidef_Fig3b.png)
![HiDef png [157 KiB]](Directory_LHCb-PAPER-2014-044/supplementary/hidef_Fig3c.png)
![HiDef png [165 KiB]](Directory_LHCb-PAPER-2014-044/supplementary/hidef_Fig3d.png)
![HiDef png [164 KiB]](Directory_LHCb-PAPER-2014-044/supplementary/hidef_Fig4a.png)
![HiDef png [123 KiB]](Directory_LHCb-PAPER-2014-044/supplementary/hidef_Fig4b.png)
![HiDef png [170 KiB]](Directory_LHCb-PAPER-2014-044/supplementary/hidef_Fig4c.png)
![HiDef png [156 KiB]](Directory_LHCb-PAPER-2014-044/supplementary/hidef_Fig4d.png)
Created on 27 April 2024.