Search for the lepton flavour violating decay $\tau^-\to \mu^-\mu^+\mu^-$
[to restricted-access page]Information
LHCb-PAPER-2014-052
CERN-PH-EP-2014-236
arXiv:1409.8548 [PDF]
(Submitted on 30 Sep 2014)
JHEP 02 (2015) 121
Inspire 1319484
Tools
Abstract
A search for the lepton flavour violating decay $\tau^-\to \mu^-\mu^+\mu^-$ is performed with the LHCb experiment. The data sample corresponds to an integrated luminosity of $1.0\mathrm{ fb}^{-1}$ of proton-proton collisions at a centre-of-mass energy of $7\mathrm{ Te V}$ and $2.0\mathrm{ fb}^{-1}$ at $8\mathrm{ Te V}$. No evidence is found for a signal, and a limit is set at $90\%$ confidence level on the branching fraction, $\mathcal{B}(\tau^-\to \mu^-\mu^+\mu^-) < 4.6 \times 10^{-8}$.
Figures and captions
|
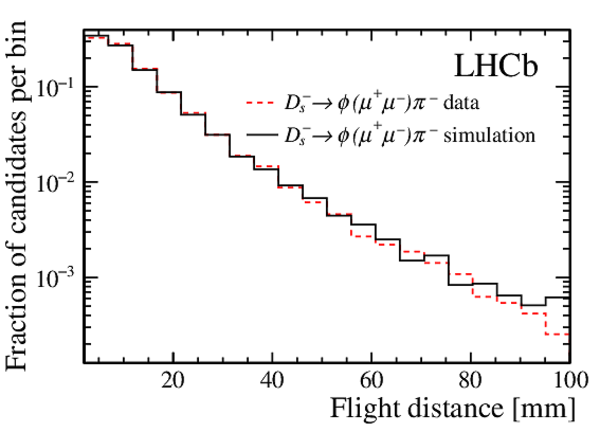
Distribution of (a) $D_s^-$ flight distance and (b) $ {\rm \mathcal{M}_{3body}}$ response for $ D_s^-\rightarrow \phi \left(\mu^+\mu^-\right) \pi^-$ candidates at 8 $\mathrm{ Te V}$ . The dashed (red) lines indicate the data and the solid (black) lines indicate the simulation. The data is background-subtracted using the sPlot technique [29]. |
dataMC_FD.pdf [14 KiB] HiDef png [148 KiB] Thumbnail [146 KiB] *.C file |
|
|
dataMC.pdf [14 KiB] HiDef png [149 KiB] Thumbnail [148 KiB] *.C file |

|
|
|
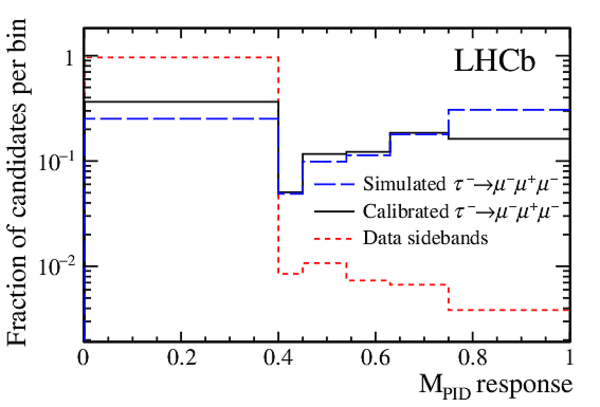
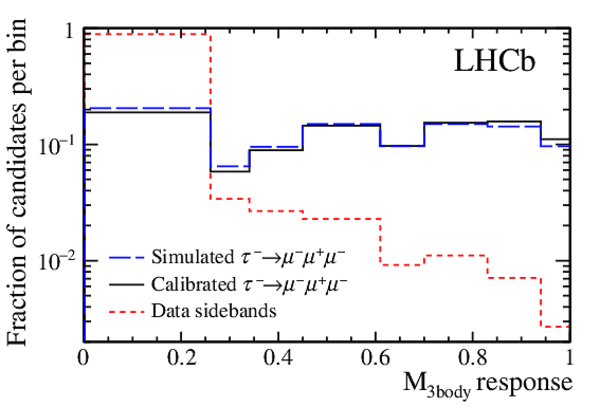
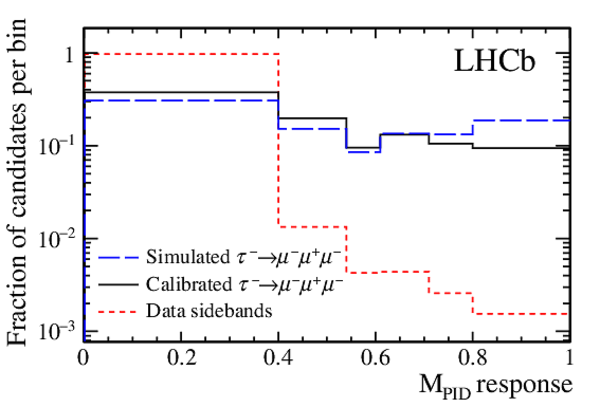
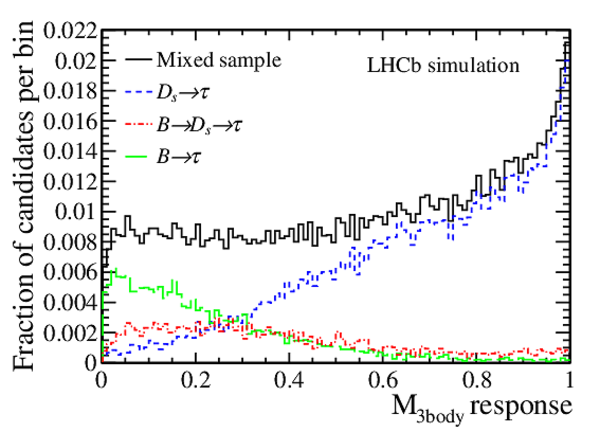
Distribution of (a) $ {\rm \mathcal{M}_{3body}}$ and (b) $ {\rm \mathcal{M}_{PID}}$ response for 7 $\mathrm{ Te V}$ data and (c) $ {\rm \mathcal{M}_{3body}}$ and (d) $ {\rm \mathcal{M}_{PID}}$ response for 8 $\mathrm{ Te V}$ data. The binnings correspond to those used in the extraction of the final results. The short-dashed (red) lines show the response of the data sidebands, whilst the long-dashed (blue) and solid (black) lines show the response of simulated signal events before and after calibration. In all cases the first bin is excluded from the analysis. |
m3body[..].pdf [13 KiB] HiDef png [152 KiB] Thumbnail [144 KiB] *.C file |

|
|
mPID_2[..].pdf [13 KiB] HiDef png [147 KiB] Thumbnail [142 KiB] *.C file |
|
|
|
m3body[..].pdf [14 KiB] HiDef png [149 KiB] Thumbnail [145 KiB] *.C file |
|
|
|
mPID_2[..].pdf [14 KiB] HiDef png [148 KiB] Thumbnail [144 KiB] *.C file |
|
|
|
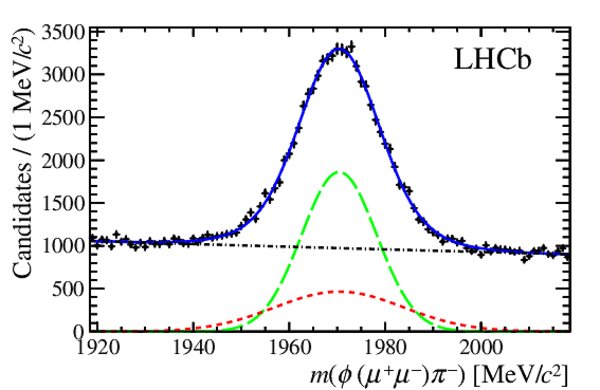
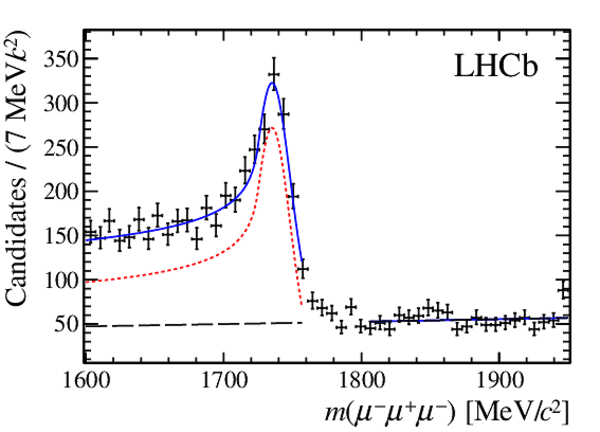
Invariant mass distribution of $\phi(\mu^+\mu^-)\pi^-$ candidates in 8 $\mathrm{ Te V}$ data. The solid (blue) line shows the overall fit, the long-dashed (green) and short-dashed (red) lines show the two Gaussian components of the $D^-_s$ signal and the dot-dashed (black) line shows the combinatorial background contribution. |
Ds_dat[..].pdf [26 KiB] HiDef png [225 KiB] Thumbnail [188 KiB] *.C file |
|
|
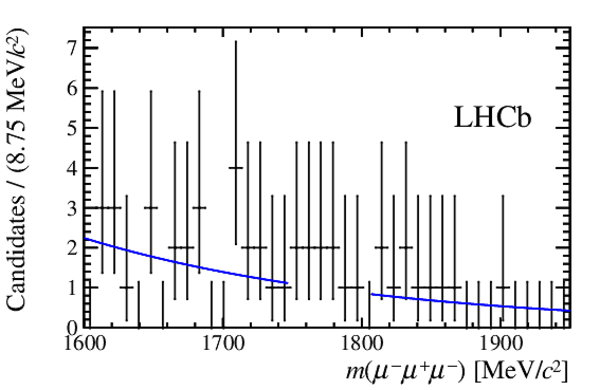
Invariant mass distributions and fits to the mass sidebands in (a) 7 $\mathrm{ Te V}$ and (b) 8 $\mathrm{ Te V}$ data for $\mu^+\mu^-\mu^-$ candidates in the bins of $ {\rm \mathcal{M}_{3body}}$ and $ {\rm \mathcal{M}_{PID}}$ response that contain the highest signal probabilities. |
Bkg2011.pdf [17 KiB] HiDef png [150 KiB] Thumbnail [134 KiB] *.C file |
|
|
Bkg2012.pdf [17 KiB] HiDef png [143 KiB] Thumbnail [122 KiB] *.C file |

|
|
|
Distribution of $\textrm{CL}_{\textrm{s}}$ values as a function of the assumed branching fraction for $\tau^-\rightarrow \mu^-\mu^+\mu^-$ , under the hypothesis to observe background events only. The dashed line indicates the expected limit and the solid line the observed one. The light (yellow) and dark (green) bands cover the regions of 68% and 95% confidence for the expected limit. |
bananaB.pdf [21 KiB] HiDef png [170 KiB] Thumbnail [135 KiB] *.C file |

|
|
Animated gif made out of all figures. |
PAPER-2014-052.gif Thumbnail |

|
![HiDef png [148 KiB]](Directory_LHCb-PAPER-2014-052/hidef_dataMC_FD.png)
![HiDef png [149 KiB]](Directory_LHCb-PAPER-2014-052/hidef_dataMC.png)
![HiDef png [152 KiB]](Directory_LHCb-PAPER-2014-052/hidef_m3body_2011_log.png)
![HiDef png [147 KiB]](Directory_LHCb-PAPER-2014-052/hidef_mPID_2011_log.png)
![HiDef png [149 KiB]](Directory_LHCb-PAPER-2014-052/hidef_m3body_2012_log.png)
![HiDef png [148 KiB]](Directory_LHCb-PAPER-2014-052/hidef_mPID_2012_log.png)
![HiDef png [225 KiB]](Directory_LHCb-PAPER-2014-052/hidef_Ds_data_2012.png)
![HiDef png [150 KiB]](Directory_LHCb-PAPER-2014-052/hidef_Bkg2011.png)
![HiDef png [143 KiB]](Directory_LHCb-PAPER-2014-052/hidef_Bkg2012.png)
![HiDef png [170 KiB]](Directory_LHCb-PAPER-2014-052/hidef_bananaB.png)
Tables and captions
|
Terms entering into the normalisation factors, $\alpha$, and their combined statistical and systematic uncertainties. |
Table_1.pdf [60 KiB] HiDef png [59 KiB] Thumbnail [27 KiB] tex code |

|
|
Expected background candidate yields in the 7 $\mathrm{ Te V}$ data set, with their uncertainties, and observed candidate yields within the $\tau^-$ signal window in the different bins of classifier response. The classifier responses range from $0$ (most background-like) to $+1$ (most signal-like). The first bin in each classifier response is excluded from the analysis. |
Table_2.pdf [30 KiB] HiDef png [206 KiB] Thumbnail [100 KiB] tex code |

|
|
Expected background candidate yields in the 8 $\mathrm{ Te V}$ data set, with their uncertainties, and observed candidate yields within the $\tau^-$ signal window in the different bins of classifier response. The classifier responses range from $0$ (most background-like) to $+1$ (most signal-like). The first bin in each classifier response is excluded from the analysis. |
Table_3.pdf [30 KiB] HiDef png [226 KiB] Thumbnail [112 KiB] tex code |

|
![HiDef png [59 KiB]](Directory_LHCb-PAPER-2014-052/hidef_Table_1.png)
![HiDef png [206 KiB]](Directory_LHCb-PAPER-2014-052/hidef_Table_2.png)
![HiDef png [226 KiB]](Directory_LHCb-PAPER-2014-052/hidef_Table_3.png)
Supplementary Material [file]
| Supplementary material full pdf |
supple[..].pdf [272 KiB] |

|
|
This zip file contains supplementary material for the publication LHCb-PAPER-2014-052. The files included are: Supplementary.pdf: The appendix from the paper, including the figures with captions and some brief explanation. *pdf, *eps, *png, *C: The figures |
Fig1.pdf [26 KiB] HiDef png [212 KiB] Thumbnail [176 KiB] *C file |

|
|
Fig2a.pdf [13 KiB] HiDef png [315 KiB] Thumbnail [183 KiB] *C file |
|
|
|
Fig2b.pdf [13 KiB] HiDef png [336 KiB] Thumbnail [199 KiB] *C file |

|
|
|
Fig3.pdf [14 KiB] HiDef png [149 KiB] Thumbnail [147 KiB] *C file |

|
|
|
Fig4.pdf [16 KiB] HiDef png [253 KiB] Thumbnail [249 KiB] *C file |
|
|
|
Fig5.pdf [22 KiB] HiDef png [309 KiB] Thumbnail [332 KiB] *C file |

|
|
|
Fig6.pdf [15 KiB] HiDef png [161 KiB] Thumbnail [145 KiB] *C file |
|
|
|
Fig7.pdf [27 KiB] HiDef png [441 KiB] Thumbnail [384 KiB] *C file |
|
|
|
Fig8.pdf [20 KiB] HiDef png [249 KiB] Thumbnail [220 KiB] *C file |

|
|
|
Fig9.pdf [20 KiB] HiDef png [207 KiB] Thumbnail [191 KiB] *C file |
|
![HiDef png [212 KiB]](Directory_LHCb-PAPER-2014-052/supplementary/hidef_Fig1.png)
![HiDef png [315 KiB]](Directory_LHCb-PAPER-2014-052/supplementary/hidef_Fig2a.png)
![HiDef png [336 KiB]](Directory_LHCb-PAPER-2014-052/supplementary/hidef_Fig2b.png)
![HiDef png [149 KiB]](Directory_LHCb-PAPER-2014-052/supplementary/hidef_Fig3.png)
![HiDef png [253 KiB]](Directory_LHCb-PAPER-2014-052/supplementary/hidef_Fig4.png)
![HiDef png [309 KiB]](Directory_LHCb-PAPER-2014-052/supplementary/hidef_Fig5.png)
![HiDef png [161 KiB]](Directory_LHCb-PAPER-2014-052/supplementary/hidef_Fig6.png)
![HiDef png [441 KiB]](Directory_LHCb-PAPER-2014-052/supplementary/hidef_Fig7.png)
![HiDef png [249 KiB]](Directory_LHCb-PAPER-2014-052/supplementary/hidef_Fig8.png)
![HiDef png [207 KiB]](Directory_LHCb-PAPER-2014-052/supplementary/hidef_Fig9.png)
Created on 27 April 2024.