Search for $CP$ violation in $D^0\to \pi^-\pi^+\pi^0$ decays with the energy test
[to restricted-access page]Information
LHCb-PAPER-2014-054
CERN-PH-EP-2014-251
arXiv:1410.4170 [PDF]
(Submitted on 15 Oct 2014)
Phys. Lett. B740 (2015) 158
Inspire 1322386
Tools
Abstract
A search for time-integrated CP violation in the Cabibbo-suppressed decay $D^0\to\pi^-\pi^+\pi^0$ is performed using for the first time an unbinned model-independent technique known as the energy test. Using proton-proton collision data, corresponding to an integrated luminosity of 2.0 fb$^{-1}$ collected by the LHCb detector at a centre-of-mass energy of $\sqrt{s}$ = 8 TeV, the world's best sensitivity to CP violation in this decay is obtained. The data are found to be consistent with the hypothesis of CP symmetry with a p-value of (2.6 +/- 0.5).
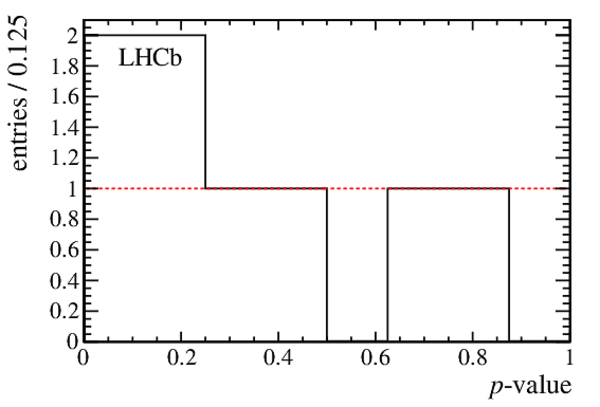
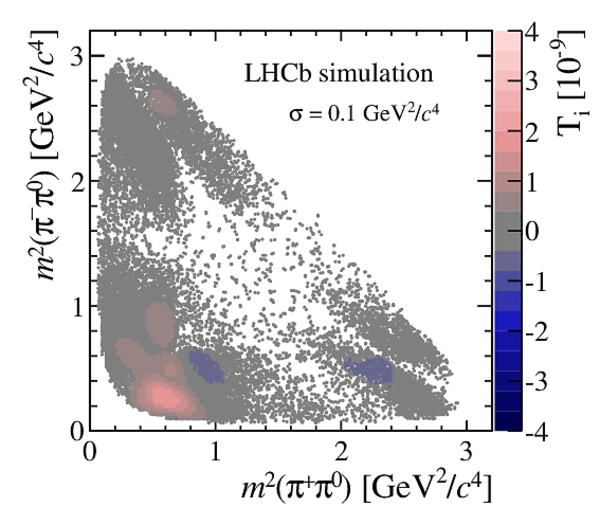
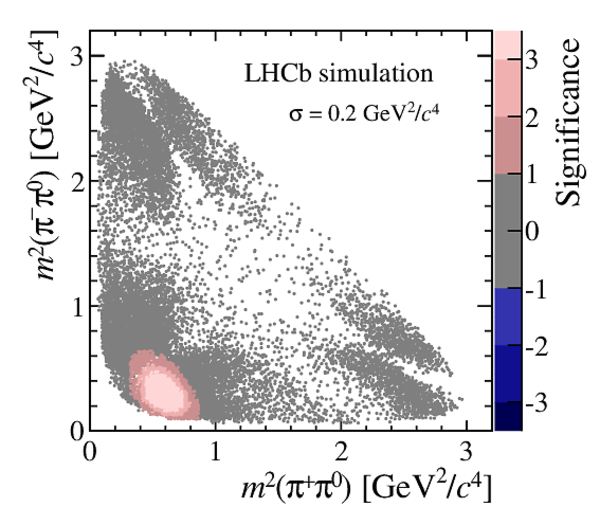
Figures and captions
|
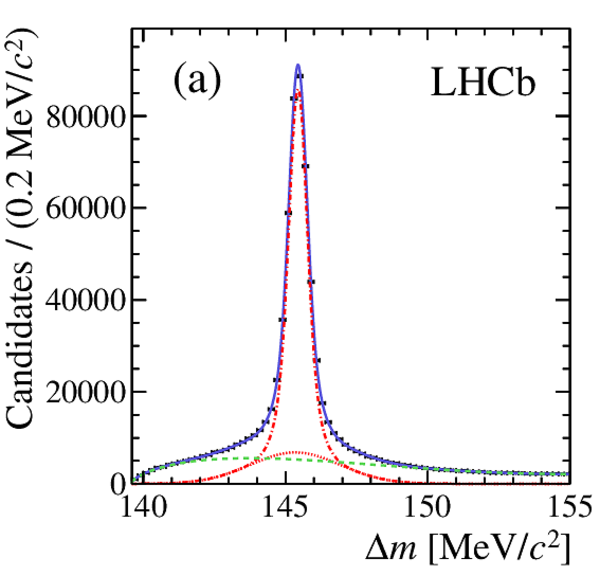
Distribution of $\Delta{}m$ with fit overlaid for the selected data set with (a) resolved and (b) merged $\pi ^0$ candidates. The lines show the fit results for total signal (dot-dashed red), widest Gaussian signal component (dotted red), background (dashed green), and total (solid blue). |
DeltaM[..].pdf [23 KiB] HiDef png [305 KiB] Thumbnail [203 KiB] *.C file |
|
|
DeltaM[..].pdf [23 KiB] HiDef png [301 KiB] Thumbnail [196 KiB] *.C file |

|
|
|
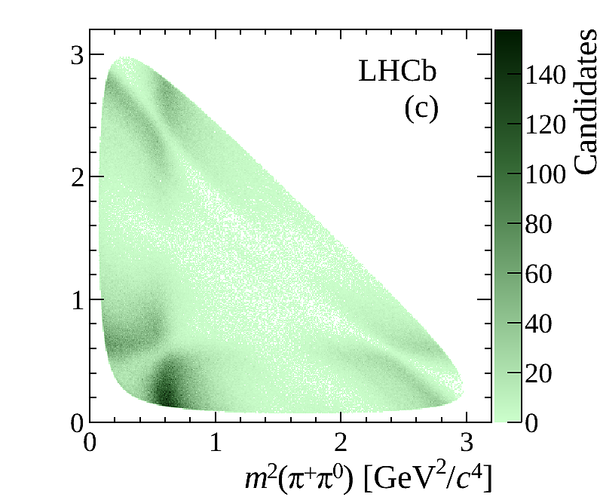
Dalitz plot of the (a) resolved, (b) merged and (c) combined $ D ^0 \rightarrow \pi ^- \pi ^+ \pi ^0 $ data sample. Enhanced event densities in the phase-space corners originate from the $\rho(770)$ resonances. |
Fig2a_.png [113 KiB] HiDef png [476 KiB] Thumbnail [197 KiB] *.C file |

|
|
Fig2b_.png [99 KiB] HiDef png [543 KiB] Thumbnail [219 KiB] *.C file |

|
|
|
Fig2c_.png [132 KiB] HiDef png [480 KiB] Thumbnail [189 KiB] *.C file |
|
|
|
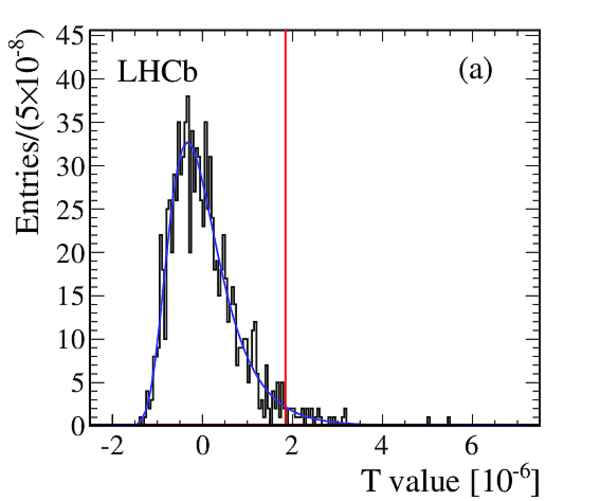
Distribution of permutation $T$ values fitted with a GEV function for the simulated sample and showing the nominal $T$ value as a vertical line for (a) $2\%$ $ C P$ violation in the amplitude and (b) $1^\circ$ phase $ C P$ violation of the $\rho^+$ resonance. |
Fig3_sub1a.pdf [28 KiB] HiDef png [143 KiB] Thumbnail [123 KiB] *.C file |

|
|
Fig3_sub1b.pdf [28 KiB] HiDef png [147 KiB] Thumbnail [120 KiB] *.C file |

|
|
|
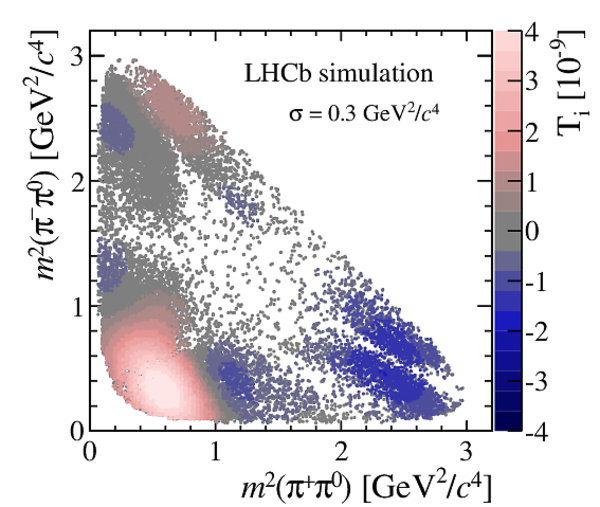
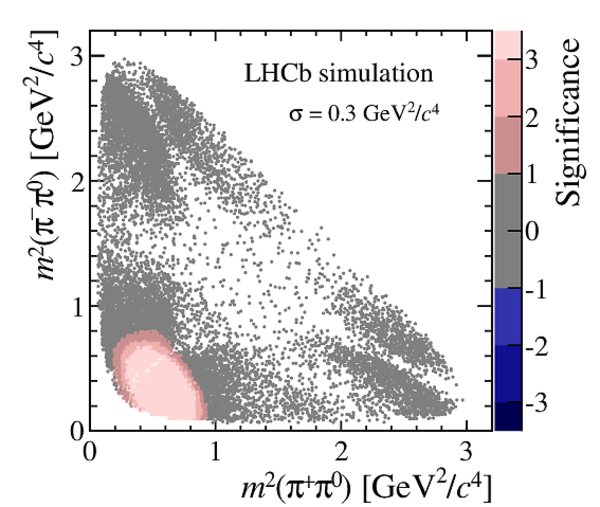
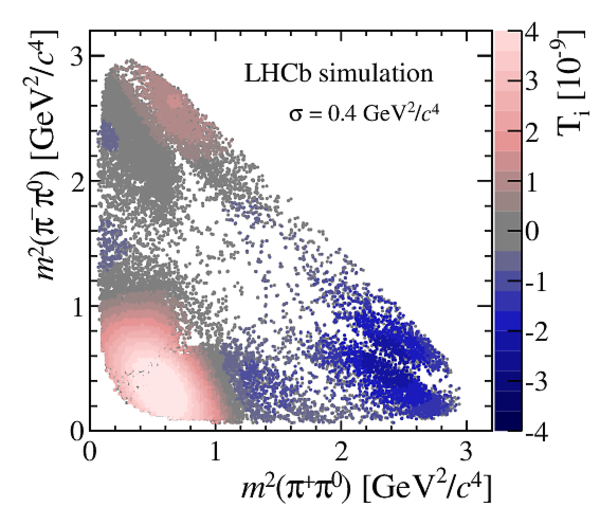
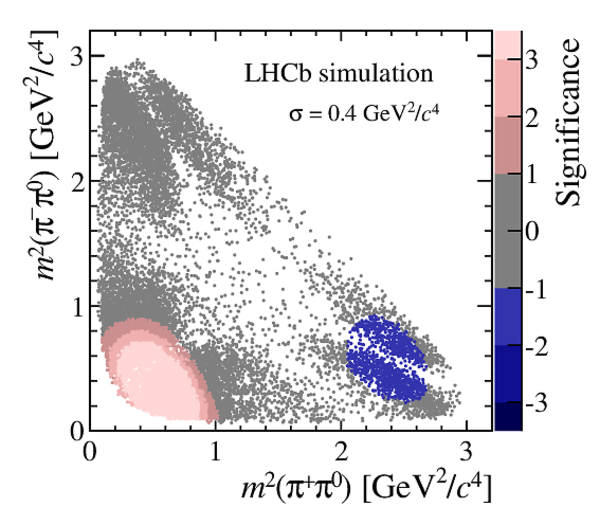
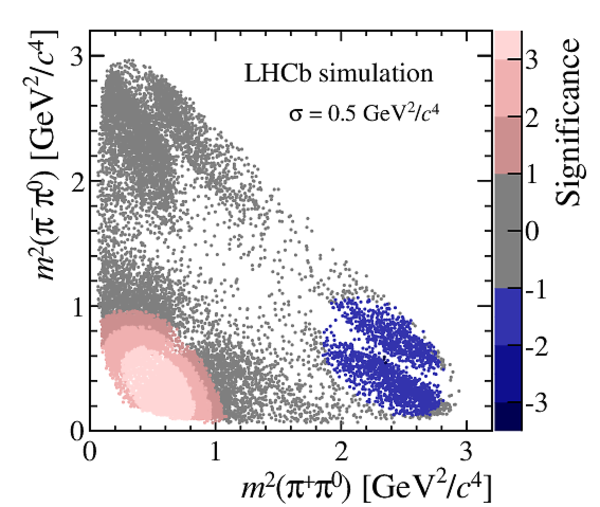
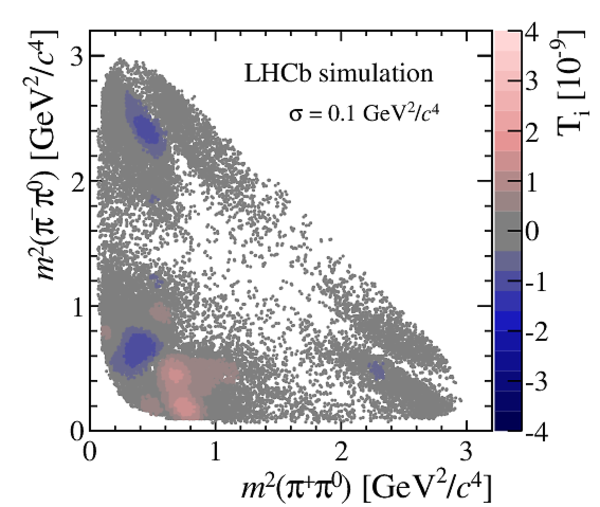
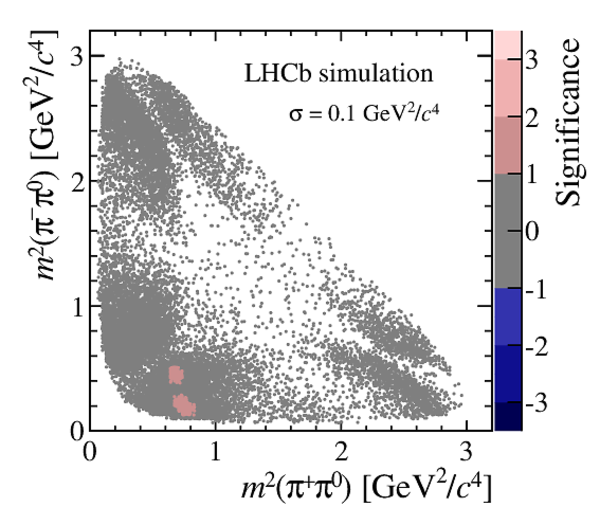
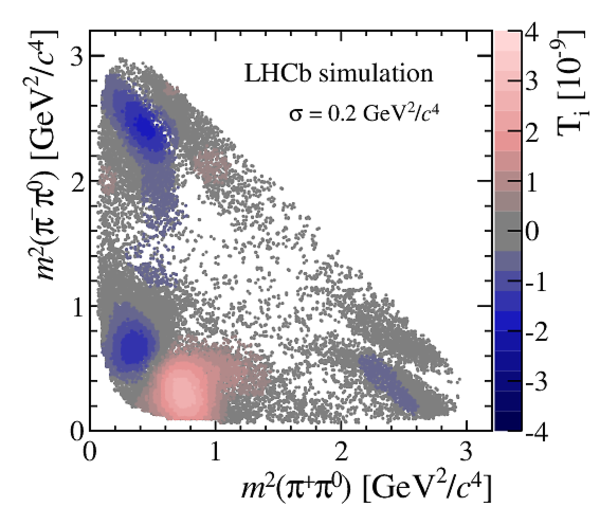
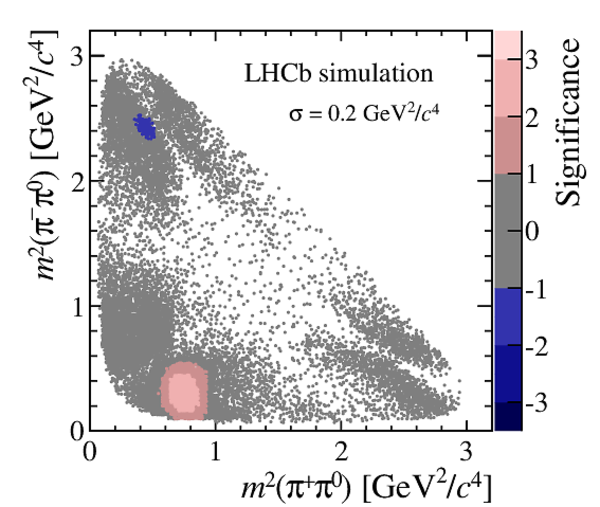
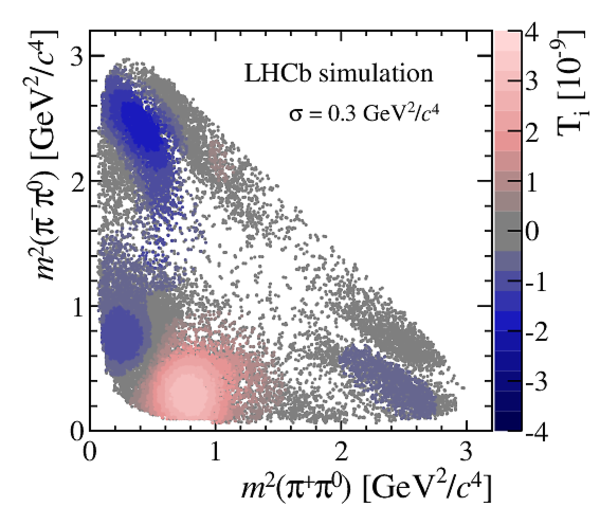
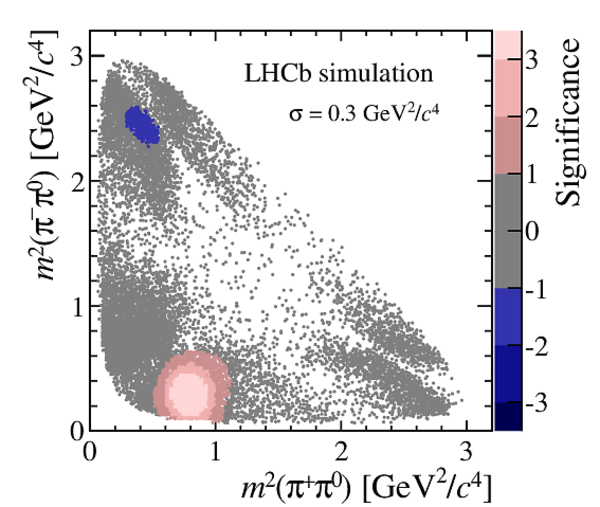
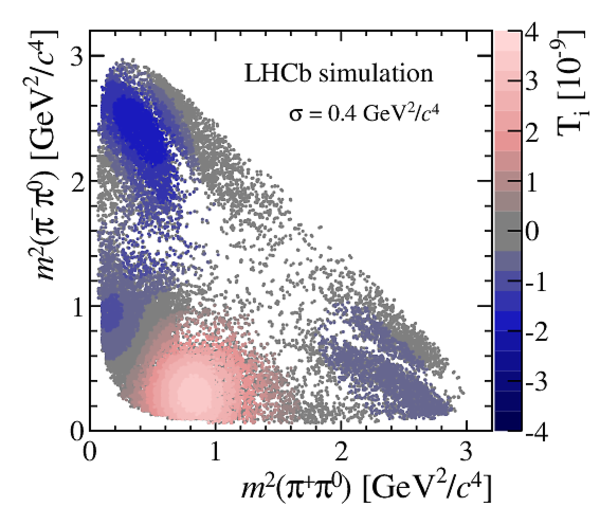
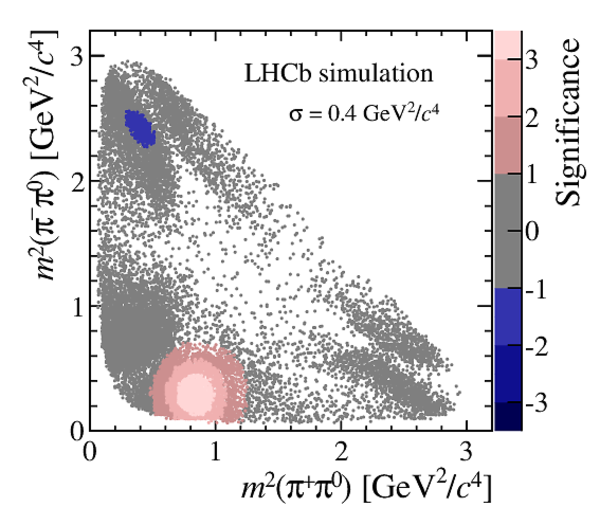
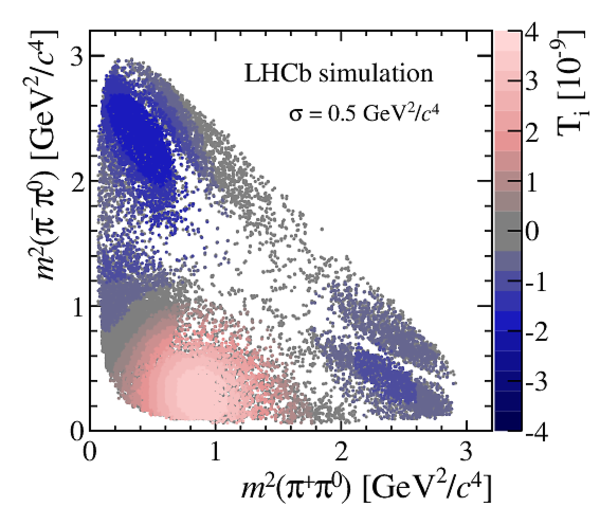
(a,c) $T_i$ value distributions, and (b,d) local asymmetry significances for (top) $2\%$ $ C P$ violation in the amplitude and (bottom) $1^\circ$ phase $ C P$ violation of the $\rho^+$ resonance. |
Fig3_sub2a.png [60 KiB] HiDef png [407 KiB] Thumbnail [188 KiB] *.C file |

|
|
Fig3_sub2b.png [47 KiB] HiDef png [300 KiB] Thumbnail [171 KiB] *.C file |

|
|
|
Fig3_sub2c.png [58 KiB] HiDef png [395 KiB] Thumbnail [188 KiB] *.C file |

|
|
|
Fig3_sub2d.png [46 KiB] HiDef png [301 KiB] Thumbnail [171 KiB] *.C file |

|
|
|
The selection efficiency as a function of $m(\pi ^+ \pi ^- )$. The efficiency for the combined sample is fitted with a straight line. |
acceptance.pdf [17 KiB] HiDef png [190 KiB] Thumbnail [191 KiB] *.C file |

|
|
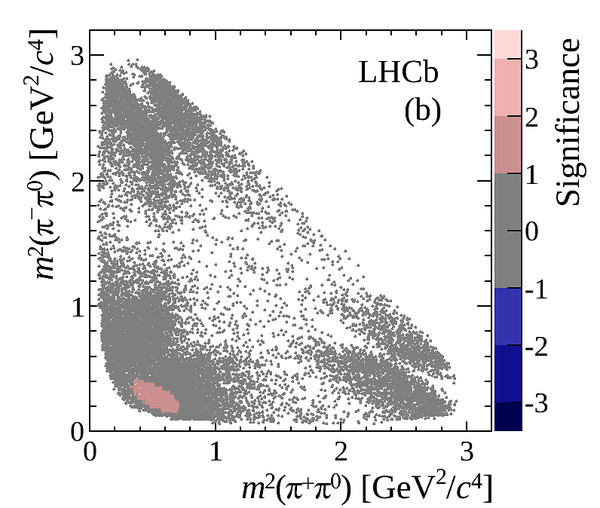
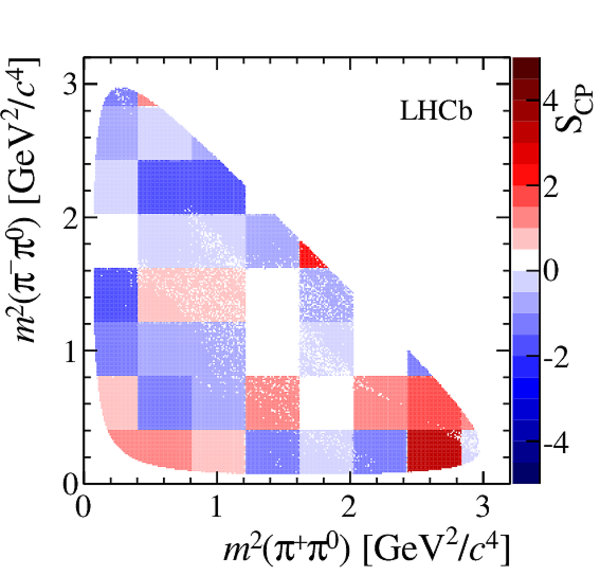
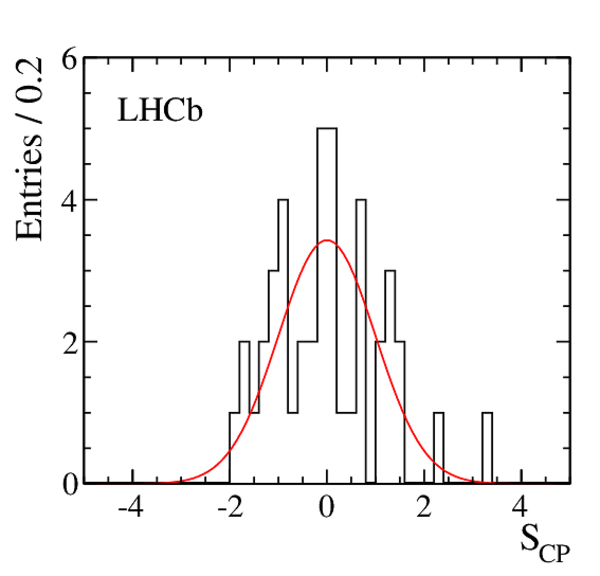
(a) Permutation $T$ value distribution showing the fit function and the measured $T$ value as a red line. (b) Visualisation of local asymmetry significances. The positive (negative) asymmetry significance is set for the $ D ^0$ candidates having positive (negative) contribution to the measured $T$ value, respectively (see Sec.4). |
Fig5a_.pdf [29 KiB] HiDef png [173 KiB] Thumbnail [143 KiB] *.C file |
|
|
SigLev[..].png [38 KiB] HiDef png [304 KiB] Thumbnail [179 KiB] *.C file |
|
|
|
Animated gif made out of all figures. |
PAPER-2014-054.gif Thumbnail |

|
Tables and captions
|
Overview of sensitivities to various $ C P$ violation scenarios. $\Delta A$ and $\Delta \phi$ denote, respectively, change in amplitude and phase of the resonance $R$. |
Table_1.pdf [53 KiB] HiDef png [108 KiB] Thumbnail [52 KiB] tex code |

|
|
Results for various metric parameter values. The $ p$ -values are obtained with the counting method. |
Table_2.pdf [42 KiB] HiDef png [65 KiB] Thumbnail [30 KiB] tex code |

|
Supplementary Material [file]


![HiDef png [305 KiB]](Directory_LHCb-PAPER-2014-054/hidef_DeltaMfit_resolved_paper1.png)
![HiDef png [301 KiB]](Directory_LHCb-PAPER-2014-054/hidef_DeltaMfit_merged_paper1.png)
![Fig2a_.png [113 KiB]](Directory_LHCb-PAPER-2014-054/Fig2a_.png)
![HiDef png [476 KiB]](Directory_LHCb-PAPER-2014-054/hidef_Fig2a_.png)
![Fig2b_.png [99 KiB]](Directory_LHCb-PAPER-2014-054/Fig2b_.png)
![HiDef png [543 KiB]](Directory_LHCb-PAPER-2014-054/hidef_Fig2b_.png)
![Fig2c_.png [132 KiB]](Directory_LHCb-PAPER-2014-054/Fig2c_.png)
![HiDef png [480 KiB]](Directory_LHCb-PAPER-2014-054/hidef_Fig2c_.png)
![HiDef png [143 KiB]](Directory_LHCb-PAPER-2014-054/hidef_Fig3_sub1a.png)
![HiDef png [147 KiB]](Directory_LHCb-PAPER-2014-054/hidef_Fig3_sub1b.png)
![Fig3_sub2a.png [60 KiB]](Directory_LHCb-PAPER-2014-054/Fig3_sub2a.png)
![HiDef png [407 KiB]](Directory_LHCb-PAPER-2014-054/hidef_Fig3_sub2a.png)
![Fig3_sub2b.png [47 KiB]](Directory_LHCb-PAPER-2014-054/Fig3_sub2b.png)
![HiDef png [300 KiB]](Directory_LHCb-PAPER-2014-054/hidef_Fig3_sub2b.png)
![Fig3_sub2c.png [58 KiB]](Directory_LHCb-PAPER-2014-054/Fig3_sub2c.png)
![HiDef png [395 KiB]](Directory_LHCb-PAPER-2014-054/hidef_Fig3_sub2c.png)
![Fig3_sub2d.png [46 KiB]](Directory_LHCb-PAPER-2014-054/Fig3_sub2d.png)
![HiDef png [301 KiB]](Directory_LHCb-PAPER-2014-054/hidef_Fig3_sub2d.png)
![HiDef png [190 KiB]](Directory_LHCb-PAPER-2014-054/hidef_acceptance.png)
![HiDef png [173 KiB]](Directory_LHCb-PAPER-2014-054/hidef_Fig5a_.png)
![SigLev[..].png [38 KiB]](Directory_LHCb-PAPER-2014-054/SigLevel_Ti_lhcb_bw_square_pipipi0_s03_b.png)
![HiDef png [304 KiB]](Directory_LHCb-PAPER-2014-054/hidef_SigLevel_Ti_lhcb_bw_square_pipipi0_s03_b.png)
![HiDef png [108 KiB]](Directory_LHCb-PAPER-2014-054/hidef_Table_1.png)
![HiDef png [65 KiB]](Directory_LHCb-PAPER-2014-054/hidef_Table_2.png)
![HiDef png [103 KiB]](Directory_LHCb-PAPER-2014-054/supplementary/hidef_Fig6.png)
![HiDef png [589 KiB]](Directory_LHCb-PAPER-2014-054/supplementary/hidef_Fig7a.png)
![HiDef png [562 KiB]](Directory_LHCb-PAPER-2014-054/supplementary/hidef_Fig7b.png)
![HiDef png [824 KiB]](Directory_LHCb-PAPER-2014-054/supplementary/hidef_Fig7c.png)
![HiDef png [583 KiB]](Directory_LHCb-PAPER-2014-054/supplementary/hidef_Fig7d.png)
![HiDef png [951 KiB]](Directory_LHCb-PAPER-2014-054/supplementary/hidef_Fig7e.png)
![HiDef png [601 KiB]](Directory_LHCb-PAPER-2014-054/supplementary/hidef_Fig7f.png)
![HiDef png [992 KiB]](Directory_LHCb-PAPER-2014-054/supplementary/hidef_Fig7g.png)
![HiDef png [640 KiB]](Directory_LHCb-PAPER-2014-054/supplementary/hidef_Fig7h.png)
![HiDef png [1009 KiB]](Directory_LHCb-PAPER-2014-054/supplementary/hidef_Fig7i.png)
![HiDef png [678 KiB]](Directory_LHCb-PAPER-2014-054/supplementary/hidef_Fig7j.png)
![HiDef png [602 KiB]](Directory_LHCb-PAPER-2014-054/supplementary/hidef_Fig8a.png)
![HiDef png [562 KiB]](Directory_LHCb-PAPER-2014-054/supplementary/hidef_Fig8b.png)
![HiDef png [777 KiB]](Directory_LHCb-PAPER-2014-054/supplementary/hidef_Fig8c.png)
![HiDef png [579 KiB]](Directory_LHCb-PAPER-2014-054/supplementary/hidef_Fig8d.png)
![HiDef png [907 KiB]](Directory_LHCb-PAPER-2014-054/supplementary/hidef_Fig8e.png)
![HiDef png [598 KiB]](Directory_LHCb-PAPER-2014-054/supplementary/hidef_Fig8f.png)
![HiDef png [984 KiB]](Directory_LHCb-PAPER-2014-054/supplementary/hidef_Fig8g.png)
![HiDef png [616 KiB]](Directory_LHCb-PAPER-2014-054/supplementary/hidef_Fig8h.png)
![HiDef png [1 MiB]](Directory_LHCb-PAPER-2014-054/supplementary/hidef_Fig8i.png)
![HiDef png [616 KiB]](Directory_LHCb-PAPER-2014-054/supplementary/hidef_Fig8j.png)
![HiDef png [1 MiB]](Directory_LHCb-PAPER-2014-054/supplementary/hidef_Fig9a.png)
![HiDef png [116 KiB]](Directory_LHCb-PAPER-2014-054/supplementary/hidef_Fig9b.png)
Created on 27 April 2024.