Measurement of the lifetime of the $B_c^+$ meson using the $B_c^+ \rightarrow J/\psi\pi^+$ decay mode
[to restricted-access page]Information
LHCb-PAPER-2014-060
CERN-PH-EP-2014-283
arXiv:1411.6899 [PDF]
(Submitted on 25 Nov 2014)
Phys. Lett. B742 (2015) 39
Inspire 1329958
Tools
Abstract
The difference in total widths between the $B_c^+$ and $B^+$ mesons is measured using 3.0fb$^{-1}$ of data collected by the LHCb experiment in 7 and 8 TeV centre-of-mass energy proton-proton collisions at the LHC. Through the study of the time evolution of $B_c^+ \rightarrow J/\psi \pi^+$ and $B^+\rightarrow J/\psi K^+$ decays, the width difference is measured to be $$ \Delta\Gamma \equiv \Gamma_{B_c^+} - \Gamma_{B^+} = 4.46 \pm 0.14 \pm 0.07mm^{-1}c,$$ where the first uncertainty is statistical and the second systematic. The known lifetime of the $B^+$ meson is used to convert this to a precise measurement of the $B_c^+$ lifetime, $$\tau_{B_c^+} = 513.4 \pm 11.0 \pm 5.7fs,$$ where the first uncertainty is statistical and the second systematic.
Figures and captions
|
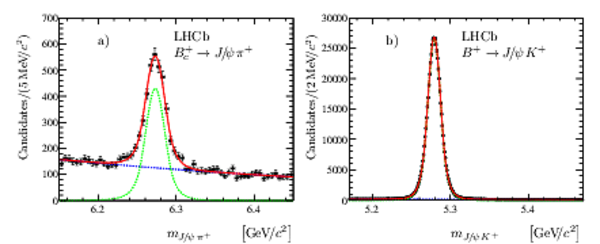
Invariant mass distributions for (a) selected $ B _ c ^+ \rightarrow { J \mskip -3mu/\mskip -2mu\psi \mskip 2mu} \pi ^+ $ and (b) $ B ^+ \rightarrow { J \mskip -3mu/\mskip -2mu\psi \mskip 2mu} K ^+ $ candidates. The fit result with the function described in the text is shown by the red solid line; the signal (background) components are shown with green (blue) dotted (dashed) lines. |
Fig_1.pdf [143 KiB] HiDef png [210 KiB] Thumbnail [165 KiB] *.C file tex code |
|
|
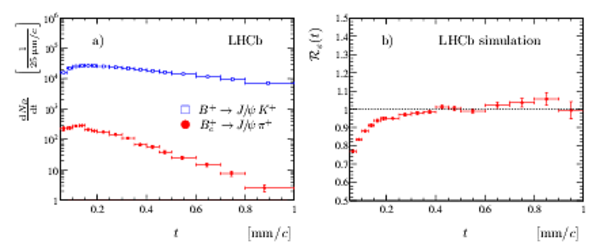
(a) Decay time distributions for selected $ B _ c ^+ \rightarrow { J \mskip -3mu/\mskip -2mu\psi \mskip 2mu} \pi ^+ $ (red solid circles) and $ B ^+ \rightarrow { J \mskip -3mu/\mskip -2mu\psi \mskip 2mu} K ^+ $ (blue open squares) decays, with the data points positioned within the $t$ bins according to Eq. (6) in Ref. [63]; (b) ratio of acceptance functions $\mathcal{R}_{\varepsilon}(ct)$. The uncertainties are due to sample size only. For visualization purposes the efficiency ratio is normalized as $\mathcal{R}_{\varepsilon}(0.5\rm mm /{\mathit{c}})=1$. |
Fig_2.pdf [131 KiB] HiDef png [134 KiB] Thumbnail [131 KiB] *.C file tex code |
|
|
Ratio of the efficiency-corrected decay time distributions (points with error bars). The curve shows the result of the fit with an exponential function. The data points are positioned within the $t$ bins according to Eq. (6) in Ref. [63]. |
Fig_3.pdf [51 KiB] HiDef png [121 KiB] Thumbnail [117 KiB] *.C file tex code |

|
|
Animated gif made out of all figures. |
PAPER-2014-060.gif Thumbnail |

|
![HiDef png [210 KiB]](Directory_LHCb-PAPER-2014-060/hidef_Fig_1.png)
![HiDef png [134 KiB]](Directory_LHCb-PAPER-2014-060/hidef_Fig_2.png)
![HiDef png [121 KiB]](Directory_LHCb-PAPER-2014-060/hidef_Fig_3.png)
Tables and captions
|
Summary of systematic uncertainties for $\Delta\Gamma$. |
Table_1.pdf [62 KiB] HiDef png [78 KiB] Thumbnail [36 KiB] tex code |

|
![HiDef png [78 KiB]](Directory_LHCb-PAPER-2014-060/hidef_Table_1.png)
Created on 26 April 2024.