Angular analysis of the $B^0 \rightarrow K^{*0} e^+ e^-$ decay in the low-$q^2$ region
[to restricted-access page]Information
LHCb-PAPER-2014-066
CERN-PH-EP-2014-301
arXiv:1501.03038 [PDF]
(Submitted on 13 Jan 2015)
JHEP 04 (2015) 064
Inspire 1338587
Tools
Abstract
An angular analysis of the $B^0 \rightarrow K^{*0} e^+ e^-$ decay is performed using a data sample, corresponding to an integrated luminosity of 3.0 ${ fb^{-1}}$, collected by the LHCb experiment in $pp$ collisions at centre-of-mass energies of 7 and 8 TeV during 2011 and 2012. For the first time several observables are measured in the dielectron mass squared ($q^2$) interval between 0.002 and 1.120${\mathrm{ Ge V^2 /}c^4}$. The angular observables $F_{\mathrm{L}}$ and $A_{\mathrm{T}}^{\mathrm{Re}}$ which are related to the $K^{*0}$ polarisation and to the lepton forward-backward asymmetry, are measured to be $F_{\mathrm{L}}= 0.16 \pm 0.06 \pm0.03$ and $A_{\mathrm{T}}^{\mathrm{Re}} = 0.10 \pm 0.18 \pm 0.05$, where the first uncertainty is statistical and the second systematic. The angular observables $A_{\mathrm{T}}^{(2)}$ and $A_{\mathrm{T}}^{\mathrm{Im}}$ which are sensitive to the photon polarisation in this $q^2$ range, are found to be $A_{\mathrm{T}}^{(2)} = -0.23 \pm 0.23 \pm 0.05$ and $A_{\mathrm{T}}^{\mathrm{Im}} =0.14 \pm 0.22 \pm 0.05$. The results are consistent with Standard Model predictions.
Figures and captions
|
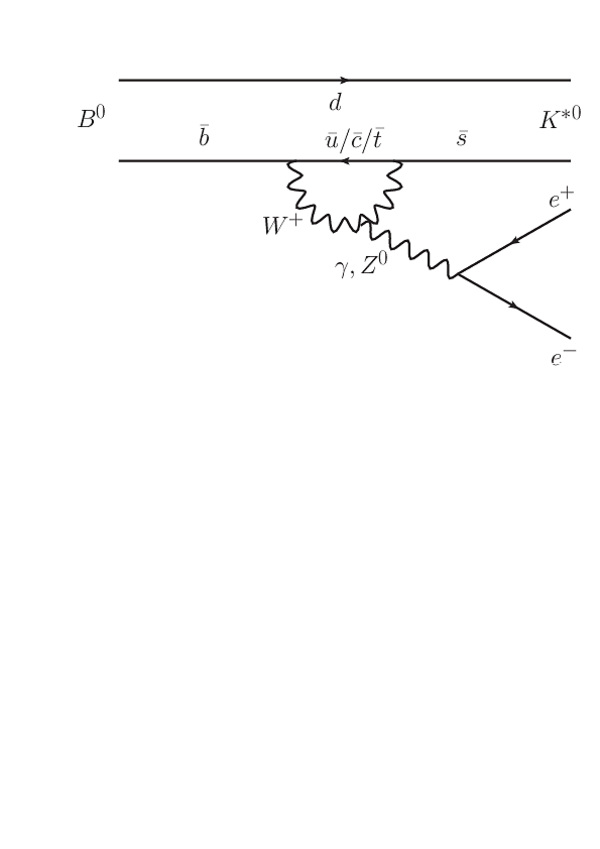
Dominant Standard Model Feynman graphs for the electroweak loop and box diagrams involved in the $ B ^0 \rightarrow K ^{*0} e ^+ e ^- $ decay. |
Fig1a.pdf [15 KiB] HiDef png [139 KiB] Thumbnail [60 KiB] *.C file |
|
|
Fig1b.pdf [15 KiB] HiDef png [143 KiB] Thumbnail [62 KiB] *.C file |

|
|
|
Fig1c.pdf [14 KiB] HiDef png [138 KiB] Thumbnail [59 KiB] *.C file |

|
|
|
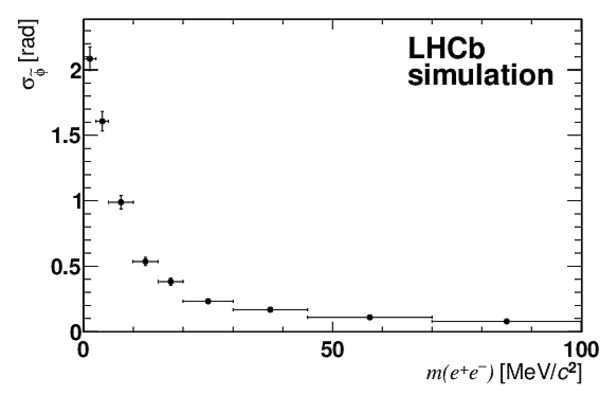
Resolution on the $\tilde\phi$ angle as a function of the $ e ^+ e ^-$ invariant mass as obtained from LHCb simulated events. |
Fig2.pdf [14 KiB] HiDef png [55 KiB] Thumbnail [34 KiB] *.C file |
|
|
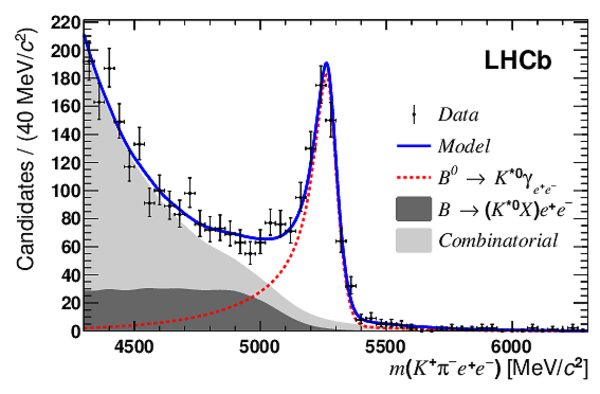
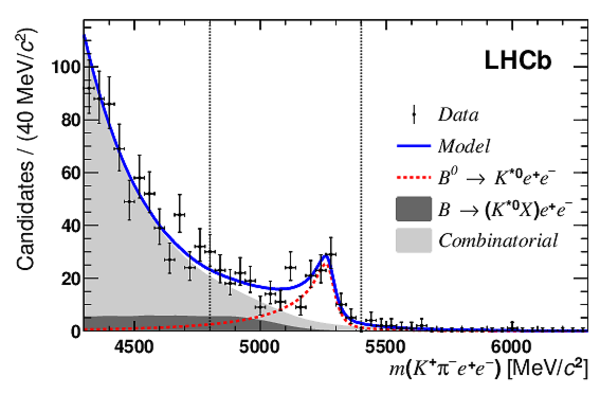
Invariant mass distribution for (a) the $ B ^0 \rightarrow K ^{*0} \gamma _{ e ^+ e ^- }$ and (b) the $ B ^0 \rightarrow K ^{*0} e ^+ e ^- $ decay modes and the three trigger categories grouped together. The dashed line is the signal PDF, the light grey area corresponds to the combinatorial background and the dark grey area is the PR background. The solid line is the total PDF. The two vertical dotted lines on the $ B ^0 \rightarrow K ^{*0} e ^+ e ^- $ plot indicate the signal window that is used in the angular fit. |
Fig3a.pdf [22 KiB] HiDef png [278 KiB] Thumbnail [234 KiB] *.C file |
|
|
Fig3b.pdf [21 KiB] HiDef png [250 KiB] Thumbnail [215 KiB] *.C file |
|
|
|
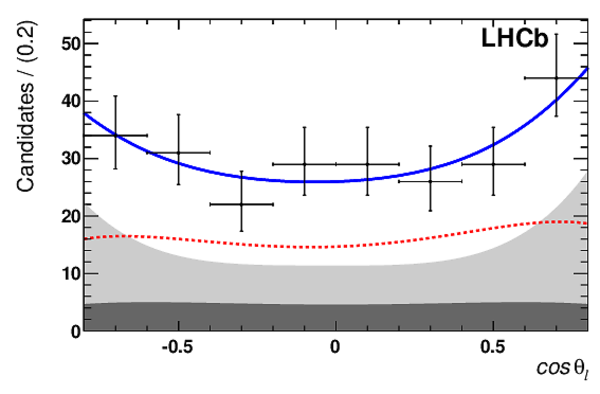
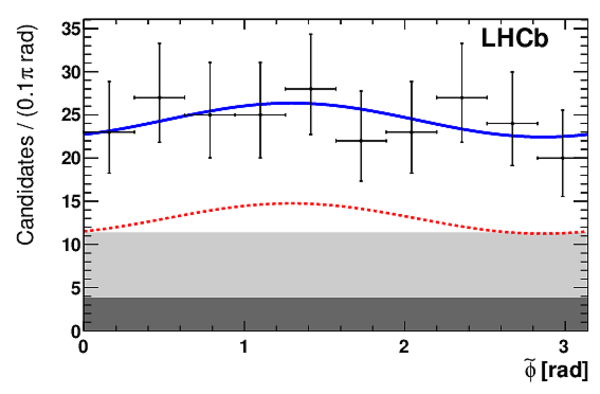
Distributions of the $K^+\pi^- e ^+ e ^- $ invariant mass, $\cos{\theta_\ell}$ , $\cos{\theta_K}$ and $\tilde\phi$ variables for the $ B ^0 \rightarrow K ^{*0} e ^+ e ^- $ decay mode and the three trigger categories grouped together. The dashed line is the signal PDF, the light grey area corresponds to the combinatorial background, the dark grey area is the PR background. The solid line is the total PDF. |
Fig4a.pdf [17 KiB] HiDef png [237 KiB] Thumbnail [205 KiB] *.C file |

|
|
Fig4b.pdf [15 KiB] HiDef png [141 KiB] Thumbnail [120 KiB] *.C file |
|
|
|
Fig4c.pdf [15 KiB] HiDef png [156 KiB] Thumbnail [136 KiB] *.C file |

|
|
|
Fig4d.pdf [15 KiB] HiDef png [130 KiB] Thumbnail [115 KiB] *.C file |
|
|
|
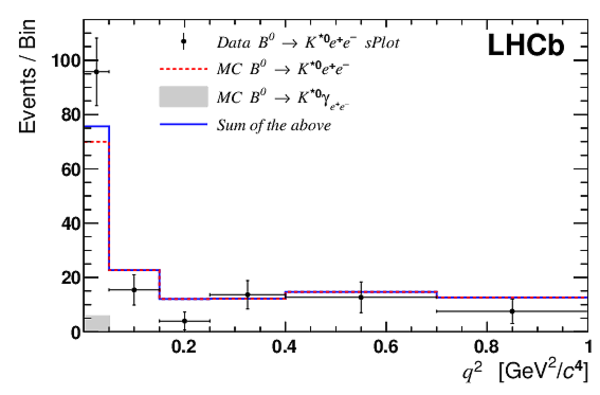
Distribution of the reconstructed $ q^2$ from an sPlot of data (black points). The dashed line represents the $ B ^0 \rightarrow K ^{*0} e ^+ e ^- $ contribution and the grey area corresponds to the $3.8\%$ $ B ^0 \rightarrow K ^{*0} \gamma _{ e ^+ e ^- }$ contamination. The solid line is the sum of the two. |
Fig5.pdf [14 KiB] HiDef png [136 KiB] Thumbnail [124 KiB] *.C file |
|
|
Animated gif made out of all figures. |
PAPER-2014-066.gif Thumbnail |

|
![HiDef png [139 KiB]](Directory_LHCb-PAPER-2014-066/hidef_Fig1a.png)
![HiDef png [143 KiB]](Directory_LHCb-PAPER-2014-066/hidef_Fig1b.png)
![HiDef png [138 KiB]](Directory_LHCb-PAPER-2014-066/hidef_Fig1c.png)
![HiDef png [55 KiB]](Directory_LHCb-PAPER-2014-066/hidef_Fig2.png)
![HiDef png [278 KiB]](Directory_LHCb-PAPER-2014-066/hidef_Fig3a.png)
![HiDef png [250 KiB]](Directory_LHCb-PAPER-2014-066/hidef_Fig3b.png)
![HiDef png [237 KiB]](Directory_LHCb-PAPER-2014-066/hidef_Fig4a.png)
![HiDef png [141 KiB]](Directory_LHCb-PAPER-2014-066/hidef_Fig4b.png)
![HiDef png [156 KiB]](Directory_LHCb-PAPER-2014-066/hidef_Fig4c.png)
![HiDef png [130 KiB]](Directory_LHCb-PAPER-2014-066/hidef_Fig4d.png)
![HiDef png [136 KiB]](Directory_LHCb-PAPER-2014-066/hidef_Fig5.png)
Tables and captions
|
Fit results for the angular observables $ F_{\mathrm{L}}$ , $ A_{\mathrm{T}}^{(2)}$ , $ A_{\mathrm{T}}^{\mathrm{Im}}$ and $ A_{\mathrm{T}}^{\mathrm{Re}}$ . The second column corresponds to the uncorrected values directly obtained from the fit while the third column gives the final results after the correction for the $(3.8 \pm 1.9)$% of $ B ^0 \rightarrow K ^{*0} \gamma _{ e ^+ e ^- }$ contamination and for the small fit biases due to the limited size of the data sample. The first uncertainty is statistical and the second systematic. |
Table_1.pdf [38 KiB] HiDef png [65 KiB] Thumbnail [32 KiB] tex code |

|
|
Summary of the systematic uncertainties. |
Table_2.pdf [50 KiB] HiDef png [88 KiB] Thumbnail [40 KiB] tex code |

|
![HiDef png [65 KiB]](Directory_LHCb-PAPER-2014-066/hidef_Table_1.png)
![HiDef png [88 KiB]](Directory_LHCb-PAPER-2014-066/hidef_Table_2.png)
Created on 27 April 2024.