Precise measurements of the properties of the $B_1(5721)^{0,+}$ and $B^\ast_2(5747)^{0,+}$ states and observation of $B^{+,0}\pi^{-,+}$ mass structures
[to restricted-access page]Information
LHCb-PAPER-2014-067
CERN-PH-EP-2015-021
arXiv:1502.02638 [PDF]
(Submitted on 09 Feb 2015)
JHEP 04 (2015) 024
Inspire 1343514
Tools
Abstract
Invariant mass distributions of B+pi- and B0pi+ combinations are investigated in order to study excited B mesons. The analysis is based on a data sample corresponding to 3.0 fb-1 of pp collision data, recorded by the LHCb detector at centre-of-mass energies of 7 and 8 TeV. Precise measurements of the masses and widths of the B_1(5721)^(0,+) and B_2*(5747)^(0,+) states are reported. Clear enhancements, particularly prominent at high pion transverse momentum, are seen over background in the mass range 5850--6000 MeV in both B+pi- and B0pi+ combinations. The structures are consistent with the presence of four excited B mesons, labelled B_J(5840)^(0,+) and B_J(5960)^(0,+), whose masses and widths are obtained under different hypotheses for their quantum numbers.
Figures and captions
|
Mass predictions of the excited $ B $ states [10,3,4,5,6,7,8,9]. The boxes cover the range of predictions for the masses of each state, and the red dots indicate the measured values. The horizontal lines correspond to the $B\pi$ (red) and $B^*\pi$ (blue) thresholds. |
Fig1.pdf [18 KiB] HiDef png [482 KiB] Thumbnail [485 KiB] *.C file |

|
|
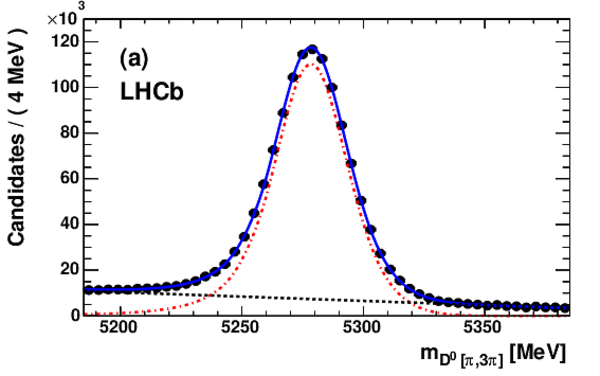
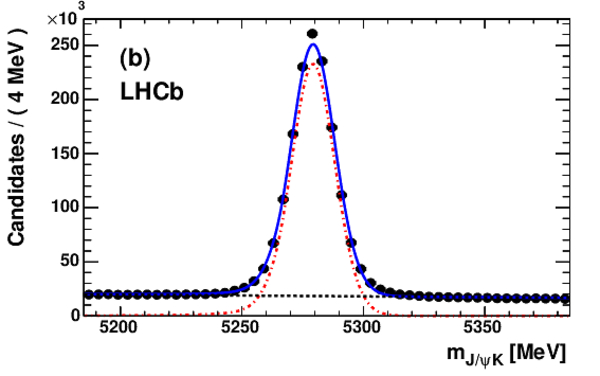
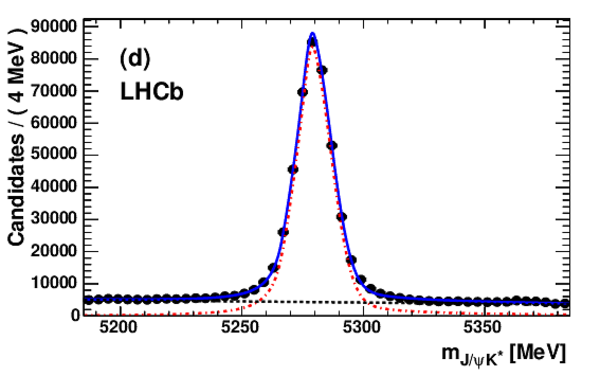
Mass distributions of the $ B ^+$ and $ B ^0$ candidates reconstructed through (a) $ B ^+ \rightarrow \overline{ D }{} ^0 (\pi^+,\pi^+\pi^+\pi^-)$, (b) $ B ^+ \rightarrow J/\psi K^+$, (c) $ B ^0 \rightarrow D ^- (\pi^+,\pi^+\pi^+\pi^-)$, and (d) $ B ^0 \rightarrow J/\psi K ^{*0} $ decays. The $ { J \mskip -3mu/\mskip -2mu\psi \mskip 2mu}$ , $\overline{ D }{} ^0$ and $ D ^-$ masses are constrained to their world average values [2]. Results of fits are superimposed for illustration. The signal (dot-dashed red line) is modelled with a double Crystal Ball [41] distribution, while the background (dashed black line) is modelled with\ a second-order polynomial. The total fit is shown as a solid blue line. |
Fig2a.pdf [23 KiB] HiDef png [177 KiB] Thumbnail [151 KiB] *.C file |
|
|
Fig2b.pdf [22 KiB] HiDef png [175 KiB] Thumbnail [145 KiB] *.C file |
|
|
|
Fig2c.pdf [23 KiB] HiDef png [204 KiB] Thumbnail [179 KiB] *.C file |

|
|
|
Fig2d.pdf [23 KiB] HiDef png [204 KiB] Thumbnail [176 KiB] *.C file |
|
|
|
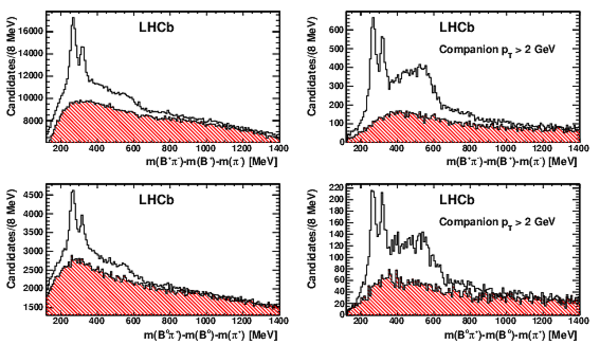
Distributions of the $Q$ values of the $ B ^{**}$ candidates after the selection for the (top) $ B ^+ $ and (bottom) $ B ^0 $ candidates. The white histograms represent the RS combinations, while the overlaid shaded red histograms represent the WS combinations. The right hand plots are made after applying an additional requirement of $ p_{\rm T} >2 \mathrm{ Ge V} $ on the companion pion. |
Fig3.pdf [33 KiB] HiDef png [681 KiB] Thumbnail [393 KiB] *.C file |
|
|
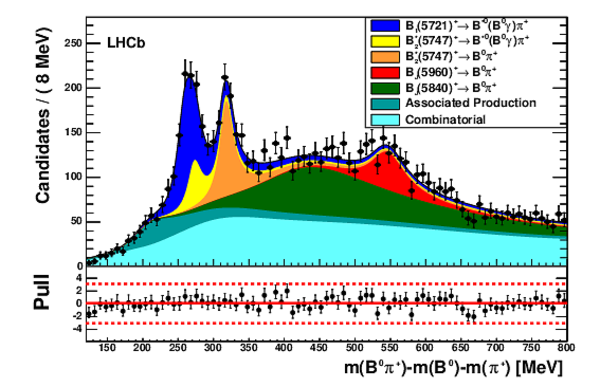
Result of the fits to the $Q$-value distributions for (top) $ B ^+ \pi ^- $ and (bottom) $ B ^0 \pi ^+ $ candidates. The components are labelled in the legend. The normalised residuals (pulls) of the difference between the fit results and the data points, divided by their uncertainties, are shown underneath each plot. |
Fig4a.pdf [106 KiB] HiDef png [354 KiB] Thumbnail [286 KiB] *.C file |

|
|
Fig4b.pdf [105 KiB] HiDef png [342 KiB] Thumbnail [273 KiB] *.C file |

|
|
|
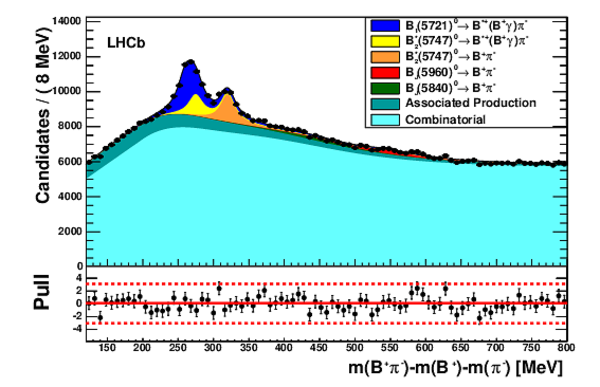
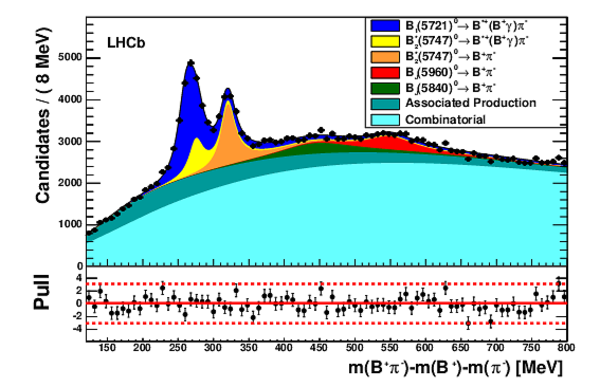
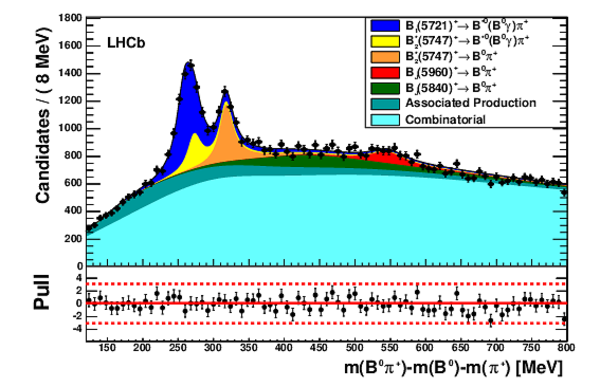
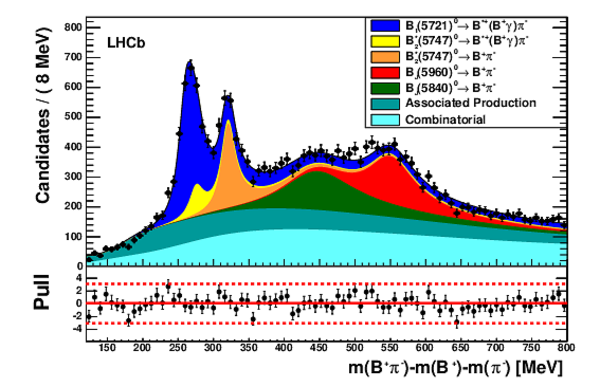
Result of the fit to (left) $ B ^+ \pi ^- $ and (right) $ B ^0 \pi ^+ $ candidates, split into (top to bottom) low, medium and high $p_{\rm T}$ bins, with ranges as labelled on the plots. The components are labelled in the legends. The fit pulls are shown underneath each plot. |
Fig5a.pdf [64 KiB] HiDef png [327 KiB] Thumbnail [262 KiB] *.C file |
|
|
Fig5b.pdf [65 KiB] HiDef png [337 KiB] Thumbnail [269 KiB] *.C file |

|
|
|
Fig5c.pdf [66 KiB] HiDef png [350 KiB] Thumbnail [276 KiB] *.C file |
|
|
|
Fig5d.pdf [66 KiB] HiDef png [365 KiB] Thumbnail [284 KiB] *.C file |
|
|
|
Fig5e.pdf [67 KiB] HiDef png [392 KiB] Thumbnail [302 KiB] *.C file |
|
|
|
Fig5f.pdf [66 KiB] HiDef png [398 KiB] Thumbnail [304 KiB] *.C file |
|
|
|
Animated gif made out of all figures. |
PAPER-2014-067.gif Thumbnail |

|
![HiDef png [482 KiB]](Directory_LHCb-PAPER-2014-067/hidef_Fig1.png)
![HiDef png [177 KiB]](Directory_LHCb-PAPER-2014-067/hidef_Fig2a.png)
![HiDef png [175 KiB]](Directory_LHCb-PAPER-2014-067/hidef_Fig2b.png)
![HiDef png [204 KiB]](Directory_LHCb-PAPER-2014-067/hidef_Fig2c.png)
![HiDef png [204 KiB]](Directory_LHCb-PAPER-2014-067/hidef_Fig2d.png)
![HiDef png [681 KiB]](Directory_LHCb-PAPER-2014-067/hidef_Fig3.png)
![HiDef png [354 KiB]](Directory_LHCb-PAPER-2014-067/hidef_Fig4a.png)
![HiDef png [342 KiB]](Directory_LHCb-PAPER-2014-067/hidef_Fig4b.png)
![HiDef png [327 KiB]](Directory_LHCb-PAPER-2014-067/hidef_Fig5a.png)
![HiDef png [337 KiB]](Directory_LHCb-PAPER-2014-067/hidef_Fig5b.png)
![HiDef png [350 KiB]](Directory_LHCb-PAPER-2014-067/hidef_Fig5c.png)
![HiDef png [365 KiB]](Directory_LHCb-PAPER-2014-067/hidef_Fig5d.png)
![HiDef png [392 KiB]](Directory_LHCb-PAPER-2014-067/hidef_Fig5e.png)
![HiDef png [398 KiB]](Directory_LHCb-PAPER-2014-067/hidef_Fig5f.png)
Tables and captions
|
Allowed decay modes for the excited $ B $ states. |
Table_1.pdf [42 KiB] HiDef png [43 KiB] Thumbnail [19 KiB] tex code |

|
|
Results of the fits when two RBW functions are used for the $B_J(5840)^{0,+}$ and $B_J(5960)^{0,+}$ states (empirical model). The mean $\mu$ of each peak is given together with the width $\Gamma$ and the yield $N_{\textrm{state}}$. The parameters related to the AP and WS components are suppressed for brevity. All uncertainties are statistical only. Units of $\mathrm{ Me V}$ for $\mu$ and $\Gamma$ are implied. |
Table_2.pdf [77 KiB] HiDef png [172 KiB] Thumbnail [81 KiB] tex code |

|
|
Results of the fits when the natural spin-parity hypothesis is assigned to (top quadruplet) the $B_J(5840)^{0,+}$ state or (bottom quadruplet) the $B_J(5960)^{0,+}$ state, so that three RBW shapes are used to model the broad resonances in the fit. The mean $\mu$ of each peak is given together with the width $\Gamma$. All uncertainties are statistical only. Units of $\mathrm{ Me V}$ for $\mu$ and $\Gamma$ are implied. |
Table_3.pdf [49 KiB] HiDef png [155 KiB] Thumbnail [75 KiB] tex code |

|
|
Systematic uncertainties on the results of the fit to the $ B ^+ \pi ^- $ candidates. Units of $\mathrm{ Me V}$ for $\mu$ and $\Gamma$ are implied. |
Table_4.pdf [58 KiB] HiDef png [194 KiB] Thumbnail [88 KiB] tex code |

|
|
Systematic uncertainties on the results of the fit to the $ B ^0 \pi ^+ $ candidates. Units of $\mathrm{ Me V}$ for $\mu$ and $\Gamma$ are implied. |
Table_5.pdf [58 KiB] HiDef png [191 KiB] Thumbnail [83 KiB] tex code |

|
|
Parameters of the $B_J(5840)^{0,+}$ and $B_J(5960)^{0,+}$ states obtained with different fit models. The empirical fit uses two, and the quark model fits three, RBW shapes to model the broad resonances. The listed uncertainties are, from left to right: the statistical uncertainty, the experimental systematic uncertainty, and, where applicable, the uncertainty on the $ B $ meson mass and the uncertainty on the $ B ^{*} -B$ mass difference. Note that any state not explicitly labelled as "natural" is considered to have unnatural spin-parity (and not to be $0^+$); the reported mass can be converted into the corresponding result under the $0^+$ spin-parity assumption by subtracting the $ B ^{*} -B$ mass difference. Units of $\mathrm{ Me V}$ are implied. |
Table_6.pdf [61 KiB] HiDef png [217 KiB] Thumbnail [110 KiB] tex code |

|
|
Statistical (top) and systematic (bottom) covariance matrices of the nominal $ B ^+ \pi ^- $ fit, where $\mu$ and $\Gamma$ stand for the mean and width respectively. The parameters related to the AP and WS shapes and the signal yields are suppressed for brevity. Units of $\mathrm{ Me V}$ for $\mu$ and $\Gamma$ are implied. |
Table_7.pdf [50 KiB] HiDef png [105 KiB] Thumbnail [48 KiB] tex code |

|
|
Statistical (top) and systematic (bottom) covariance matrices of the nominal $ B ^0 \pi ^+ $ fit, where $\mu$ and $\Gamma$ stand for the mean and width respectively. The parameters related to the AP and WS shapes and the signal yields are suppressed for brevity. Units of $\mathrm{ Me V}$ for $\mu$ and $\Gamma$ are implied. |
Table_8.pdf [50 KiB] HiDef png [106 KiB] Thumbnail [48 KiB] tex code |

|
![HiDef png [43 KiB]](Directory_LHCb-PAPER-2014-067/hidef_Table_1.png)
![HiDef png [172 KiB]](Directory_LHCb-PAPER-2014-067/hidef_Table_2.png)
![HiDef png [155 KiB]](Directory_LHCb-PAPER-2014-067/hidef_Table_3.png)
![HiDef png [194 KiB]](Directory_LHCb-PAPER-2014-067/hidef_Table_4.png)
![HiDef png [191 KiB]](Directory_LHCb-PAPER-2014-067/hidef_Table_5.png)
![HiDef png [217 KiB]](Directory_LHCb-PAPER-2014-067/hidef_Table_6.png)
![HiDef png [105 KiB]](Directory_LHCb-PAPER-2014-067/hidef_Table_7.png)
![HiDef png [106 KiB]](Directory_LHCb-PAPER-2014-067/hidef_Table_8.png)
Supplementary Material [file]
| Supplementary material full pdf |
supple[..].pdf [225 KiB] |
|
|
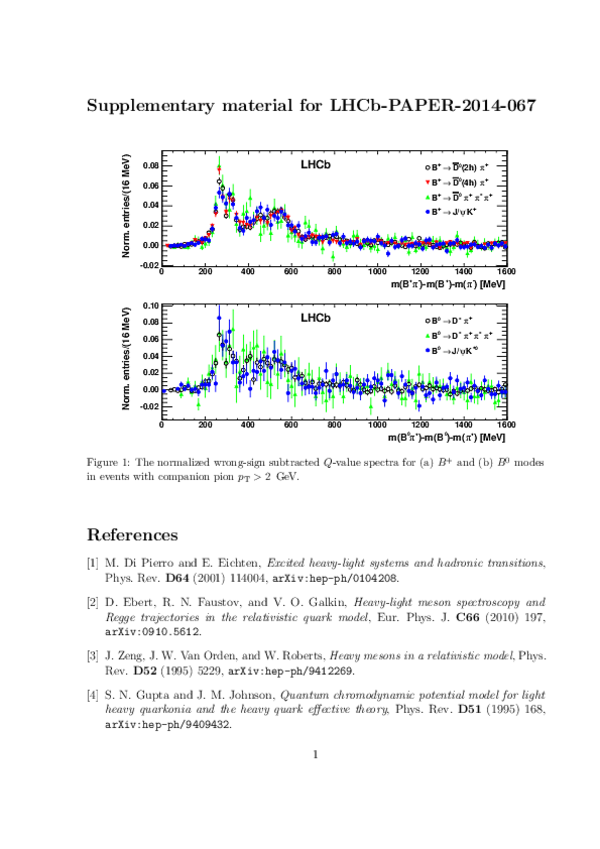
This ZIP file contains supplemetary material for the publication LHCb-PAPER-2014-067. The files are: Supplementary.pdf : An overview of the extra figures *.pdf, *.png, *.eps, *.C : The figures in variuous formats |
Fig6.pdf [57 KiB] HiDef png [456 KiB] Thumbnail [322 KiB] *C file |

|
|
Fig7.pdf [21 KiB] HiDef png [578 KiB] Thumbnail [528 KiB] *C file |

|
|
|
Fig8.pdf [21 KiB] HiDef png [624 KiB] Thumbnail [542 KiB] *C file |

|
|
|
Fig9.pdf [21 KiB] HiDef png [597 KiB] Thumbnail [537 KiB] *C file |

|
![HiDef png [456 KiB]](Directory_LHCb-PAPER-2014-067/supplementary/hidef_Fig6.png)
![HiDef png [578 KiB]](Directory_LHCb-PAPER-2014-067/supplementary/hidef_Fig7.png)
![HiDef png [624 KiB]](Directory_LHCb-PAPER-2014-067/supplementary/hidef_Fig8.png)
![HiDef png [597 KiB]](Directory_LHCb-PAPER-2014-067/supplementary/hidef_Fig9.png)
Created on 26 April 2024.