Measurement of the forward $Z$ boson production cross-section in $pp$ collisions at $\sqrt{s}$ = 7 TeV
[to restricted-access page]Information
LHCb-PAPER-2015-001
CERN-PH-EP-2015-102
arXiv:1505.07024 [PDF]
(Submitted on 26 May 2015)
JHEP 08 (2015) 039
Inspire 1373300
Tools
Abstract
A measurement of the production cross-section for $Z$ bosons that decay to muons is presented. The data were recorded by the LHCb detector during $pp$ collisions at a centre-of-mass energy of 7 TeV, and correspond to an integrated luminosity of 1.0 fb$^{-1}$. The cross-section is measured for muons in the pseudorapidity range $2.0 < \eta < 4.5$ with transverse momenta $p_{T} > 20$ GeV/c. The dimuon mass is restricted to $60 < M_{\mu^{+}\mu^{-}} < 120$ GeV/c$^{2}$. The measured cross-section is $$\sigma_{Z\rightarrow\mu^{+}\mu^{-}} = (76.0 \pm 0.3 \pm 0.5 \pm 1.0 \pm 1.3) \text{pb}$$ where the uncertainties are due to the sample size, systematic effects, the beam energy and the luminosity. This result is in good agreement with theoretical predictions at next-to-next-to-leading order in perturbative quantum chromodynamics. The cross-section is also measured differentially as a function of kinematic variables of the $Z$ boson. Ratios of the production cross-sections of electroweak bosons are presented using updated LHCb measurements of $W$ boson production. A precise test of the Standard Model is provided by the measurement of the ratio $$\frac{\sigma_{W^{+}\rightarrow\mu^{+}\nu_{\mu}} + \sigma_{W^{-}\rightarrow\mu^{-}\bar{\nu}_{\mu}}}{\sigma_{Z\rightarrow\mu^{+}\mu^{-}}} = 20.63\pm0.09\pm0.12\pm0.05,$$ where the uncertainty due to luminosity cancels.
Figures and captions
|
Invariant mass of dimuon candidates. |
reco_m[..].pdf [18 KiB] HiDef png [140 KiB] Thumbnail [121 KiB] *.C file |

|
|
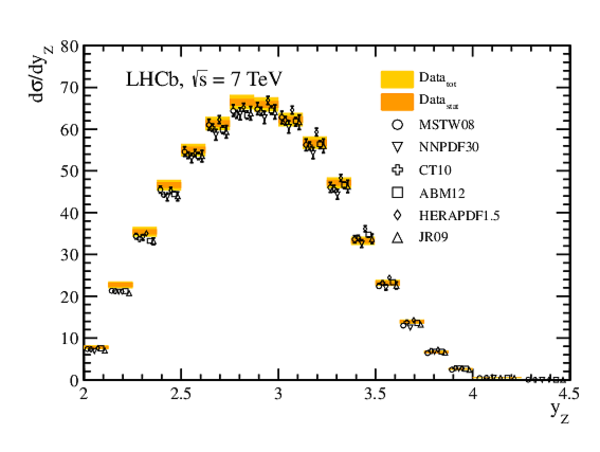
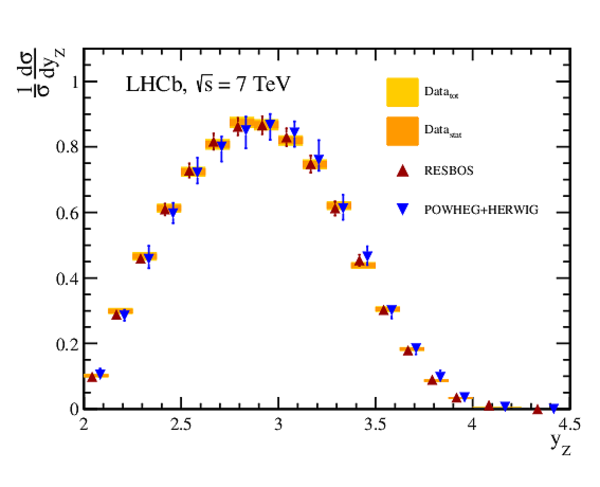
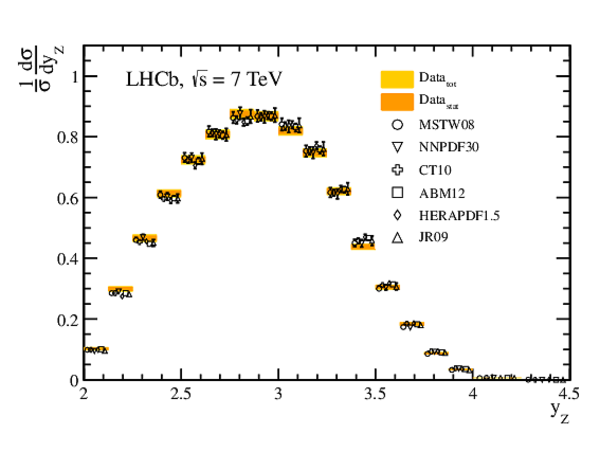
(a) Differential cross-section as a function of $y_{Z}$ compared with the prediction of Fewz configured with various PDF sets. Different predictions are displaced horizontally for visibility. (b) Normalised differential cross-section as a function of $y_{Z}$ compared to the predictions of ResBos and Powheg + Herwig . The shaded (yellow) bands indicate the statistical and total uncertainties on the measurements, which are symmetric about the central value. |
diff_x[..].pdf [19 KiB] HiDef png [183 KiB] Thumbnail [148 KiB] *.C file |
|
|
diff_x[..].pdf [15 KiB] HiDef png [142 KiB] Thumbnail [117 KiB] *.C file |
|
|
|
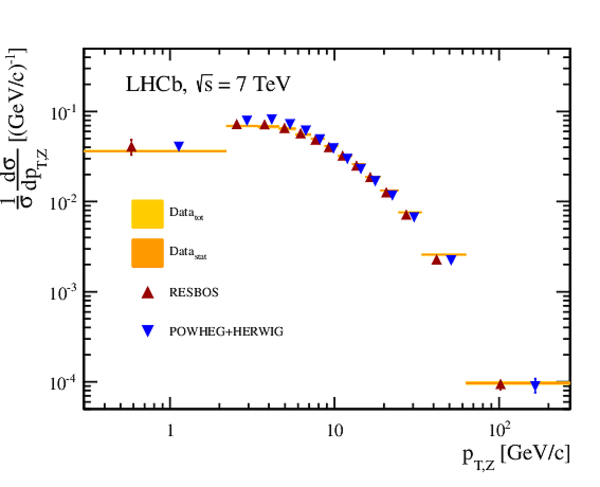
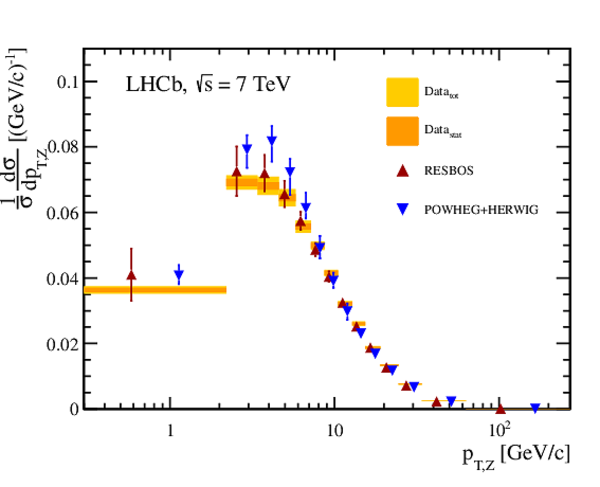
Normalised differential cross-section as a function of $p_{T,Z}$ on (a) logarithmic and (b) linear scales. The shaded (yellow) bands indicate the statistical and total uncertainties on the measurements, which are symmetric about the central value. The measurements are compared to the predictions of ResBos and Powheg + Herwig . |
diff_x[..].pdf [15 KiB] HiDef png [126 KiB] Thumbnail [116 KiB] *.C file |
|
|
diff_x[..].pdf [15 KiB] HiDef png [142 KiB] Thumbnail [123 KiB] *.C file |
|
|
|
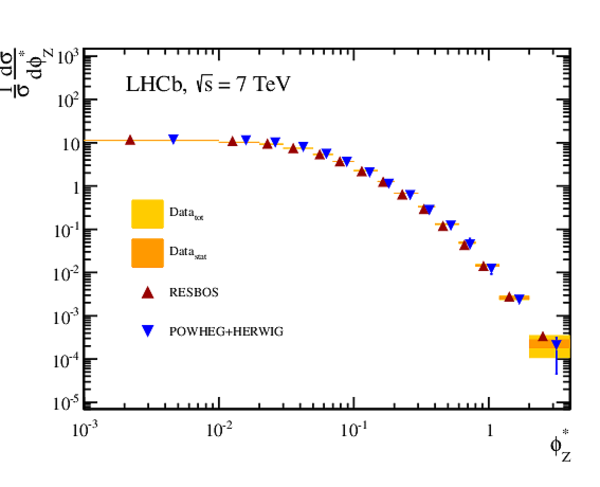
Normalised differential cross-section as a function of $\phi^{*}_{Z}$ on (a) logarithmic and (b) linear scales. The shaded (yellow) bands indicate the statistical and total uncertainties on the measurements, which are symmetric about the central value. The measurements are compared to the predictions of ResBos and Powheg + Herwig . |
diff_x[..].pdf [15 KiB] HiDef png [133 KiB] Thumbnail [126 KiB] *.C file |
|
|
diff_x[..].pdf [15 KiB] HiDef png [127 KiB] Thumbnail [112 KiB] *.C file |

|
|
|
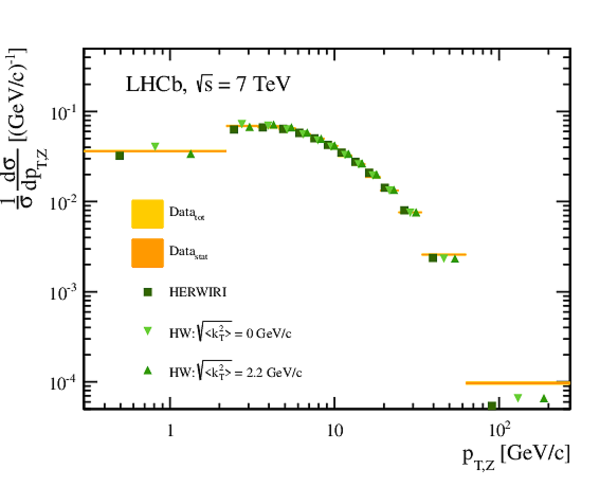
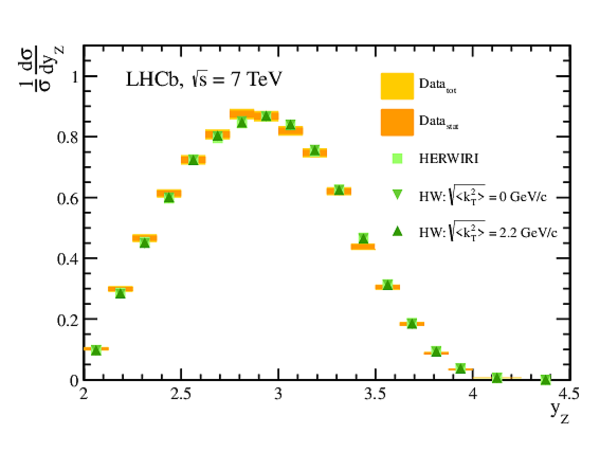
Normalised differential cross-section as a function of $p_{T,Z}$ on (a) logarithmic and (b) linear scales. The shaded (yellow) bands indicate the statistical and total uncertainties on the measurements, which are symmetric about the central value. The measurements are compared to MC@NLO + Herwig (HW) and MC@NLO + Herwiri (HERWIRI). Herwig is configured with two choices of the root mean-square-deviation of the intrinsic $k_{T}$ distribution, 0 and 2.2 $ {\mathrm{ Ge V /}c}$ . |
herwir[..].pdf [15 KiB] HiDef png [140 KiB] Thumbnail [127 KiB] *.C file |
|
|
herwir[..].pdf [15 KiB] HiDef png [148 KiB] Thumbnail [130 KiB] *.C file |

|
|
|
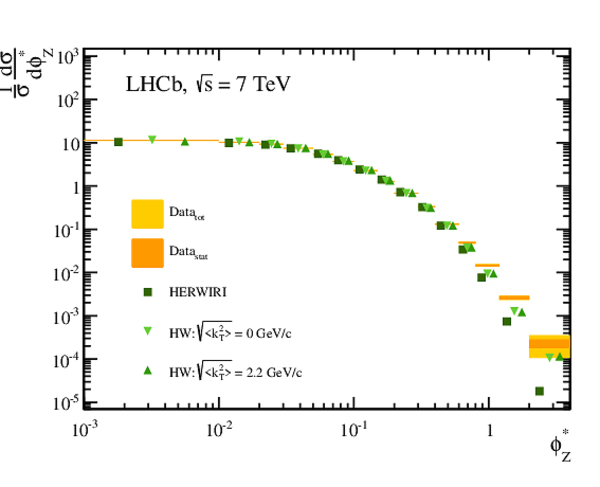
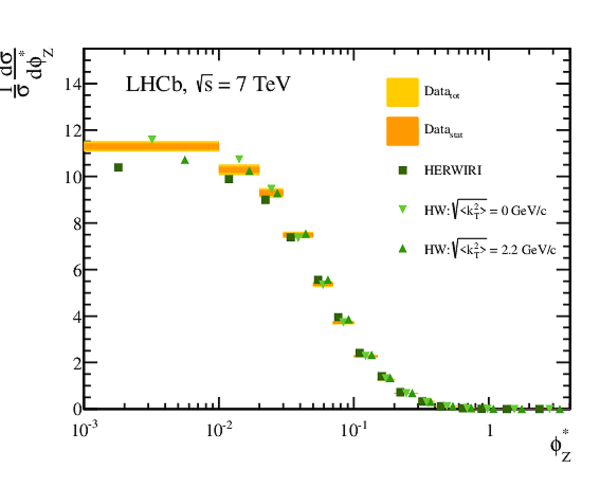
Normalised differential cross-section as a function of $\phi^{*}_{Z}$ on (a) logarithmic and (b) linear scales. The shaded (yellow) bands indicate the statistical and total uncertainties on the measurements, which are symmetric about the central value. The measurements are compared to MC@NLO + Herwig (HW) and MC@NLO + Herwiri (HERWIRI). Herwig is configured with two choices of the root mean-square-deviation of the intrinsic $k_{T}$ distribution, 0 and 2.2 $ {\mathrm{ Ge V /}c}$ . |
herwir[..].pdf [16 KiB] HiDef png [149 KiB] Thumbnail [139 KiB] *.C file |
|
|
herwir[..].pdf [15 KiB] HiDef png [136 KiB] Thumbnail [121 KiB] *.C file |
|
|
|
LHCb measurements of electroweak boson production cross-sections compared to NNLO pQCD as implemented by the Fewz generator using various PDF sets. The shaded (yellow) bands indicate the statistical and total uncertainties on the measurements, which are symmetric about the central value. |
CSS.pdf [15 KiB] HiDef png [204 KiB] Thumbnail [181 KiB] *.C file |

|
|
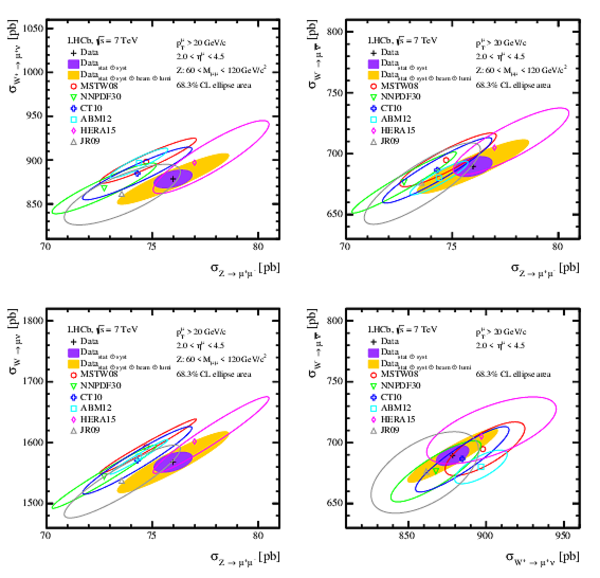
Two dimensional plots of electroweak boson cross-sections compared to NNLO predictions for various parameterisations of the PDFs. The outer, shaded (yellow) ellipse corresponds to the total uncertainty on the measurements. The inner, shaded (purple) ellipse excludes the beam energy and luminosity uncertainties. The uncertainty on the theoretical predictions corresponds to the PDF uncertainty only. All ellipses correspond to uncertainties at 68.3$\%$ confidence level. |
CSE.pdf [222 KiB] HiDef png [533 KiB] Thumbnail [369 KiB] *.C file |
|
|
Ratios of electroweak boson production $R_{\it W^{+}Z}$, $R_{\it W^{-}Z}$, $R_{\it WZ}$, $R_{\it W}$, compared to various theoretical predictions. The shaded (yellow) bands indicate the statistical and total uncertainties on the measurements, which are symmetric about the central value. |
CSSR.pdf [16 KiB] HiDef png [206 KiB] Thumbnail [200 KiB] *.C file |

|
|
Animated gif made out of all figures. |
PAPER-2015-001.gif Thumbnail |

|
![HiDef png [140 KiB]](Directory_LHCb-PAPER-2015-001/hidef_reco_mass_hist_2011.png)
![HiDef png [183 KiB]](Directory_LHCb-PAPER-2015-001/hidef_diff_xsection_y_fewz.png)
![HiDef png [142 KiB]](Directory_LHCb-PAPER-2015-001/hidef_diff_xsection_y_norm.png)
![HiDef png [126 KiB]](Directory_LHCb-PAPER-2015-001/hidef_diff_xsection_pt_norm_high.png)
![HiDef png [142 KiB]](Directory_LHCb-PAPER-2015-001/hidef_diff_xsection_pt_norm_low.png)
![HiDef png [133 KiB]](Directory_LHCb-PAPER-2015-001/hidef_diff_xsection_phi_norm_high.png)
![HiDef png [127 KiB]](Directory_LHCb-PAPER-2015-001/hidef_diff_xsection_phi_norm_low.png)
![HiDef png [140 KiB]](Directory_LHCb-PAPER-2015-001/hidef_herwiri_pt_high.png)
![HiDef png [148 KiB]](Directory_LHCb-PAPER-2015-001/hidef_herwiri_pt_low.png)
![HiDef png [149 KiB]](Directory_LHCb-PAPER-2015-001/hidef_herwiri_phi_high.png)
![HiDef png [136 KiB]](Directory_LHCb-PAPER-2015-001/hidef_herwiri_phi_low.png)
![HiDef png [204 KiB]](Directory_LHCb-PAPER-2015-001/hidef_CSS.png)
![HiDef png [533 KiB]](Directory_LHCb-PAPER-2015-001/hidef_CSE.png)
![HiDef png [206 KiB]](Directory_LHCb-PAPER-2015-001/hidef_CSSR.png)
Tables and captions
|
Contributions to the relative uncertainty on the total $ Z $ boson cross-section. |
Table_1.pdf [26 KiB] HiDef png [117 KiB] Thumbnail [52 KiB] tex code |

|
|
Contributions to the relative uncertainty on the electroweak boson cross-section ratios. |
Table_2.pdf [47 KiB] HiDef png [117 KiB] Thumbnail [56 KiB] tex code |

|
|
Inclusive differential cross-sections for $ Z$ boson production as a function of $y_{Z}$. Uncertainties are due to the sample size, systematic effects, the beam energy and the luminosity. No candidates are observed in the 4.250 -- 4.500 bin. |
Table_3.pdf [43 KiB] HiDef png [229 KiB] Thumbnail [113 KiB] tex code |

|
|
Inclusive differential cross-sections for $ Z$ boson production as a function of $p_{T,Z}$. Uncertainties are due to the sample size, systematic effects, the beam energy and the luminosity. |
Table_4.pdf [44 KiB] HiDef png [189 KiB] Thumbnail [87 KiB] tex code |

|
|
Inclusive differential cross-sections for $ Z$ boson production as a function of $\phi^{*}_{Z}$. Uncertainties are due to the sample size, systematic effects, the beam energy and the luminosity. |
Table_5.pdf [49 KiB] HiDef png [195 KiB] Thumbnail [97 KiB] tex code |

|
|
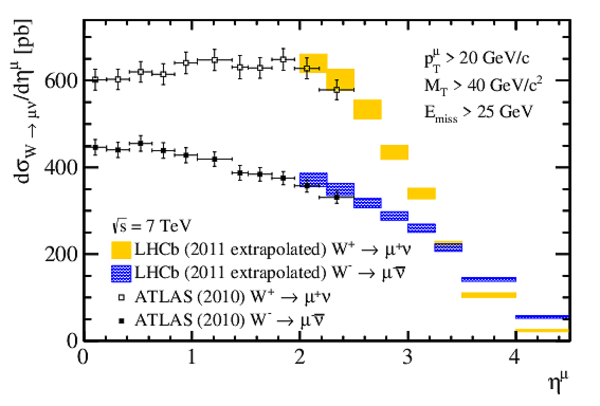
Inclusive differential cross-sections for $ W ^+$ (left) and $ W ^-$ (right) boson production as a function of muon $\eta$. Uncertainties are due to the sample size, systematic effects, the beam energy and the luminosity. These supersede the results in Ref. \cite{wmu}. |
Table_6.pdf [57 KiB] HiDef png [83 KiB] Thumbnail [40 KiB] tex code |

|
|
$ W ^+$ to $ W ^-$ boson production cross-section ratios as a function of muon $\eta$. Uncertainties are due to the sample size, systematic effects and the beam energy. These supersede the results in Ref. \cite{wmu}. |
Table_7.pdf [34 KiB] HiDef png [134 KiB] Thumbnail [68 KiB] tex code |

|
|
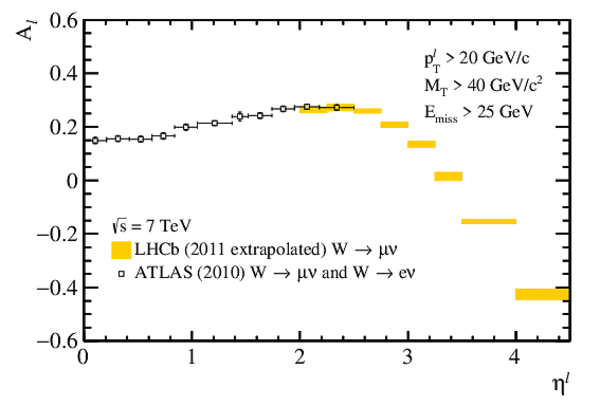
Lepton charge asymmetries as a function of muon $\eta$. Uncertainties are due to the sample size, systematic effects and the beam energy. These supersede the results in Ref. \cite{wmu}. |
Table_8.pdf [34 KiB] HiDef png [140 KiB] Thumbnail [68 KiB] tex code |

|
|
Correlation coefficients of differential cross-section measurements as a function of $y_{Z}$. The beam energy and luminosity uncertainties, which are fully correlated between cross-section measurements, are excluded. |
Table_9.pdf [42 KiB] HiDef png [72 KiB] Thumbnail [26 KiB] tex code |

|
|
Correlation coefficients of differential cross-section measurements as a function of $p_{T,Z}$. The beam energy and luminosity uncertainties, which are fully correlated between cross-section measurements, are excluded. |
Table_10.pdf [37 KiB] HiDef png [73 KiB] Thumbnail [28 KiB] tex code |

|
|
Correlation coefficients of differential cross-section measurements as a function of $\phi^{*}_{Z}$. The beam energy and luminosity uncertainties, which are fully correlated between cross-section measurements, are excluded. |
Table_11.pdf [42 KiB] HiDef png [77 KiB] Thumbnail [27 KiB] tex code |

|
|
Correlation coefficients between differential cross-section measurements as a function of $ W$ boson muon $\eta$. The beam energy and luminosity uncertainties, which are fully correlated between cross-section measurements, are excluded. |
Table_12.pdf [51 KiB] HiDef png [85 KiB] Thumbnail [34 KiB] tex code |

|
|
Correlation coefficients between differential cross-section measurements as a function of $y_{Z}$ and $ W$ boson muon $\eta$. The LHC beam energy and luminosity uncertainties, which are fully correlated between cross-section measurements, are excluded. |
Table_13.pdf [50 KiB] HiDef png [107 KiB] Thumbnail [36 KiB] tex code |

|
![HiDef png [117 KiB]](Directory_LHCb-PAPER-2015-001/hidef_Table_1.png)
![HiDef png [117 KiB]](Directory_LHCb-PAPER-2015-001/hidef_Table_2.png)
![HiDef png [229 KiB]](Directory_LHCb-PAPER-2015-001/hidef_Table_3.png)
![HiDef png [189 KiB]](Directory_LHCb-PAPER-2015-001/hidef_Table_4.png)
![HiDef png [195 KiB]](Directory_LHCb-PAPER-2015-001/hidef_Table_5.png)
![HiDef png [83 KiB]](Directory_LHCb-PAPER-2015-001/hidef_Table_6.png)
![HiDef png [134 KiB]](Directory_LHCb-PAPER-2015-001/hidef_Table_7.png)
![HiDef png [140 KiB]](Directory_LHCb-PAPER-2015-001/hidef_Table_8.png)
![HiDef png [72 KiB]](Directory_LHCb-PAPER-2015-001/hidef_Table_9.png)
![HiDef png [73 KiB]](Directory_LHCb-PAPER-2015-001/hidef_Table_10.png)
![HiDef png [77 KiB]](Directory_LHCb-PAPER-2015-001/hidef_Table_11.png)
![HiDef png [85 KiB]](Directory_LHCb-PAPER-2015-001/hidef_Table_12.png)
![HiDef png [107 KiB]](Directory_LHCb-PAPER-2015-001/hidef_Table_13.png)
Supplementary Material [file]
| Supplementary material full pdf |
supple[..].pdf [266 KiB] |
|
|
This ZIP file contains supplemetary material for the publication LHCb-PAPER-2015-001. The files are: supplementary.pdf : An overview of the extra figures Fig*-S.pdf, Fig*-S.png, Fig*-S.eps, Fig*-S.C : The figures in various formats |
Fig1-S.pdf [13 KiB] HiDef png [120 KiB] Thumbnail [91 KiB] *C file |
|
|
Fig10-S.pdf [14 KiB] HiDef png [102 KiB] Thumbnail [99 KiB] *C file |

|
|
|
Fig2-S.pdf [19 KiB] HiDef png [171 KiB] Thumbnail [130 KiB] *C file |
|
|
|
Fig3-S.pdf [15 KiB] HiDef png [247 KiB] Thumbnail [156 KiB] *C file |

|
|
|
Fig4-S.pdf [15 KiB] HiDef png [142 KiB] Thumbnail [117 KiB] *C file |
|
|
|
Fig5-S.pdf [29 KiB] HiDef png [356 KiB] Thumbnail [240 KiB] *C file |

|
|
|
Fig6-S.pdf [16 KiB] HiDef png [223 KiB] Thumbnail [178 KiB] *C file |
|
|
|
Fig7-S.pdf [21 KiB] HiDef png [198 KiB] Thumbnail [159 KiB] *C file |

|
|
|
Fig8-S.pdf [21 KiB] HiDef png [205 KiB] Thumbnail [169 KiB] *C file |

|
|
|
Fig9-S.pdf [15 KiB] HiDef png [124 KiB] Thumbnail [120 KiB] *C file |
|
![HiDef png [120 KiB]](Directory_LHCb-PAPER-2015-001/supplementary/hidef_Fig1-S.png)
![HiDef png [102 KiB]](Directory_LHCb-PAPER-2015-001/supplementary/hidef_Fig10-S.png)
![HiDef png [171 KiB]](Directory_LHCb-PAPER-2015-001/supplementary/hidef_Fig2-S.png)
![HiDef png [247 KiB]](Directory_LHCb-PAPER-2015-001/supplementary/hidef_Fig3-S.png)
![HiDef png [142 KiB]](Directory_LHCb-PAPER-2015-001/supplementary/hidef_Fig4-S.png)
![HiDef png [356 KiB]](Directory_LHCb-PAPER-2015-001/supplementary/hidef_Fig5-S.png)
![HiDef png [223 KiB]](Directory_LHCb-PAPER-2015-001/supplementary/hidef_Fig6-S.png)
![HiDef png [198 KiB]](Directory_LHCb-PAPER-2015-001/supplementary/hidef_Fig7-S.png)
![HiDef png [205 KiB]](Directory_LHCb-PAPER-2015-001/supplementary/hidef_Fig8-S.png)
![HiDef png [124 KiB]](Directory_LHCb-PAPER-2015-001/supplementary/hidef_Fig9-S.png)
Created on 27 April 2024.