Measurement of forward $\rm Z\rightarrow e^+e^-$ production at $\sqrt{s}=8$ TeV
[to restricted-access page]Information
LHCb-PAPER-2015-003
CERN-PH-EP-2015-045
arXiv:1503.00963 [PDF]
(Submitted on 03 Mar 2015)
JHEP 05 (2015) 109
Inspire 1347133
Tools
Abstract
A measurement of the cross-section for Z-boson production in the forward region of pp collisions at 8TeV centre-of-mass energy is presented. The measurement is based on a sample of $\rm Z\rightarrow e^+e^-$ decays reconstructed using the LHCb detector, corresponding to an integrated luminosity of 2.0fb$^{-1}$. The acceptance is defined by the requirements $2.0<\eta<4.5$ and $p_{\rm T}>20$GeV for the pseudorapidities and transverse momenta of the leptons. Their invariant mass is required to lie in the range 60--120GeV. The cross-section is determined to be $$ \sigma({\rm pp\to Z\to e^+e^-})=93.81\pm0.41({\rm stat})\pm1.48({\rm syst})\pm1.14({\rm lumi})\;{\rm pb} ,$$ where the first uncertainty is statistical and the second reflects all systematic effects apart from that arising from the luminosity, which is given as the third uncertainty. Differential cross-sections are presented as functions of the Z-boson rapidity and of the angular variable $\phi^*$, which is related to the Z-boson transverse momentum.
Figures and captions
|
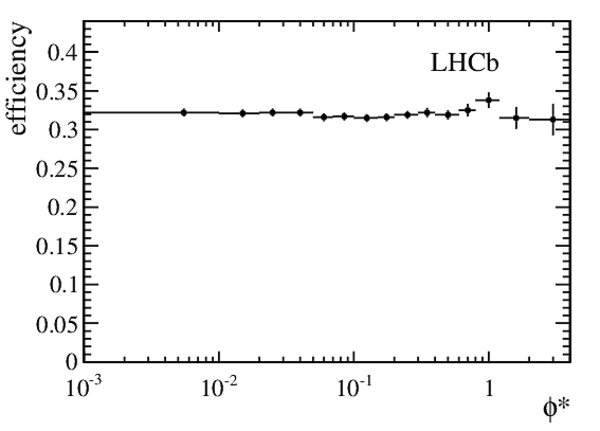
Overall detection efficiency, $\epsilon$, determined from a combination of data and simulation as described in the text, shown as a function of (left) $y_{ Z }$ and (right) $\phi^*$. |
epsOve[..].pdf [14 KiB] HiDef png [69 KiB] Thumbnail [45 KiB] *.C file |

|
|
epsOve[..].pdf [14 KiB] HiDef png [70 KiB] Thumbnail [45 KiB] *.C file |
|
|
|
Comparison between data and simulation for the distribution of $\min( p_{\rm T} ( e ^+ ), p_{\rm T} ( e ^- ))$, used in the assessment of uncertainties in $\epsilon_{\rm kin}$. The data are shown as points with error bars, the background obtained from same-sign data is shown in red (dark shading), to which the expectation from $ Z $ $\rightarrow$ $ e ^+ e ^-$ simulation is added in yellow (light shading). The simulated distribution is normalised to the background-subtracted data. The $\tau ^+\tau ^- $ background is also included (green), though barely visible. The dashed line indicates the threshold applied in the event selection. The small plot at the top shows the pulls ( i.e. deviations divided by statistical uncertainties) between the data and the expectation. |
ptmin_8TeV.pdf [24 KiB] HiDef png [238 KiB] Thumbnail [224 KiB] *.C file |

|
|
Measured cross-section for $ Z \rightarrow e ^+ e ^- $ shown as the shaded band, with the inner (orange) band indicating the statistical error and the outer (yellow) band the total uncertainty. For comparison, the NNLO predictions of Fewz are shown using five different sets of PDFs. The uncertainties on these predictions include the PDF uncertainties and the variation of the factorisation and normalisation scales, as well as the errors arising from numerical integration. |
ZeeXS_8TeV.pdf [13 KiB] HiDef png [125 KiB] Thumbnail [108 KiB] *.C file |

|
|
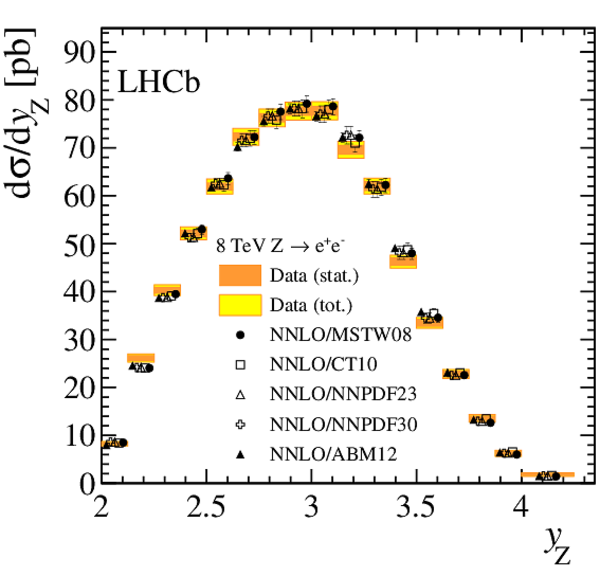
(left) Differential cross-section ${\rm d}\sigma/{\rm d} y_{ Z }$ and (right) normalised differential cross-section $(1/\sigma){\rm d}\sigma/{\rm d} y_{ Z }$ as a function of $y_{ Z }$. The measured data are shown as the shaded bands, with the inner (orange) bands indicating the statistical error and the outer (yellow) bands the total uncertainty. For comparison, the NNLO predictions of Fewz using five different sets of PDFs are shown on the left-hand plot. The same data are compared with leading log calculations in the right-hand plot. To aid clarity, small horizontal displacements are applied to some of the predictions. |
YZPlot[..].pdf [18 KiB] HiDef png [268 KiB] Thumbnail [225 KiB] *.C file |
|
|
YZPlot[..].pdf [16 KiB] HiDef png [205 KiB] Thumbnail [199 KiB] *.C file |

|
|
|
(left) Normalised differential cross-section $(1/\sigma){\rm d}\sigma/{\rm d}\phi^*$ as a function of $\phi^*$. The measured data are shown as the shaded bands, with the inner (orange) bands indicating the statistical error and the outer (yellow) bands the total uncertainty. For comparison, the predictions of the leading-log calculations described in the text are shown. (right) The same data and predictions normalised to the measurement in data, so that the measurements are shown as the shaded bands at unity. To aid clarity, small horizontal displacements are applied to some of the predictions. |
Phista[..].pdf [16 KiB] HiDef png [175 KiB] Thumbnail [167 KiB] *.C file |

|
|
Phista[..].pdf [16 KiB] HiDef png [190 KiB] Thumbnail [180 KiB] *.C file |

|
|
|
Animated gif made out of all figures. |
PAPER-2015-003.gif Thumbnail |

|
![HiDef png [69 KiB]](Directory_LHCb-PAPER-2015-003/hidef_epsOverall_YZ_8TeV.png)
![HiDef png [70 KiB]](Directory_LHCb-PAPER-2015-003/hidef_epsOverall_Phistar_8TeV.png)
![HiDef png [238 KiB]](Directory_LHCb-PAPER-2015-003/hidef_ptmin_8TeV.png)
![HiDef png [125 KiB]](Directory_LHCb-PAPER-2015-003/hidef_ZeeXS_8TeV.png)
![HiDef png [268 KiB]](Directory_LHCb-PAPER-2015-003/hidef_YZPlot_8TeV_NNLO_UNNORM.png)
![HiDef png [205 KiB]](Directory_LHCb-PAPER-2015-003/hidef_YZPlot_8TeV_LL.png)
![HiDef png [175 KiB]](Directory_LHCb-PAPER-2015-003/hidef_PhistarPlot_8TeV_LL.png)
![HiDef png [190 KiB]](Directory_LHCb-PAPER-2015-003/hidef_PhistarPlot_8TeV_LL_RAT.png)
Tables and captions
|
Efficiencies and other factors used for the cross-section determination (see Eq. (1)) averaged over the experimental acceptance by integrating over $y_{ Z }$. The fractional uncertainties on the overall factors are also given, separated into components that are assumed to be correlated and uncorrelated between bins of the differential distributions. |
Table_1.pdf [56 KiB] HiDef png [63 KiB] Thumbnail [29 KiB] tex code |

|
|
Differential cross-section for $ Z \rightarrow e ^+ e ^- $ as a function of $ Z $ -boson rapidity. The first error is statistical, the second the uncorrelated experimental systematic, the third the correlated experimental systematic and the last error is the uncertainty in luminosity. The cross-sections are at the Born level, i.e. before FSR. The rightmost column gives values of the additional factor, $f_{\rm FSR}$, by which the results should be multiplied in order to give the cross-sections after FSR. |
Table_2.pdf [42 KiB] HiDef png [222 KiB] Thumbnail [109 KiB] tex code |

|
|
Differential cross-section for $ Z \rightarrow e ^+ e ^- $ as a function of $\phi^*$. The first error is statistical, the second the uncorrelated experimental systematic, the third the correlated experimental systematic and the last error is the uncertainty in luminosity. The cross-sections are at the Born level, i.e. before FSR. The rightmost column gives values of the additional factor, $f_{\rm FSR}$, by which the results should be multiplied in order to give the cross-sections after FSR. |
Table_3.pdf [42 KiB] HiDef png [173 KiB] Thumbnail [27 KiB] tex code |

|
|
Correlation matrix between bins of $y_{\rm Z}$. The bin numbering follows the same sequence as Table 2. |
Table_4.pdf [14 KiB] HiDef png [90 KiB] Thumbnail [35 KiB] tex code |

|
|
Correlation matrix between bins of $\phi^*$. The bin numbering follows the same sequence as Table 3. |
Table_5.pdf [14 KiB] HiDef png [81 KiB] Thumbnail [33 KiB] tex code |

|
![HiDef png [63 KiB]](Directory_LHCb-PAPER-2015-003/hidef_Table_1.png)
![HiDef png [222 KiB]](Directory_LHCb-PAPER-2015-003/hidef_Table_2.png)
![HiDef png [173 KiB]](Directory_LHCb-PAPER-2015-003/hidef_Table_3.png)
![HiDef png [90 KiB]](Directory_LHCb-PAPER-2015-003/hidef_Table_4.png)
![HiDef png [81 KiB]](Directory_LHCb-PAPER-2015-003/hidef_Table_5.png)
Supplementary Material [file]
|
README This file Fig6.pdf M(ee) mass distribution Fig6.png M(ee) mass distribution Fig6.eps M(ee) mass distribution Fig6.C M(ee) mass distribution LHCb-PAPER-2015-003-supplementary.pdf Figure + documentation |
Fig6.pdf [24 KiB] HiDef png [196 KiB] Thumbnail [181 KiB] *C file |

|
|
LHCb-P[..].pdf [94 KiB] HiDef png [380 KiB] Thumbnail [195 KiB] *C file |

|
![HiDef png [196 KiB]](Directory_LHCb-PAPER-2015-003/supplementary/hidef_Fig6.png)
![HiDef png [380 KiB]](Directory_LHCb-PAPER-2015-003/supplementary/hidef_LHCb-PAPER-2015-003-supplementary.png)
Created on 27 April 2024.