Information
LHCb-PAPER-2015-004
CERN-PH-EP-2015-076
arXiv:1503.07089 [PDF]
(Submitted on 24 Mar 2015)
Phys. Rev. Lett. 115 (2015) 031601
Inspire 1355375
Tools
Abstract
Measurements are presented of the $CP$ violation observables $S$ and $C$ in the decays of $B^0$ and $\overline{B}{}^0$ mesons to the $J/\psi K^0_S$ final state. The data sample corresponds to an integrated luminosity of $3.0 \text{fb}^{-1}$ collected with the LHCb experiment in proton-proton collisions at center-of-mass energies of $7$ and $8 \text{TeV}$. The analysis of the time evolution of $41500$ $B^0$ and $\overline{B}{}^0$ decays yields $S = 0.731 \pm 0.035 \text{(stat)} \pm 0.020 \text{(syst)}$ and $C = -0.038 \pm 0.032 \text{(stat)} \pm 0.005 \text{(syst)}$. In the Standard Model, $S$ equals $\sin(2\beta)$ to a good level of precision. The values are consistent with the current world averages and with the Standard Model expectations.
Figures and captions
|
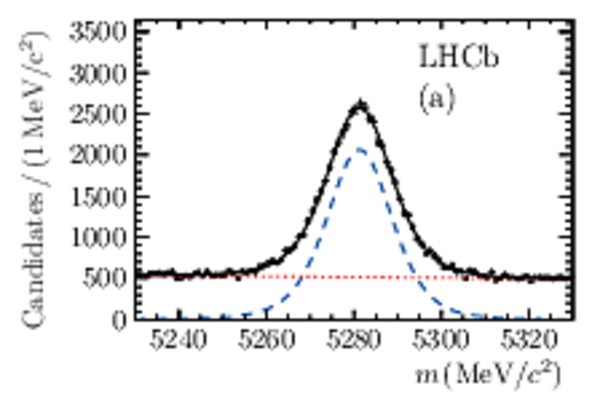
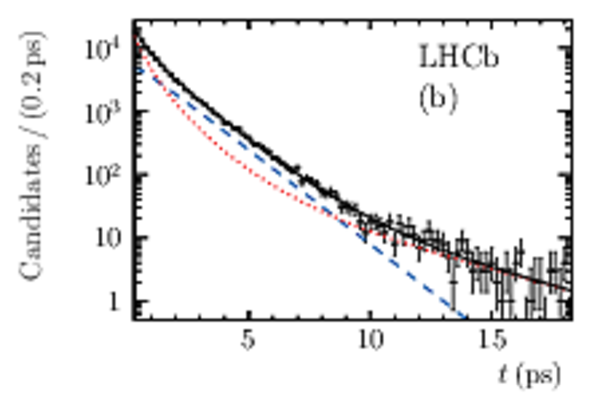
Distribution of (a) the reconstructed mass and (b) logarithmic distribution of the decay time of tagged $B^0 \rightarrow {J\mskip -3mu/\mskip -2mu\psi\mskip 2mu} {K^0_{\rm\scriptscriptstyle S}}$ candidates. The solid black lines show the fit projections, while the dashed (dotted) lines show the projections for the signal (background) components only. |
Fig1a.pdf [43 KiB] HiDef png [287 KiB] Thumbnail [312 KiB] *.C file |
|
|
Fig1b.pdf [39 KiB] HiDef png [231 KiB] Thumbnail [254 KiB] *.C file |
|
|
|
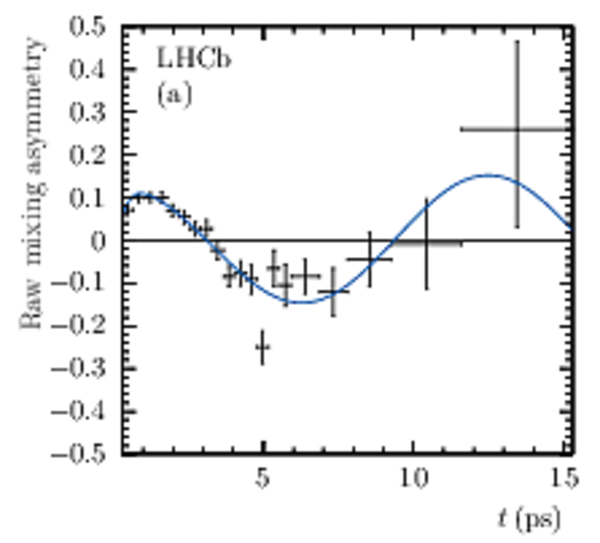
Time-dependent signal-yield asymmetry $(N_{{\overline{ B}}{}^0} - N_{B^0})/(N_{{\overline{ B}}{}^0} + N_{B^0})$. Here, $N_{B^0}$ ($N_{{\overline{ B}}{}^0}$) is the number of $B^0 \rightarrow {J\mskip -3mu/\mskip -2mu\psi\mskip 2mu} {K^0_{\rm\scriptscriptstyle S}}$ decays with a $B^0$ (${\overline{ B}}{}^0$) flavor tag. The data points are obtained with the sPlot technique [37], assigning signal weights to the events based on a fit to the reconstructed mass distribution. The solid curve is the projection of the signal PDF. |
Fig2.pdf [32 KiB] HiDef png [196 KiB] Thumbnail [226 KiB] *.C file |

|
|
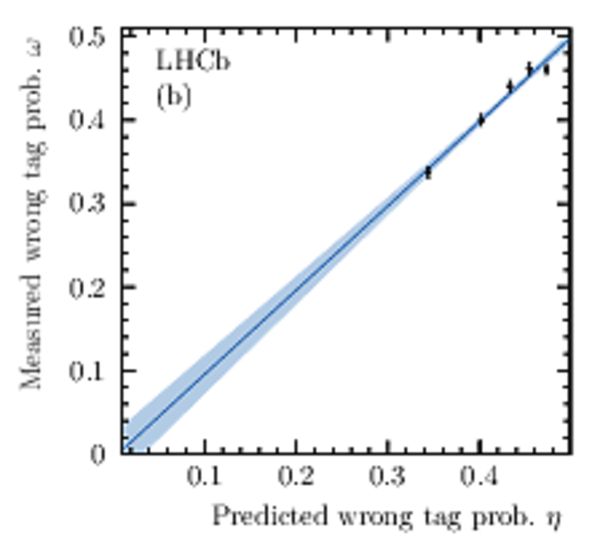
(a) Raw mixing asymmetry $(N_{\text{unmixed}} - N_{\text{mixed}})/(N_{\text{unmixed}} + N_{\text{mixed}})$ for all SS$\pi$ tagged $B^0 \rightarrow {J\mskip -3mu/\mskip -2mu\psi\mskip 2mu} K^{*0}$ decay candidates. Here, $N_{\text{unmixed}}$ ($N_{\text{mixed}}$) is the number of $B^0 \rightarrow {J\mskip -3mu/\mskip -2mu\psi\mskip 2mu} K^{*0}$ decays with a final state that does (not) correspond to the flavor tag. The black line shows the fit projection. (b) The linear calibration of the SS$\pi$ mistag probability with $B^0 \rightarrow {J\mskip -3mu/\mskip -2mu\psi\mskip 2mu} K^{*0}$ decays. |
FigA1a.pdf [33 KiB] HiDef png [221 KiB] Thumbnail [271 KiB] *.C file |
|
|
FigA1b.pdf [40 KiB] HiDef png [305 KiB] Thumbnail [282 KiB] *.C file |
|
|
|
Animated gif made out of all figures. |
PAPER-2015-004.gif Thumbnail |

|
![HiDef png [287 KiB]](Directory_LHCb-PAPER-2015-004/hidef_Fig1a.png)
![HiDef png [231 KiB]](Directory_LHCb-PAPER-2015-004/hidef_Fig1b.png)
![HiDef png [196 KiB]](Directory_LHCb-PAPER-2015-004/hidef_Fig2.png)
![HiDef png [221 KiB]](Directory_LHCb-PAPER-2015-004/hidef_FigA1a.png)
![HiDef png [305 KiB]](Directory_LHCb-PAPER-2015-004/hidef_FigA1b.png)
Tables and captions
|
Systematic uncertainties $\sigma_{S}$ and $\sigma_{C}$ on $S$ and $C$. Entries marked with a dash represent studies where no significant effect is observed. |
Table_1.pdf [50 KiB] HiDef png [100 KiB] Thumbnail [42 KiB] tex code |

|
![HiDef png [100 KiB]](Directory_LHCb-PAPER-2015-004/hidef_Table_1.png)
Created on 27 April 2024.