Measurement of the time-dependent CP asymmetries in $B_s^0\rightarrow J/\psi K_{\rm S}^0$
[to restricted-access page]Information
LHCb-PAPER-2015-005
CERN-PH-EP-2015-064
arXiv:1503.07055 [PDF]
(Submitted on 24 Mar 2015)
JHEP 06 (2015) 131
Inspire 1355373
Tools
Abstract
The first measurement of decay-time-dependent CP asymmetries in the decay $B_s^0\rightarrow J/\psi K_{\rm S}^0$ and an updated measurement of the ratio of branching fractions $\mathcal{B}(B_s^0\rightarrow J/\psi K_{\rm S}^0)/\mathcal{B}(B_d^0\rightarrow J/\psi K_{\rm S}^0)$} are presented. The results are obtained using data corresponding to an integrated luminosity of 3.0 fb$^{-1}$ of proton-proton collisions recorded with the LHCb detector at centre-of-mass energies of 7 and 8 TeV. The results on the CP asymmetries are $A_{\Delta\Gamma}(B_s^0\rightarrow J/\psi K_{\rm S}^0) = 0.49_{-0.65}^{+0.77}(stat) \pm 0.06(syst)$, $C_{\rm dir}(B_s^0\rightarrow J/\psi K_{\rm S}^0) = -0.28 \pm 0.41(stat) \pm 0.08(syst)$ and $S_{\rm mix}(B_s^0\rightarrow J/\psi K_{\rm S}^0) = -0.08 \pm 0.40(stat) \pm 0.08(syst)$. The ratio $\mathcal{B}(B_s^0\rightarrow J/\psi K_{\rm S}^0)/\mathcal{B}(B_d^0\rightarrow J/\psi K_{\rm S}^0)$ is measured to be $0.0431 \pm 0.0017(stat) \pm 0.0012(syst) \pm 0.0025(f_s/f_d)$, where the last uncertainty is due to the knowledge of the $B_s^0$ and $B_d^0$ production fractions.
Figures and captions
|
Decay topologies contributing to the $ B_{(s)}^0 \rightarrow { J \mskip -3mu/\mskip -2mu\psi \mskip 2mu} {} K ^0_{\rm\scriptscriptstyle S} $ channel: (left) tree diagram and (right) penguin diagram. |
Fig1a.pdf [6 KiB] HiDef png [113 KiB] Thumbnail [89 KiB] *.C file |

|
|
Fig1b.pdf [8 KiB] HiDef png [124 KiB] Thumbnail [96 KiB] *.C file |

|
|
|
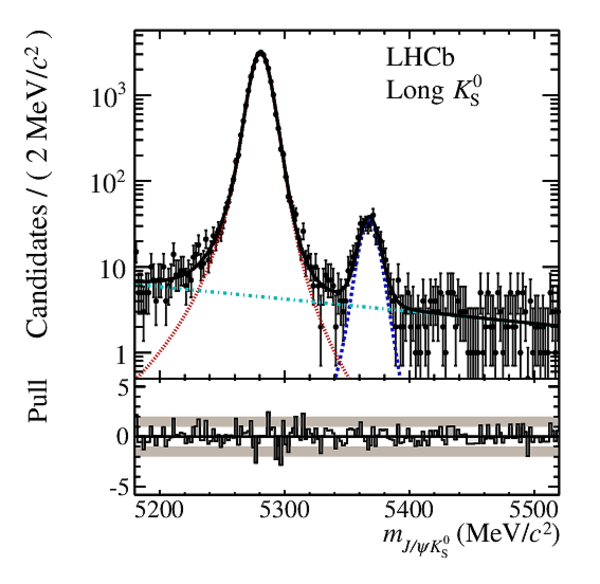
Mass distribution of $ B $ candidates at different stages of the event selection for the (left) long $ K ^0_{\rm\scriptscriptstyle S}$ and (right) downstream $ K ^0_{\rm\scriptscriptstyle S}$ sample. The data sample after initial selection (red, $+$), after the first neural net (green, $\times$) and after the second neural net (black, $\bullet$) are shown. Overlaid are projections of the fit described in Sec. 5. Shown components are $ B ^0_ s \rightarrow { J \mskip -3mu/\mskip -2mu\psi \mskip 2mu} K ^0_{\rm\scriptscriptstyle S} $ (dark blue, dashed), $ B ^0 \rightarrow { J \mskip -3mu/\mskip -2mu\psi \mskip 2mu} K ^0_{\rm\scriptscriptstyle S} $ (red, dotted) and combinatorial background (turquoise, dash-dotted). |
Fig2a.pdf [47 KiB] HiDef png [523 KiB] Thumbnail [364 KiB] *.C file |

|
|
Fig2b.pdf [45 KiB] HiDef png [408 KiB] Thumbnail [327 KiB] *.C file |

|
|
|
Decay time distribution of $ B $ candidates in the (left) long $ K ^0_{\rm\scriptscriptstyle S}$ and (right) downstream $ K ^0_{\rm\scriptscriptstyle S}$ sample. The fit projection is shown as solid black line. Shown components are $ B ^0_ s \rightarrow { J \mskip -3mu/\mskip -2mu\psi \mskip 2mu} K ^0_{\rm\scriptscriptstyle S} $ (dark blue, dashed), $ B ^0 \rightarrow { J \mskip -3mu/\mskip -2mu\psi \mskip 2mu} K ^0_{\rm\scriptscriptstyle S} $ (red, dotted) and combinatorial background (turquoise, dash-dotted). |
Fig3a.pdf [30 KiB] HiDef png [240 KiB] Thumbnail [222 KiB] *.C file |

|
|
Fig3b.pdf [31 KiB] HiDef png [264 KiB] Thumbnail [235 KiB] *.C file |

|
|
|
Animated gif made out of all figures. |
PAPER-2015-005.gif Thumbnail |

|
![HiDef png [113 KiB]](Directory_LHCb-PAPER-2015-005/hidef_Fig1a.png)
![HiDef png [124 KiB]](Directory_LHCb-PAPER-2015-005/hidef_Fig1b.png)
![HiDef png [523 KiB]](Directory_LHCb-PAPER-2015-005/hidef_Fig2a.png)
![HiDef png [408 KiB]](Directory_LHCb-PAPER-2015-005/hidef_Fig2b.png)
![HiDef png [240 KiB]](Directory_LHCb-PAPER-2015-005/hidef_Fig3a.png)
![HiDef png [264 KiB]](Directory_LHCb-PAPER-2015-005/hidef_Fig3b.png)
Tables and captions
|
List of the observables describing the $ B ^0$ and $ B ^0_ s $ systems that are included as Gaussian constraints to the likelihood fit. |
Table_1.pdf [58 KiB] HiDef png [33 KiB] Thumbnail [15 KiB] tex code |

|
|
Effective $ B $ production asymmetries specific to the data sample used in this analysis. |
Table_2.pdf [52 KiB] HiDef png [58 KiB] Thumbnail [26 KiB] tex code |

|
|
Fitted yields from the unbinned maximum likelihood fit. The uncertainties are statistical only. |
Table_3.pdf [52 KiB] HiDef png [42 KiB] Thumbnail [20 KiB] tex code |

|
|
Summary of systematic uncertainties. |
Table_4.pdf [40 KiB] HiDef png [82 KiB] Thumbnail [36 KiB] tex code |

|
![HiDef png [33 KiB]](Directory_LHCb-PAPER-2015-005/hidef_Table_1.png)
![HiDef png [58 KiB]](Directory_LHCb-PAPER-2015-005/hidef_Table_2.png)
![HiDef png [42 KiB]](Directory_LHCb-PAPER-2015-005/hidef_Table_3.png)
![HiDef png [82 KiB]](Directory_LHCb-PAPER-2015-005/hidef_Table_4.png)
Supplementary Material [file]
| Supplementary material full pdf |
Supple[..].pdf [177 KiB] |
|
|
This ZIP file contains supplemetary material for the publication LHCb-PAPER-2015-005. The files are: Supplementary.pdf : Results from Feldman--Cousins Scan + Correlation matrix Fig4a.*, Fig4b.* : The 1-CL plots from the Feldman--Cousins Scan |
Fig4a.pdf [16 KiB] HiDef png [230 KiB] Thumbnail [121 KiB] *C file |

|
|
Fig4b.pdf [16 KiB] HiDef png [240 KiB] Thumbnail [132 KiB] *C file |

|
|
|
Fig4c.pdf [16 KiB] HiDef png [246 KiB] Thumbnail [134 KiB] *C file |
|
|
|
Fig5a.pdf [39 KiB] HiDef png [335 KiB] Thumbnail [305 KiB] *C file |
|
|
|
Fig5b.pdf [40 KiB] HiDef png [335 KiB] Thumbnail [297 KiB] *C file |

|
![HiDef png [230 KiB]](Directory_LHCb-PAPER-2015-005/supplementary/hidef_Fig4a.png)
![HiDef png [240 KiB]](Directory_LHCb-PAPER-2015-005/supplementary/hidef_Fig4b.png)
![HiDef png [246 KiB]](Directory_LHCb-PAPER-2015-005/supplementary/hidef_Fig4c.png)
![HiDef png [335 KiB]](Directory_LHCb-PAPER-2015-005/supplementary/hidef_Fig5a.png)
![HiDef png [335 KiB]](Directory_LHCb-PAPER-2015-005/supplementary/hidef_Fig5b.png)
Created on 27 April 2024.