First observation and measurement of the branching fraction for the decay $B^0_s \to D_s^{*\mp} K^{\pm}$
[to restricted-access page]Information
LHCb-PAPER-2015-008
CERN-PH-EP-2015-081
arXiv:1503.09086 [PDF]
(Submitted on 31 Mar 2015)
JHEP 06 (2015) 130
Inspire 1357203
Tools
Abstract
The first observation of the $B^0_s \to D_s^{*\mp} K^{\pm}$ decay is reported using 3.0$fb^{-1}$ of proton-proton collision data collected by the LHCb experiment. The $D_s^{*\mp}$ mesons are reconstructed through the decay chain $D_s^{*\mp} \to \gamma D_s^{\mp}(K^{\mp}K^{\pm}\pi^{\mp})$. The branching fraction relative to that for $B^0_s \to D_s^{*-} \pi^{+}$ is measured to be $0.068 \pm 0.005 ^{+0.003}_{-0.002}$, where the first uncertainty is statistical and the second is systematic. Using a recent measurement of $BR(B^0_s \to D_s^{*-} \pi^{+})$ the absolute branching fraction of $B^0_s \to D_s^{*\mp} K^{\pm}$ is measured as ( 16.3 $\pm$ 1.2 (stat) $^{+0.7}_{-0.5}$ (syst) $\pm$ 4.8 (norm) ) $\times$ 10$^{-5}$, where the third uncertainty is due to the uncertainty on the branching fraction of the normalisation channel.
Figures and captions
|
Feynman diagrams of the processes under study. The upper diagrams represent the two tree topologies ($b \rightarrow c$ and $b \rightarrow u$ transitions, respectively) by which a $ B ^0_ s $ meson decays into the $ D ^{*\mp}_ s $ $ K ^\pm$ final state; the lower diagrams show the tree diagram of $ B ^0_ s $ $\rightarrow $ $ D ^{*-}_ s $ $\pi ^+$ and the $ W $ -exchange topology of $ B ^0_ s $ $\rightarrow $ $ D ^{*-}_ s $ $ K ^+$ . |
fig-1a.pdf [89 KiB] HiDef png [49 KiB] Thumbnail [25 KiB] *.C file |

|
|
fig-1b.pdf [89 KiB] HiDef png [46 KiB] Thumbnail [24 KiB] *.C file |

|
|
|
fig-1c.pdf [89 KiB] HiDef png [44 KiB] Thumbnail [22 KiB] *.C file |

|
|
|
fig-1d.pdf [89 KiB] HiDef png [70 KiB] Thumbnail [35 KiB] *.C file |

|
|
|
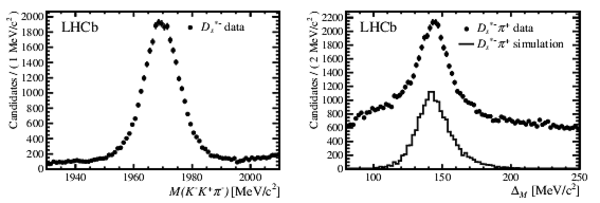
(left) The $ K ^-$ $ K ^+$ $\pi ^-$ invariant mass and (right) mass difference $\Delta_{M}$ of the $ B ^0_ s $ $\rightarrow $ $ D ^{*-}_ s $ $\pi ^+$ candidates. The points represent data. On the right plot the solid line represents the signal expected from the simulations. |
DsDeltaM.pdf [22 KiB] HiDef png [126 KiB] Thumbnail [60 KiB] *.C file |
|
|
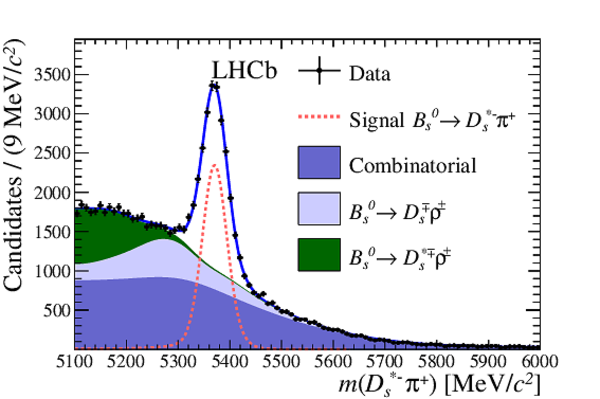
Invariant mass distribution of (top) $ B ^0_ s $ $\rightarrow $ $ D ^{*-}_ s $ $\pi ^+$ and (bottom) $ B ^0_ s $ $\rightarrow $ $ D ^{*\mp}_ s $ $ K ^\pm$ candidates with fit results superimposed. The fitted signal corresponding to the first observation of $ B ^0_ s $ $\rightarrow $ $ D ^{*\mp}_ s $ $ K ^\pm$ is shown by the dotted line in the lower plot. |
fitPi-[..].pdf [37 KiB] HiDef png [303 KiB] Thumbnail [238 KiB] *.C file |
|
|
fitK-n[..].pdf [39 KiB] HiDef png [374 KiB] Thumbnail [289 KiB] *.C file |

|
|
|
Distributions of (left) $\eta$ and (right) $p_{\rm T}$ of the photons for the $ D ^{*-}_ s $ $\pi ^+$ (blue) and $ D ^{*\mp}_ s $ $ K ^\mp$ (magenta) decays. Data, background-subtracted using the sPlot method, are represented by points, and simulations by solid lines. |
datavs[..].pdf [19 KiB] HiDef png [155 KiB] Thumbnail [120 KiB] *.C file |

|
|
Animated gif made out of all figures. |
PAPER-2015-008.gif Thumbnail |

|
![HiDef png [49 KiB]](Directory_LHCb-PAPER-2015-008/hidef_fig-1a.png)
![HiDef png [46 KiB]](Directory_LHCb-PAPER-2015-008/hidef_fig-1b.png)
![HiDef png [44 KiB]](Directory_LHCb-PAPER-2015-008/hidef_fig-1c.png)
![HiDef png [70 KiB]](Directory_LHCb-PAPER-2015-008/hidef_fig-1d.png)
![HiDef png [126 KiB]](Directory_LHCb-PAPER-2015-008/hidef_DsDeltaM.png)
![HiDef png [303 KiB]](Directory_LHCb-PAPER-2015-008/hidef_fitPi-nopulls.png)
![HiDef png [374 KiB]](Directory_LHCb-PAPER-2015-008/hidef_fitK-nopulls.png)
![HiDef png [155 KiB]](Directory_LHCb-PAPER-2015-008/hidef_datavsmc-ph.png)
Tables and captions
|
Estimated systematic uncertainties on ${\cal R}^*$. |
Table_1.pdf [62 KiB] HiDef png [77 KiB] Thumbnail [34 KiB] tex code |

|
![HiDef png [77 KiB]](Directory_LHCb-PAPER-2015-008/hidef_Table_1.png)
Created on 02 May 2024.