Differential branching fraction and angular analysis of $\Lambda^{0}_{b} \rightarrow \Lambda \mu^+\mu^-$ decays
[to restricted-access page]Information
LHCb-PAPER-2015-009
CERN-PH-EP-2015-078
arXiv:1503.07138 [PDF]
(Submitted on 24 Mar 2015)
JHEP 06 (2015) 115
Inspire 1355377
Tools
Abstract
The differential branching fraction of the rare decay $\Lambda^{0}_{b} \rightarrow \Lambda \mu^+\mu^-$ is measured as a function of $q^{2}$, the square of the dimuon invariant mass. The analysis is performed using proton-proton collision data, corresponding to an integrated luminosity of $3.0 fb^{-1}$, collected by the LHCb experiment. Evidence of signal is observed in the $q^2$ region below the square of the $J/\psi$ mass. Integrating over $15 < q^{2} < 20 GeV^2/c^4$ the branching fraction is measured as $d\mathcal{B}(\Lambda^{0}_{b} \rightarrow \Lambda \mu^+\mu^-)/dq^2 = (1.18 ^{+ 0.09} _{-0.08} \pm 0.03 \pm 0.27) \times 10^{-7} ( GeV^{2}/c^{4})^{-1}$, where the uncertainties are statistical, systematic and due to the normalisation mode, $\Lambda^{0}_{b} \rightarrow J/\psi \Lambda$, respectively. In the $q^2$ intervals where the signal is observed, angular distributions are studied and the forward-backward asymmetries in the dimuon ($A^{l}_{\rm FB}$) and hadron ($A^{h}_{\rm FB}$) systems are measured for the first time. In the range $15 < q^2 < 20 GeV^2/c^4$ they are found to be $A^{l}_{\rm FB} = -0.05 \pm 0.09 (stat) \pm 0.03 (syst)$ and $A^{h}_{\rm FB} = -0.29 \pm 0.07 (stat) \pm 0.03 (syst)$.
Figures and captions
|
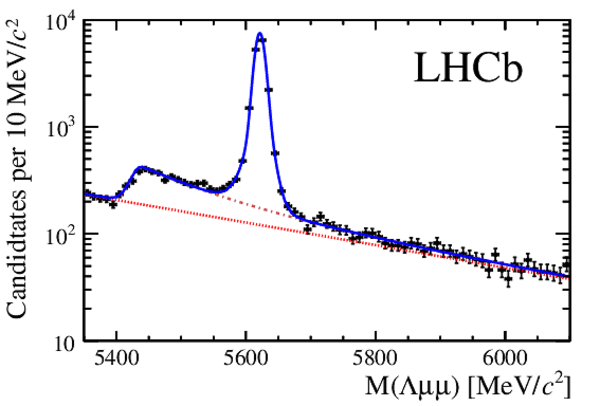
Invariant mass distribution of the $\Lambda ^0_ b \rightarrow { J \mskip -3mu/\mskip -2mu\psi \mskip 2mu} \Lambda $ candidates selected with the neural network requirement used for the high- $ q^2$ region. The (black) points show data, combining downstream and long candidates, and the solid (blue) line represents the overall fit function. The dotted (red) line represents the combinatorial and the dash-dotted (brown) line the peaking background from $ B ^0 \rightarrow { J \mskip -3mu/\mskip -2mu\psi \mskip 2mu} K ^0_{\rm\scriptscriptstyle S} $ decays. |
figure1.pdf [22 KiB] HiDef png [199 KiB] Thumbnail [157 KiB] *.C file |
|
|
Invariant mass distribution of the $\Lambda ^0_ b \rightarrow \Lambda \mu ^+\mu ^- $ candidates, integrated over the region $15.0 < q^2 < 20.0$ $ {\mathrm{ Ge V^2 /}c^4}$ together with the fit function described in the text. The points show data, the solid (blue) line is the overall fit function and the dotted (red) line represents the combinatorial background. The background component from $ B ^0 \rightarrow K ^0_{\rm\scriptscriptstyle S} \mu ^+\mu ^- $ decays, (brown) dashed line, is barely visibile due to the very low yield. |
figure2.pdf [16 KiB] HiDef png [202 KiB] Thumbnail [174 KiB] *.C file |

|
|
Invariant mass distributions of $\Lambda ^0_ b \rightarrow \Lambda \mu ^+\mu ^- $ candidates, in eight $ q^2$ intervals, together with the fit function described in the text. The points show data, the solid (blue) line is the overall fit function and the dotted (red) line represents the combinatorial background component. |
figure3.pdf [43 KiB] HiDef png [798 KiB] Thumbnail [712 KiB] *.C file |

|
|
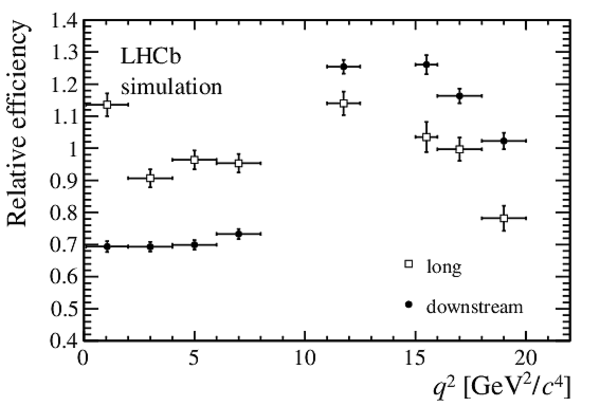
Total relative efficiency, $\varepsilon_{\mathrm{rel}}$, between $\Lambda ^0_ b \rightarrow \Lambda \mu ^+\mu ^- $ and $\Lambda ^0_ b \rightarrow { J \mskip -3mu/\mskip -2mu\psi \mskip 2mu} \Lambda $ decays. The uncertainties are the combination of both statistical and systematic components, and are dominated by the latter. |
figure4.pdf [15 KiB] HiDef png [98 KiB] Thumbnail [63 KiB] *.C file |
|
|
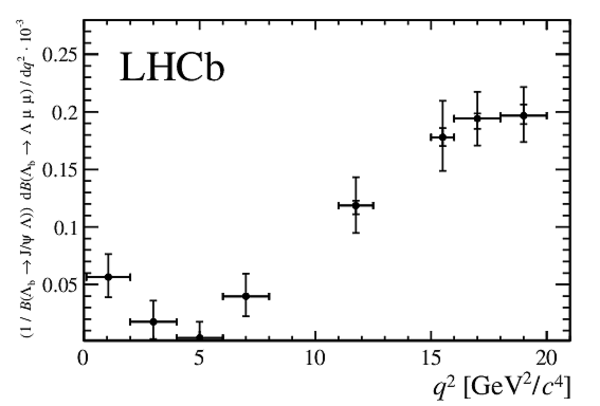
Measured $\Lambda ^0_ b \rightarrow \Lambda \mu ^+\mu ^- $ branching fraction as a function of $ q^2$ with the predictions of the SM [15] superimposed. The inner error bars on data points represent the total uncertainty on the relative branching fraction (statistical and systematic); the outer error bar also includes the uncertainties from the branching fraction of the normalisation mode. |
figure5.pdf [20 KiB] HiDef png [127 KiB] Thumbnail [124 KiB] *.C file |

|
|
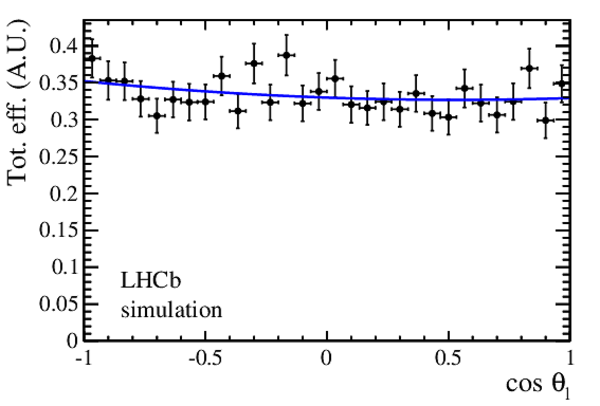
Angular efficiencies as a function of (left) $\cos\theta_\ell$ and (right) $\cos\theta_h$ for (upper) long and (lower) downstream candidates, in the interval $15 < q^2 < 20$ $ {\mathrm{ Ge V^2 /}c^4}$ , obtained using simulated events. The (blue) line shows the fit that is used to model the angular acceptance in the fit to data. |
figure6a.pdf [16 KiB] HiDef png [128 KiB] Thumbnail [124 KiB] *.C file |

|
|
figure6b.pdf [16 KiB] HiDef png [138 KiB] Thumbnail [137 KiB] *.C file |

|
|
|
figure6c.pdf [16 KiB] HiDef png [137 KiB] Thumbnail [140 KiB] *.C file |
|
|
|
figure6d.pdf [17 KiB] HiDef png [150 KiB] Thumbnail [151 KiB] *.C file |

|
|
|
Angular distributions as a function of (left) $\cos \theta_\ell$ and (right) $\cos \theta_h$, for candidates in the integrated $15 < q^2 <20$ $ {\mathrm{ Ge V^2 /}c^4}$ interval with the overall fit function overlaid (solid blue). The (red) dotted line represents the combinatorial background. |
figure7a.pdf [14 KiB] HiDef png [139 KiB] Thumbnail [119 KiB] *.C file |

|
|
figure7b.pdf [14 KiB] HiDef png [147 KiB] Thumbnail [132 KiB] *.C file |

|
|
|
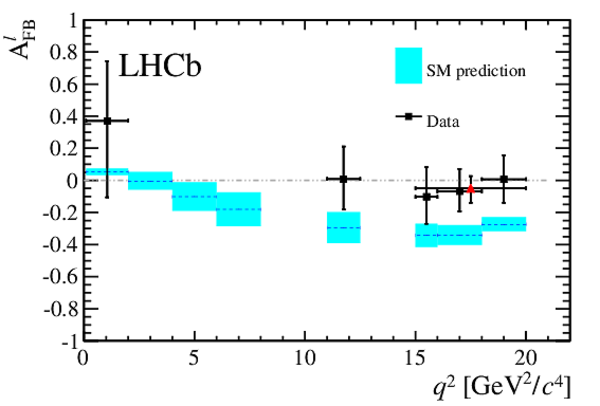
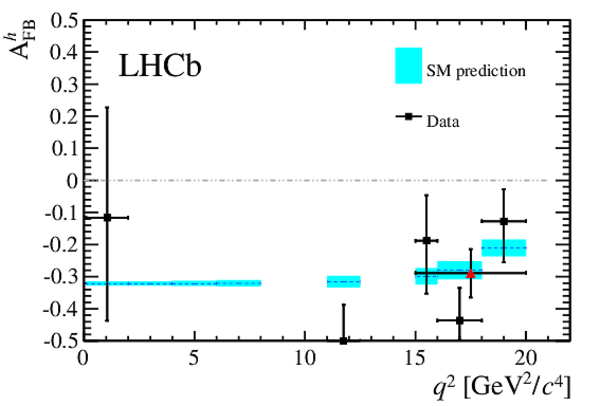
Measured values of (left) the leptonic and (right) the hadronic forward-backward asymmetries in bins of $ q^2$ . Data points are only shown for $ q^2$ intervals where a statistically significant signal yield is found, see text for details. The (red) triangle represents the values for the $15 < q^2 < 20$ $ {\mathrm{ Ge V^2 /}c^4}$ interval. Standard Model predictions are obtained from Ref. [17]. |
figure8a.pdf [15 KiB] HiDef png [115 KiB] Thumbnail [128 KiB] *.C file |
|
|
figure8b.pdf [15 KiB] HiDef png [119 KiB] Thumbnail [134 KiB] *.C file |
|
|
|
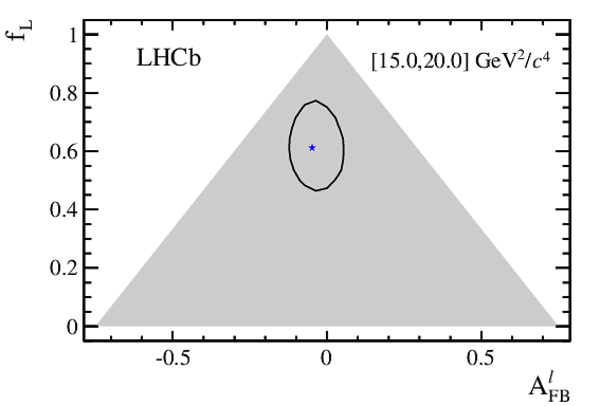
Two-dimensional 68 % CL region (black) as a function of $A_{\rm FB}^\ell$ and $f_{\rm L}$. The shaded area represents the region where the PDF is positive over the complete $\cos \theta_{\ell}$ range. The best fit point is given by the (blue) star. |
figure9.pdf [13 KiB] HiDef png [99 KiB] Thumbnail [95 KiB] *.C file |
|
|
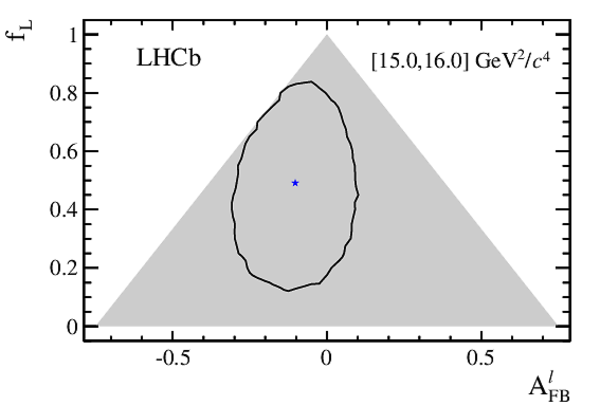
Two-dimensional 68 % CL regions (black) as a function of $A_{\rm FB}^\ell$ and $f_{\rm L}$. The shaded areas represent the regions in which the PDF is positive over the complete $\cos \theta_{\ell}$ range. The best fit points are indicated by the (blue) stars. |
figure10a.pdf [14 KiB] HiDef png [113 KiB] Thumbnail [108 KiB] *.C file |

|
|
figure10b.pdf [14 KiB] HiDef png [116 KiB] Thumbnail [113 KiB] *.C file |

|
|
|
figure10c.pdf [14 KiB] HiDef png [113 KiB] Thumbnail [108 KiB] *.C file |
|
|
|
figure10d.pdf [13 KiB] HiDef png [102 KiB] Thumbnail [98 KiB] *.C file |

|
|
|
figure10e.pdf [13 KiB] HiDef png [107 KiB] Thumbnail [103 KiB] *.C file |

|
|
|
Animated gif made out of all figures. |
PAPER-2015-009.gif Thumbnail |

|
Tables and captions
|
Number of $\Lambda ^0_ b \rightarrow { J \mskip -3mu/\mskip -2mu\psi \mskip 2mu} \Lambda $ decays in the long and downstream categories found using the selection for low- and high- $ q^2$ regions. Uncertainties shown are statistical only. |
Table_1.pdf [37 KiB] HiDef png [50 KiB] Thumbnail [23 KiB] tex code |

|
|
Signal decay yields ($N_\mathrm{S}$) obtained from the mass fit to $\Lambda ^0_ b \rightarrow \Lambda \mu ^+\mu ^- $ candidates in each $ q^2$ interval together with their statistical significances. The yields are the sum of long and downstream categories with downstream decays comprising $\sim 80 \%$ of the total yield. The $8-11$ and $12.5-15$ $ {\mathrm{ Ge V^2 /}c^4}$ $ q^2$ intervals are excluded from the study as they are dominated by decays via charmonium resonances. |
Table_2.pdf [38 KiB] HiDef png [72 KiB] Thumbnail [37 KiB] tex code |

|
|
Systematic uncertainties as a function of $ q^2$ , assigned for yields and efficiencies. Values reported are the sums in quadrature of all contributions evaluated within each category. |
Table_3.pdf [45 KiB] HiDef png [61 KiB] Thumbnail [31 KiB] tex code |

|
|
Measured differential branching fraction of $\Lambda ^0_ b \rightarrow \Lambda \mu ^+\mu ^- $ , where the uncertainties are statistical, systematic and due to the uncertainty on the normalisation mode, $\Lambda ^0_ b \rightarrow { J \mskip -3mu/\mskip -2mu\psi \mskip 2mu} \Lambda $ , respectively. |
Table_4.pdf [55 KiB] HiDef png [84 KiB] Thumbnail [33 KiB] tex code |

|
|
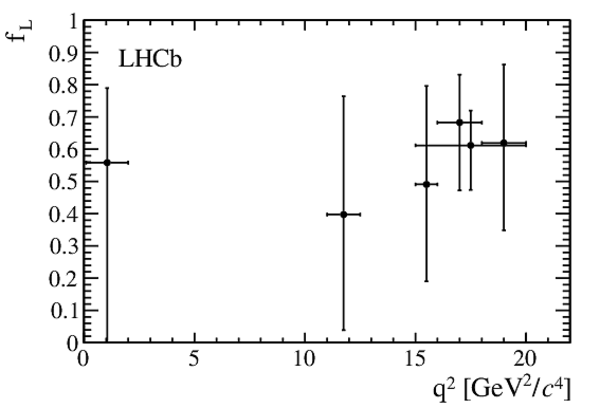
Measured values of leptonic and hadronic angular observables, where the first uncertainties are statistical and the second systematic. |
Table_5.pdf [53 KiB] HiDef png [65 KiB] Thumbnail [32 KiB] tex code |

|
|
Differential branching fraction of the $\Lambda ^0_ b \rightarrow \Lambda \mu ^+\mu ^- $ decay relative to $\Lambda ^0_ b \rightarrow { J \mskip -3mu/\mskip -2mu\psi \mskip 2mu} \Lambda $ decays, where the uncertainties are statistical and systematic, respectively. |
Table_6.pdf [68 KiB] HiDef png [81 KiB] Thumbnail [40 KiB] tex code |

|
Supplementary Material [file]

![HiDef png [199 KiB]](Directory_LHCb-PAPER-2015-009/hidef_figure1.png)
![HiDef png [202 KiB]](Directory_LHCb-PAPER-2015-009/hidef_figure2.png)
![HiDef png [798 KiB]](Directory_LHCb-PAPER-2015-009/hidef_figure3.png)
![HiDef png [98 KiB]](Directory_LHCb-PAPER-2015-009/hidef_figure4.png)
![HiDef png [127 KiB]](Directory_LHCb-PAPER-2015-009/hidef_figure5.png)
![HiDef png [128 KiB]](Directory_LHCb-PAPER-2015-009/hidef_figure6a.png)
![HiDef png [138 KiB]](Directory_LHCb-PAPER-2015-009/hidef_figure6b.png)
![HiDef png [137 KiB]](Directory_LHCb-PAPER-2015-009/hidef_figure6c.png)
![HiDef png [150 KiB]](Directory_LHCb-PAPER-2015-009/hidef_figure6d.png)
![HiDef png [139 KiB]](Directory_LHCb-PAPER-2015-009/hidef_figure7a.png)
![HiDef png [147 KiB]](Directory_LHCb-PAPER-2015-009/hidef_figure7b.png)
![HiDef png [115 KiB]](Directory_LHCb-PAPER-2015-009/hidef_figure8a.png)
![HiDef png [119 KiB]](Directory_LHCb-PAPER-2015-009/hidef_figure8b.png)
![HiDef png [99 KiB]](Directory_LHCb-PAPER-2015-009/hidef_figure9.png)
![HiDef png [113 KiB]](Directory_LHCb-PAPER-2015-009/hidef_figure10a.png)
![HiDef png [116 KiB]](Directory_LHCb-PAPER-2015-009/hidef_figure10b.png)
![HiDef png [113 KiB]](Directory_LHCb-PAPER-2015-009/hidef_figure10c.png)
![HiDef png [102 KiB]](Directory_LHCb-PAPER-2015-009/hidef_figure10d.png)
![HiDef png [107 KiB]](Directory_LHCb-PAPER-2015-009/hidef_figure10e.png)
![HiDef png [50 KiB]](Directory_LHCb-PAPER-2015-009/hidef_Table_1.png)
![HiDef png [72 KiB]](Directory_LHCb-PAPER-2015-009/hidef_Table_2.png)
![HiDef png [61 KiB]](Directory_LHCb-PAPER-2015-009/hidef_Table_3.png)
![HiDef png [84 KiB]](Directory_LHCb-PAPER-2015-009/hidef_Table_4.png)
![HiDef png [65 KiB]](Directory_LHCb-PAPER-2015-009/hidef_Table_5.png)
![HiDef png [81 KiB]](Directory_LHCb-PAPER-2015-009/hidef_Table_6.png)
![HiDef png [227 KiB]](Directory_LHCb-PAPER-2015-009/supplementary/hidef_figure11.png)
![HiDef png [72 KiB]](Directory_LHCb-PAPER-2015-009/supplementary/hidef_figure12.png)
![HiDef png [177 KiB]](Directory_LHCb-PAPER-2015-009/supplementary/hidef_figure13.png)
![HiDef png [70 KiB]](Directory_LHCb-PAPER-2015-009/supplementary/hidef_figure14.png)
Created on 27 April 2024.