Measurement of the exclusive $\Upsilon$ production cross-section in $pp$ collisions at $\sqrt{s}=$7 TeV and 8 TeV
[to restricted-access page]Information
LHCb-PAPER-2015-011
CERN-PH-EP-2015-123
arXiv:1505.08139 [PDF]
(Submitted on 29 May 2015)
JHEP 09 (2015) 084
Inspire 1373746
Tools
Abstract
A study is presented of central exclusive production of $\Upsilon(nS)$ states, where the $\Upsilon(nS)$ resonances decay to the $\mu^+\mu^-$ final state, using $pp$ collision data recorded by the LHCb experiment. The cross-section is measured in the rapidity range $2<y(\Upsilon)<4.5$ where the muons are reconstructed in the pseudorapidity range $2<\eta(\mu^\pm)<4.5$. The data sample corresponds to an integrated luminosity of 2.9 fb$^{-1}$ and was collected at centre-of-mass energies of $7$ TeV and $8$ TeV. The measured $\Upsilon(1S)$ and $\Upsilon(2S)$ production cross-sections are \begin{eqnarray} \sigma(pp \to p\Upsilon(1S)p) &=& 9.0 \pm 2.1 \pm 1.7\textrm{ pb and}\nonumber\\ \sigma(pp \to p\Upsilon(2S)p) &=& 1.3 \pm 0.8 \pm 0.3\textrm{ pb},\nonumber \end{eqnarray} where the first uncertainties are statistical and the second are systematic. The $\Upsilon(1S)$ cross-section is also measured as a function of rapidity and is found to be in good agreement with Standard Model predictions. An upper limit is set at 3.4 pb at the 95% confidence level for the exclusive $\Upsilon(3S)$ production cross-section, including possible contamination from $\chi_b(3P)\to\Upsilon(3S)\gamma$ decays.
Figures and captions
|
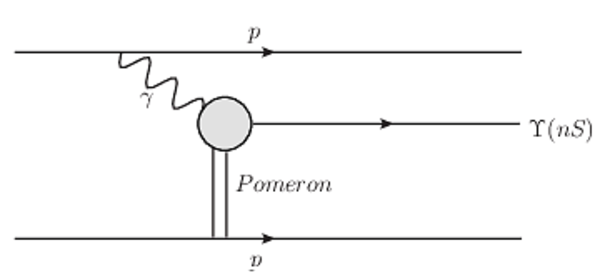
Leading Feynman diagram for photoproduction of $\Upsilon(nS)$ states, where the photon-pomeron interaction is indicated by the shaded grey circle. |
Fig1.pdf [12 KiB] HiDef png [75 KiB] Thumbnail [44 KiB] *.C file |
|
|
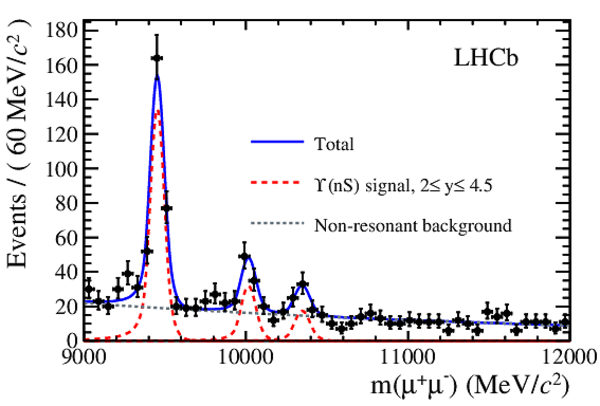
Invariant dimuon mass spectrum for 7 TeV and 8 TeV data in the rapidity range $2< y(\Upsilon)<4.5$ (black points). The fit PDF is superimposed (solid blue line). The $\Upsilon(1S,2S,3S)$ signal components, used to derive weights, are indicated with a long-dashed (red) line, and the non-resonant background is marked with a short-dashed (grey) line. |
Fig2.pdf [22 KiB] HiDef png [267 KiB] Thumbnail [219 KiB] *.C file |
|
|
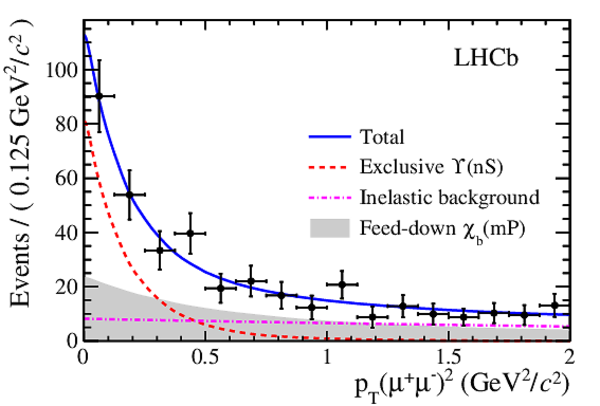
Fit to the $ p^2_{\rm T} $ distribution of the $\Upsilon$ candidates in the full rapidity range. |
Fig3.pdf [16 KiB] HiDef png [232 KiB] Thumbnail [204 KiB] *.C file |
|
|
Measurements of exclusive $\Upsilon(1S)$ photoproduction compared to theoretical predictions. In (a), the $\Upsilon(1S)$ cross-section in bins of rapidity is shown, compared to LO and NLO predictions. The LHCb measurements are indicated by black points with error bars for uncorrelated errors, and solid rectangles indicating the total uncertainty. In (b), the photon-proton cross-sections extracted from the LHCb results are indicated by black points, where the statistical and systematic uncertainties are combined in quadrature. The entire $W$-region in which these LHCb measurements are sensitive is indicated. Measurements made by H1 and ZEUS in the low-$W$ region are indicated by red and blue markers, respectively [4,5,7]. Predictions from Ref. [1] are included, resulting from LO and NLO fits to exclusive $J/\psi$ production data. The filled bands indicate the theoretical uncertainties on the 7 TeV prediction and the solid lines indicate the central values of the predictions for 8 TeV. In (b) predictions from Ref. [2] using different models for the $\Upsilon(1S)$ wave function are included, indicated by `bCGC'. |
Fig4a.pdf [32 KiB] HiDef png [232 KiB] Thumbnail [193 KiB] *.C file |

|
|
Fig4b.pdf [9 KiB] HiDef png [208 KiB] Thumbnail [135 KiB] *.C file |

|
|
|
Animated gif made out of all figures. |
PAPER-2015-011.gif Thumbnail |

|
![HiDef png [75 KiB]](Directory_LHCb-PAPER-2015-011/hidef_Fig1.png)
![HiDef png [267 KiB]](Directory_LHCb-PAPER-2015-011/hidef_Fig2.png)
![HiDef png [232 KiB]](Directory_LHCb-PAPER-2015-011/hidef_Fig3.png)
![HiDef png [232 KiB]](Directory_LHCb-PAPER-2015-011/hidef_Fig4a.png)
![HiDef png [208 KiB]](Directory_LHCb-PAPER-2015-011/hidef_Fig4b.png)
Tables and captions
|
Results of the invariant mass fits, within each rapidity interval. |
Table_1.pdf [38 KiB] HiDef png [48 KiB] Thumbnail [22 KiB] tex code |

|
|
Estimated yields of feed-down background from $\chi_b(mP)\rightarrow \Upsilon(nS)\gamma$ decays in each $\Upsilon(nS)$ sample, where the uncertainties are statistical only. |
Table_2.pdf [38 KiB] HiDef png [68 KiB] Thumbnail [36 KiB] tex code |

|
|
Summary of the relative systematic uncertainties, in %. |
Table_3.pdf [47 KiB] HiDef png [57 KiB] Thumbnail [25 KiB] tex code |

|
|
Production cross-section for the $\Upsilon(1S)$ resonance in ranges of $\Upsilon(1S)$ rapidity, where the muons are required to lie in the pseudorapidity range $2<\eta(\mu^\pm)<4.5$. The first uncertainties are statistical and the second are systematic. |
Table_4.pdf [28 KiB] HiDef png [21 KiB] Thumbnail [10 KiB] tex code |

|
|
Measured $d\sigma(\Upsilon(1S))/dy$, where the data have been corrected for the effect of the LHCb geometrical acceptance. The statistical and systematic uncertainties are combined in quadrature. |
Table_5.pdf [28 KiB] HiDef png [21 KiB] Thumbnail [10 KiB] tex code |

|
![HiDef png [48 KiB]](Directory_LHCb-PAPER-2015-011/hidef_Table_1.png)
![HiDef png [68 KiB]](Directory_LHCb-PAPER-2015-011/hidef_Table_2.png)
![HiDef png [57 KiB]](Directory_LHCb-PAPER-2015-011/hidef_Table_3.png)
![HiDef png [21 KiB]](Directory_LHCb-PAPER-2015-011/hidef_Table_4.png)
![HiDef png [21 KiB]](Directory_LHCb-PAPER-2015-011/hidef_Table_5.png)
Created on 27 April 2024.