Information
LHCb-PAPER-2015-018
CERN-PH-EP-2015-144
arXiv:1506.08634 [PDF]
(Submitted on 29 Jun 2015)
JHEP 01 (2016) 012
Inspire 1380184
Tools
Abstract
A search for $B_{(s)}^{0} \to K_{S}^{0} K^{*}(892)^{0}$ decays is performed using $pp$ collision data, corresponding to an integrated luminosity of $1.0 \text{fb}^{-1}$, collected with the LHCb detector at a centre-of-mass energy of $7 \text{TeV}$. The $B_{s}^{0} \to K_{S}^{0} K^{*}(892)^{0}$ decay is observed for the first time, with a significance of 7.1 standard deviations. The branching fraction is measured to be \begin{equation*} \mathcal{B}(B_{s}^{0} \to \bar{K}^{0} K^{*}(892)^{0}) + \mathcal{B}(B_{s}^{0} \to K^{0} \bar{K}^{*}(892)^{0}) = (16.4 \pm 3.4 \pm 2.3) \times 10^{-6},\\ \end{equation*} where the first uncertainty is statistical and the second is systematic. No evidence is found for the decay $B^{0} \to K_{S}^{0} K^{*}(892)^{0}$ and an upper limit is set on the branching fraction, $\mathcal{B}(B^{0} \to \bar{K}^{0} K^{*}(892)^{0}) + \mathcal{B}(B^{0} \to K^{0} \bar{K}^{*}(892)^{0}) < 0.96 \ \times 10^{-6}, $ at $90 \% $ confidence level. All results are consistent with Standard Model predictions.
Figures and captions
|
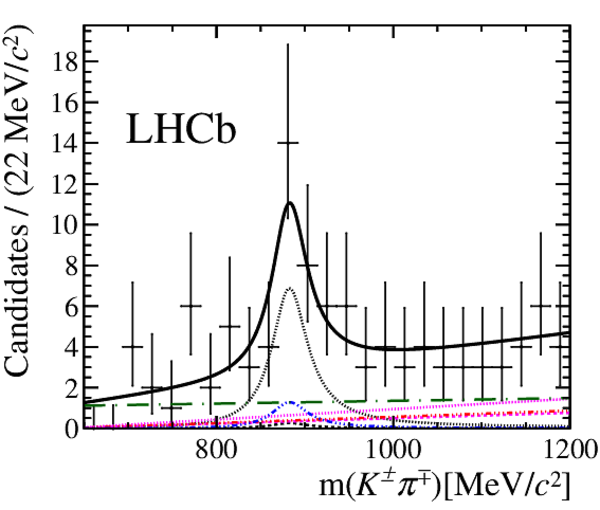
Distribution of (left) $ K ^0_{\rm\scriptscriptstyle S} K ^\pm \pi ^\mp $ mass and (right) $ K ^\pm$ {} $\pi ^\mp$ mass for signal candidates with fit results overlaid for (top) downstream and (bottom) long categories. The data are shown as black points with error bars. The overall fit is represented by the solid black line. The $ B ^0$ and $ B ^0_ s $ signal components are the black short-dashed and dotted lines respectively, while the non-resonant components are the magenta short-dashed and dotted lines. The partially reconstructed backgrounds are the red triple-dotted line ($ B \rightarrow Dh$) and the blue triple-dotted line ( $ B ^0_ s \rightarrow K ^{*0} \overline{K}^{*0}$ ). The combinatorial background is the green long-dash dotted line. |
Fig1a.pdf [23 KiB] HiDef png [360 KiB] Thumbnail [313 KiB] *.C file |

|
|
Fig1b.pdf [22 KiB] HiDef png [268 KiB] Thumbnail [229 KiB] *.C file |

|
|
|
Fig1c.pdf [22 KiB] HiDef png [284 KiB] Thumbnail [233 KiB] *.C file |

|
|
|
Fig1d.pdf [21 KiB] HiDef png [254 KiB] Thumbnail [218 KiB] *.C file |
|
|
|
Distribution of $ K ^0_{\rm\scriptscriptstyle S} \pi ^+ \pi ^- $ mass for signal candidates with fit results overlaid for (left) downstream and (right) long categories. The data are described by the black points with error bars. The overall fit is represented by the solid black line. The $ B ^0$ and $ B ^0_ s $ signal components are the black short-dashed and dotted lines. The misidentified $ B ^0_ s $ decay is the black dashed line, respectively. The partially reconstructed backgrounds are the red triple-dotted line ($ B \rightarrow Dh$), the blue triple-dotted line ($ B ^0 \rightarrow K ^0_{\rm\scriptscriptstyle S} \pi ^+ \pi ^- X$), the violet dash single-dotted line ($ B ^0 \rightarrow \eta' K ^0_{\rm\scriptscriptstyle S} $) and the pink short-dash single dotted line ($ B ^0 \rightarrow K ^0_{\rm\scriptscriptstyle S} \pi ^+ \pi ^- \gamma$). The combinatorial background is the green long-dash dotted line. Some of the contributions are small in the figures. |
Fig2a.pdf [23 KiB] HiDef png [355 KiB] Thumbnail [321 KiB] *.C file |

|
|
Fig2b.pdf [23 KiB] HiDef png [275 KiB] Thumbnail [244 KiB] *.C file |

|
|
|
Animated gif made out of all figures. |
PAPER-2015-018.gif Thumbnail |

|
![HiDef png [360 KiB]](Directory_LHCb-PAPER-2015-018/hidef_Fig1a.png)
![HiDef png [268 KiB]](Directory_LHCb-PAPER-2015-018/hidef_Fig1b.png)
![HiDef png [284 KiB]](Directory_LHCb-PAPER-2015-018/hidef_Fig1c.png)
![HiDef png [254 KiB]](Directory_LHCb-PAPER-2015-018/hidef_Fig1d.png)
![HiDef png [355 KiB]](Directory_LHCb-PAPER-2015-018/hidef_Fig2a.png)
![HiDef png [275 KiB]](Directory_LHCb-PAPER-2015-018/hidef_Fig2b.png)
Tables and captions
|
Signal yields obtained from the fits to $ K ^0_{\rm\scriptscriptstyle S} K ^\pm \pi ^\mp $ and $ K ^0_{\rm\scriptscriptstyle S} \pi ^+ \pi ^- $ mass distributions and corresponding efficiencies. Only statistical contributions to the uncertainty are reported. |
Table_1.pdf [60 KiB] HiDef png [50 KiB] Thumbnail [23 KiB] tex code |

|
|
Systematic uncertainties on the relative branching fraction measurement for the two $ K ^0_{\rm\scriptscriptstyle S}$ categories. The uncertainties are quoted as fractional contributions of the relative branching fraction and the total is the sum in quadrature of all contributions. |
Table_2.pdf [62 KiB] HiDef png [72 KiB] Thumbnail [34 KiB] tex code |

|
![HiDef png [50 KiB]](Directory_LHCb-PAPER-2015-018/hidef_Table_1.png)
![HiDef png [72 KiB]](Directory_LHCb-PAPER-2015-018/hidef_Table_2.png)
Created on 27 April 2024.