Information
LHCb-PAPER-2015-021
CERN-PH-EP-2015-118
arXiv:1505.04051 [PDF]
(Submitted on 15 May 2015)
Phys. Rev. D92 (2015) 052001
Inspire 1370436
Tools
Abstract
The associated production of a $W$ boson with a jet originating from either a light parton or heavy-flavor quark is studied in the forward region using proton-proton collisions. The analysis uses data corresponding to integrated luminosities of 1.0 and $2.0 {\rm fb}^{-1}$ collected with the LHCb detector at center-of-mass energies of 7 and 8 TeV, respectively. The $W$ bosons are reconstructed using the $W\to\mu\nu$ decay and muons with a transverse momentum, $p_{\rm T}$, larger than 20 GeV in the pseudorapidity range $2.0<\eta<4.5$. The partons are reconstructed as jets with $p_{\rm T} > 20$ GeV and $2.2 < \eta < 4.2$. The sum of the muon and jet momenta must satisfy $p_{\rm T} > 20$ GeV. The fraction of $W+$jet events that originate from beauty and charm quarks is measured, along with the charge asymmetries of the $W + b$ and $W + c$ production cross-sections. The ratio of the $W+$jet to $Z+$jet production cross-sections is also measured using the $Z\to\mu\mu$ decay. All results are in agreement with Standard Model predictions.
Figures and captions
|
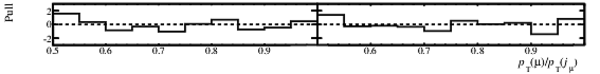
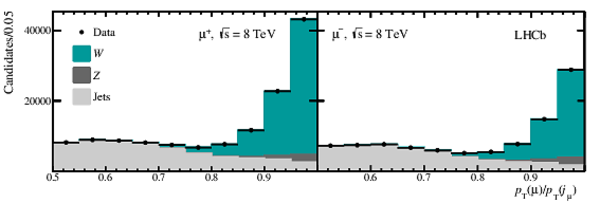
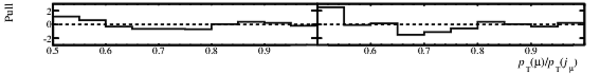
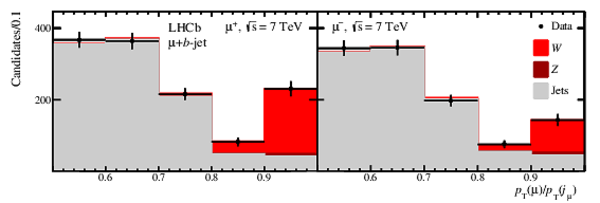
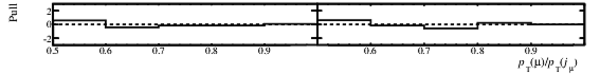
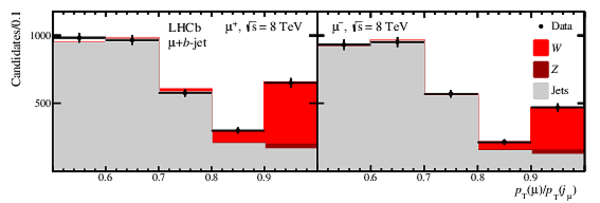
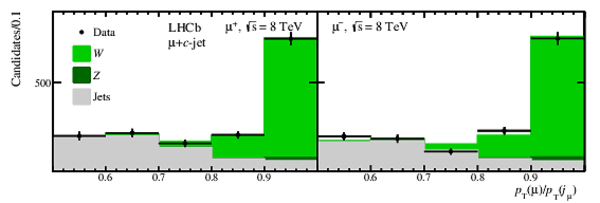
Distributions of $ p_{\rm T}$ (\mu)/ $p_{\rm T} (j_\mu)$ with fits overlaid from (top) $\sqrt{s}=7\mathrm{ Te V} $ and (bottom) $8\mathrm{ Te V} $ data for (left) $\mu^+$ and (right) $\mu^-$. |
Fig1a.pdf [16 KiB] HiDef png [85 KiB] Thumbnail [77 KiB] *.C file |

|
|
Fig1b.pdf [13 KiB] HiDef png [29 KiB] Thumbnail [19 KiB] *.C file |
|
|
|
Fig1c.pdf [15 KiB] HiDef png [83 KiB] Thumbnail [75 KiB] *.C file |
|
|
|
Fig1d.pdf [13 KiB] HiDef png [28 KiB] Thumbnail [19 KiB] *.C file |
|
|
|
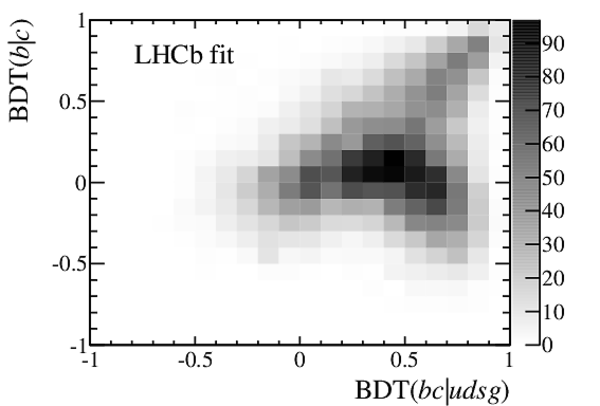
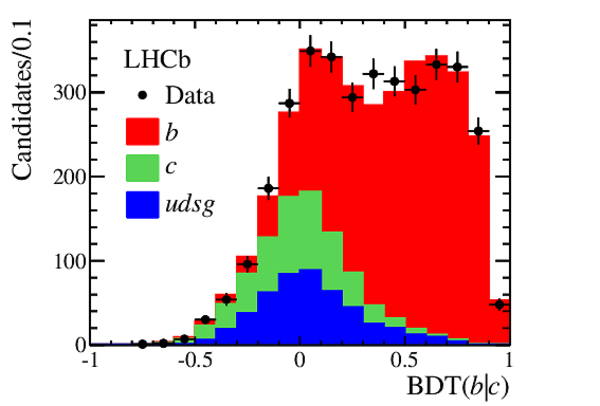
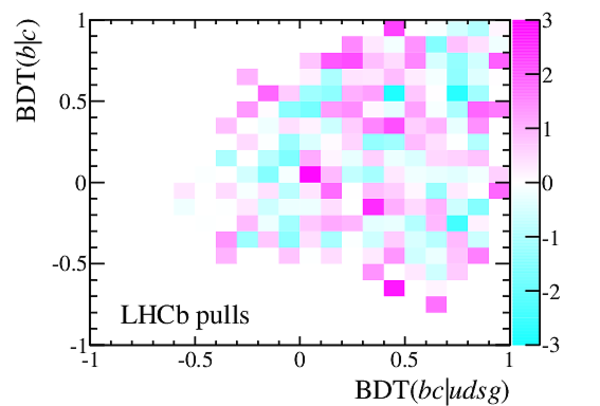
(top left) Two-dimensional SV-tag BDT distribution and (top right) fit for events in the subsample with $ p_{\rm T} (\mu)/ p_{\rm T} (j_\mu) > 0.9$, projected onto the (bottom left) $ {\rm BDT}(bc|udsg)$ and (bottom right) $ {\rm BDT}(b|c)$ axes. Combined data for $\sqrt{s}=7$ and 8 TeV for both muon charges are shown. |
Fig2a.pdf [21 KiB] HiDef png [106 KiB] Thumbnail [63 KiB] *.C file |

|
|
Fig2b.pdf [21 KiB] HiDef png [105 KiB] Thumbnail [62 KiB] *.C file |
|
|
|
Fig2c.pdf [15 KiB] HiDef png [118 KiB] Thumbnail [105 KiB] *.C file |

|
|
|
Fig2d.pdf [15 KiB] HiDef png [115 KiB] Thumbnail [104 KiB] *.C file |
|
|
|
Fig2e.pdf [21 KiB] HiDef png [140 KiB] Thumbnail [122 KiB] *.C file |
|
|
|
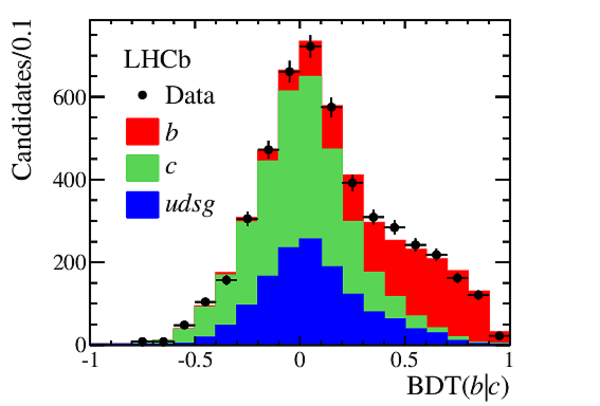
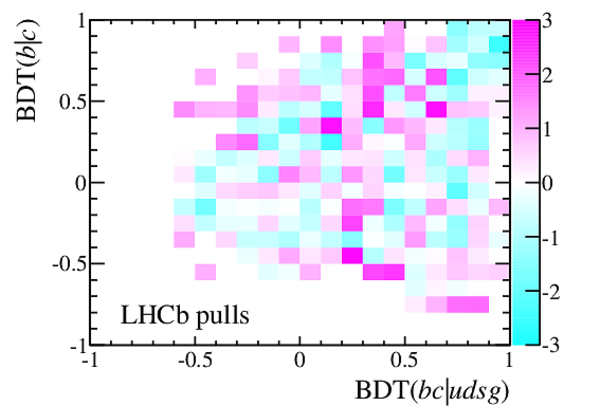
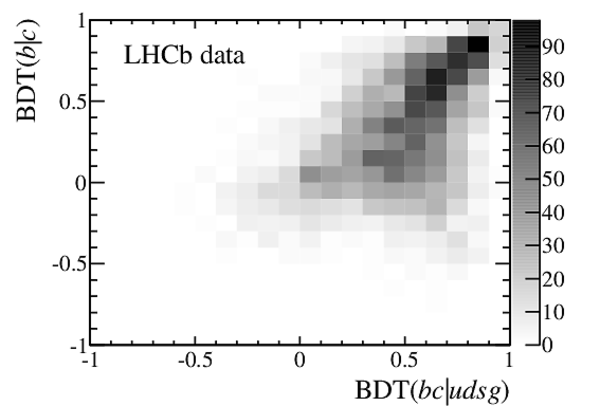
(top left) Two-dimensional SV-tag BDT distribution and (top right) fit for events in the subsample with $0.5 < p_{\rm T} (\mu)/ p_{\rm T} (j_\mu) < 0.6$, projected onto the (bottom left) $ {\rm BDT}(bc|udsg)$ and (bottom right) $ {\rm BDT}(b|c)$ axes. Combined data for $\sqrt{s}=7$ and 8 TeV for both muon charges are shown. |
Fig3a.pdf [20 KiB] HiDef png [104 KiB] Thumbnail [60 KiB] *.C file |
|
|
Fig3b.pdf [21 KiB] HiDef png [103 KiB] Thumbnail [60 KiB] *.C file |

|
|
|
Fig3c.pdf [14 KiB] HiDef png [114 KiB] Thumbnail [100 KiB] *.C file |

|
|
|
Fig3d.pdf [15 KiB] HiDef png [115 KiB] Thumbnail [105 KiB] *.C file |
|
|
|
Fig3e.pdf [21 KiB] HiDef png [134 KiB] Thumbnail [118 KiB] *.C file |
|
|
|
Projections of simultaneous fits of (left) $M_{\rm cor}$ and (right) SV track multiplicity for the SV-tagged subsample with $ {\rm BDT}(bc|udsg) > 0.2$ and $ p_{\rm T} (\mu)/ p_{\rm T} (j_\mu) > 0.9$. The highest $M_{\rm cor}$ bin includes candidates with $M_{\rm cor} > 10\mathrm{ Ge V} $. Combined data for $\sqrt{s}=7$ and 8 TeV for both muon charges are shown. |
Fig4a.pdf [15 KiB] HiDef png [116 KiB] Thumbnail [102 KiB] *.C file |

|
|
Fig4b.pdf [14 KiB] HiDef png [100 KiB] Thumbnail [88 KiB] *.C file |

|
|
|
Fits to $ p_{\rm T}$ (\mu)/ $p_{\rm T} (j_\mu)$ distributions for $b$-tagged data samples for $\sqrt{s} = 7$ and 8 TeV. |
Fig5a.pdf [15 KiB] HiDef png [75 KiB] Thumbnail [69 KiB] *.C file |
|
|
Fig5b.pdf [13 KiB] HiDef png [26 KiB] Thumbnail [18 KiB] *.C file |
|
|
|
Fig5c.pdf [15 KiB] HiDef png [75 KiB] Thumbnail [68 KiB] *.C file |
|
|
|
Fig5d.pdf [13 KiB] HiDef png [26 KiB] Thumbnail [18 KiB] *.C file |

|
|
|
Fits to $ p_{\rm T}$ (\mu)/ $p_{\rm T} (j_\mu)$ distributions for $c$-tagged data samples for $\sqrt{s} = 7$ and 8 TeV. |
Fig6a.pdf [15 KiB] HiDef png [78 KiB] Thumbnail [71 KiB] *.C file |

|
|
Fig6b.pdf [13 KiB] HiDef png [27 KiB] Thumbnail [18 KiB] *.C file |

|
|
|
Fig6c.pdf [15 KiB] HiDef png [74 KiB] Thumbnail [66 KiB] *.C file |
|
|
|
Fig6d.pdf [13 KiB] HiDef png [27 KiB] Thumbnail [18 KiB] *.C file |
|
|
|
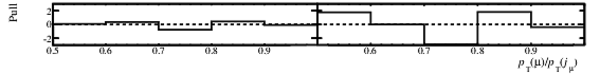
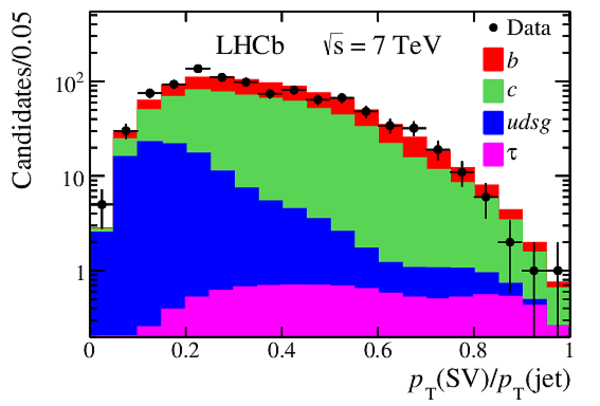
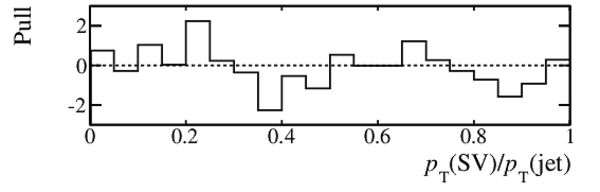
Fits to the $ p_{\rm T} (\mathrm{SV})/ p_{\rm T} (j)$ distributions in (left) $7\mathrm{ Te V} $ and (right) $8\mathrm{ Te V} $ data for candidates with $ p_{\rm T} (\mu)/ p_{\rm T} (j_\mu) > 0.9$ and $ {\rm BDT}(bc|udsg) > 0.2$. |
Fig7a.pdf [15 KiB] HiDef png [133 KiB] Thumbnail [128 KiB] *.C file |
|
|
Fig7b.pdf [15 KiB] HiDef png [132 KiB] Thumbnail [126 KiB] *.C file |
|
|
|
Fig7c.pdf [12 KiB] HiDef png [39 KiB] Thumbnail [23 KiB] *.C file |
|
|
|
Fig7d.pdf [12 KiB] HiDef png [40 KiB] Thumbnail [24 KiB] *.C file |

|
|
|
Animated gif made out of all figures. |
PAPER-2015-021.gif Thumbnail |

|
![HiDef png [85 KiB]](Directory_LHCb-PAPER-2015-021/hidef_Fig1a.png)
![HiDef png [29 KiB]](Directory_LHCb-PAPER-2015-021/hidef_Fig1b.png)
![HiDef png [83 KiB]](Directory_LHCb-PAPER-2015-021/hidef_Fig1c.png)
![HiDef png [28 KiB]](Directory_LHCb-PAPER-2015-021/hidef_Fig1d.png)
![HiDef png [106 KiB]](Directory_LHCb-PAPER-2015-021/hidef_Fig2a.png)
![HiDef png [105 KiB]](Directory_LHCb-PAPER-2015-021/hidef_Fig2b.png)
![HiDef png [118 KiB]](Directory_LHCb-PAPER-2015-021/hidef_Fig2c.png)
![HiDef png [115 KiB]](Directory_LHCb-PAPER-2015-021/hidef_Fig2d.png)
![HiDef png [140 KiB]](Directory_LHCb-PAPER-2015-021/hidef_Fig2e.png)
![HiDef png [104 KiB]](Directory_LHCb-PAPER-2015-021/hidef_Fig3a.png)
![HiDef png [103 KiB]](Directory_LHCb-PAPER-2015-021/hidef_Fig3b.png)
![HiDef png [114 KiB]](Directory_LHCb-PAPER-2015-021/hidef_Fig3c.png)
![HiDef png [115 KiB]](Directory_LHCb-PAPER-2015-021/hidef_Fig3d.png)
![HiDef png [134 KiB]](Directory_LHCb-PAPER-2015-021/hidef_Fig3e.png)
![HiDef png [116 KiB]](Directory_LHCb-PAPER-2015-021/hidef_Fig4a.png)
![HiDef png [100 KiB]](Directory_LHCb-PAPER-2015-021/hidef_Fig4b.png)
![HiDef png [75 KiB]](Directory_LHCb-PAPER-2015-021/hidef_Fig5a.png)
![HiDef png [26 KiB]](Directory_LHCb-PAPER-2015-021/hidef_Fig5b.png)
![HiDef png [75 KiB]](Directory_LHCb-PAPER-2015-021/hidef_Fig5c.png)
![HiDef png [26 KiB]](Directory_LHCb-PAPER-2015-021/hidef_Fig5d.png)
![HiDef png [78 KiB]](Directory_LHCb-PAPER-2015-021/hidef_Fig6a.png)
![HiDef png [27 KiB]](Directory_LHCb-PAPER-2015-021/hidef_Fig6b.png)
![HiDef png [74 KiB]](Directory_LHCb-PAPER-2015-021/hidef_Fig6c.png)
![HiDef png [27 KiB]](Directory_LHCb-PAPER-2015-021/hidef_Fig6d.png)
![HiDef png [133 KiB]](Directory_LHCb-PAPER-2015-021/hidef_Fig7a.png)
![HiDef png [132 KiB]](Directory_LHCb-PAPER-2015-021/hidef_Fig7b.png)
![HiDef png [39 KiB]](Directory_LHCb-PAPER-2015-021/hidef_Fig7c.png)
![HiDef png [40 KiB]](Directory_LHCb-PAPER-2015-021/hidef_Fig7d.png)
Tables and captions
|
Summary of signal yields. The two $Zj$ yields denote the charge of the muon on which the trigger requirement is made. The $Zj$ yields given are the numbers of candidates observed, while the $W$ boson yields are obtained from fits. The yield due to top quark production is subtracted in these results. |
Table_1.pdf [43 KiB] HiDef png [48 KiB] Thumbnail [22 KiB] tex code |

|
|
Systematic uncertainties. Relative uncertainties are given for cross section ratios and absolute uncertainties for charge asymmetries. |
Table_2.pdf [51 KiB] HiDef png [89 KiB] Thumbnail [41 KiB] tex code |

|
|
Summary of the results and SM predictions. For each measurement the first uncertainty is statistical, while the second is systematic. All results are reported within a fiducial region that requires a jet with $ p_{\rm T} > 20\mathrm{ Ge V} $ in the pseudorapidity range $2.2 < \eta < 4.2$, a muon with $ p_{\rm T} > 20\mathrm{ Ge V} $ in the pseudorapidity range $2.0 < \eta < 4.5$, $ p_{\rm T} (\mu+j) > 20\mathrm{ Ge V} $, and $\Delta R(\mu, j) > 0.5$. For $Z+$jet events both muons must fulfill the muon requirements and $60 < M(\mu\mu) < 120\mathrm{ Ge V} $; the $Z+$jet fiducial region does not require $ p_{\rm T} (\mu+j) > 20\mathrm{ Ge V} $. |
Table_3.pdf [69 KiB] HiDef png [85 KiB] Thumbnail [41 KiB] tex code |

|
![HiDef png [48 KiB]](Directory_LHCb-PAPER-2015-021/hidef_Table_1.png)
![HiDef png [89 KiB]](Directory_LHCb-PAPER-2015-021/hidef_Table_2.png)
![HiDef png [85 KiB]](Directory_LHCb-PAPER-2015-021/hidef_Table_3.png)
Created on 27 April 2024.