Measurement of the $B_s^0 \to \phi \phi$ branching fraction and search for the decay $B^0 \to \phi \phi$
[to restricted-access page]Information
LHCb-PAPER-2015-028
CERN-PH-EP-2015-198
arXiv:1508.00788 [PDF]
(Submitted on 04 Aug 2015)
JHEP 10 (2015) 053
Inspire 1386473
Tools
Abstract
Using a dataset corresponding to an integrated luminosity of 3.0 fb$^{-1}$ collected in $pp$ collisions at centre-of-mass energies of 7 and 8 TeV, the $B_s^0 \to \phi \phi$ branching fraction is measured to be \[ \mathcal{B}(B_s^0 \to \phi \phi) = ( 1.84 \pm 0.05 (\text{stat}) \pm 0.07 (\text{syst}) \pm 0.11 (f_s/f_d) \pm 0.12 (\text{norm}) ) \times 10^{-5}, \] where $f_s/f_d$ represents the ratio of the $B_s^0$ to $B^0$ production cross-sections, and the $B^0 \to \phi K^*(892)^0$ decay mode is used for normalization. This is the most precise measurement of this branching fraction to date, representing a factor five reduction in the statistical uncertainty compared with the previous best measurement. A search for the decay $B^0 \to \phi \phi$ is also made. No signal is observed, and an upper limit on the branching fraction is set as \[ \mathcal{B}(B^0 \to \phi \phi) < 2.8 \times 10^{-8} \] at 90 confidence level. This is a factor of seven improvement compared to the previous best limit.
Figures and captions
|
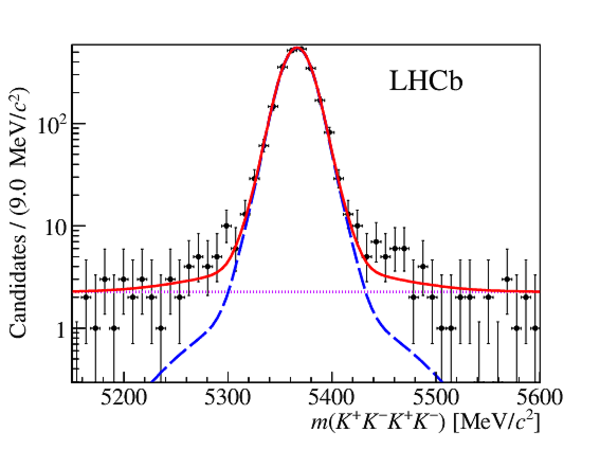
The $K^+K^-K^+K^-$ invariant mass distribution. The total fitted function as described in the text is shown by the (red) solid line, the $ B ^0_ s \rightarrow \phi\phi$ component by the (blue) long-dashed line, and the combinatorial background as the (purple) dotted line. |
Fig1.pdf [9 KiB] HiDef png [222 KiB] Thumbnail [166 KiB] *.C file |
|
|
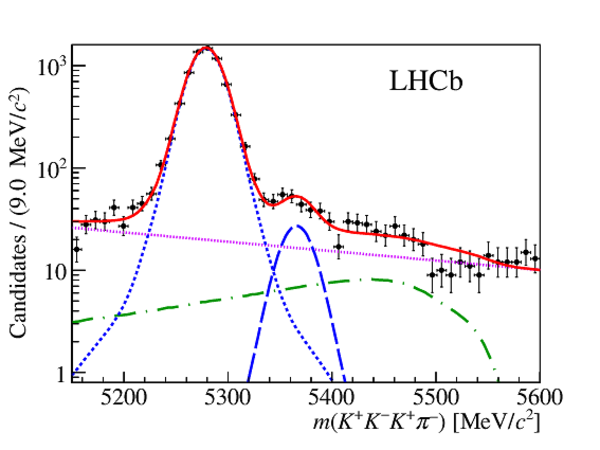
The $K^+K^-K^+\pi^-$ invariant mass distribution. The total fitted function is shown by the (red) solid line, the $ B ^0 \rightarrow \phi K ^* $ component by the (blue) short-dashed line, the $ B ^0_ s \rightarrow \phi\overline{ K }{} {}^* (892)^0$ component by the (blue) long-dashed line, the $\Lambda ^0_ b \rightarrow \phi p \pi^-$ and $\Lambda ^0_ b \rightarrow \phi p K^-$ contribution by the (green) dashed-dotted line, and the combinatoral background by the (purple) dotted line. |
Fig2.pdf [10 KiB] HiDef png [248 KiB] Thumbnail [182 KiB] *.C file |
|
|
The $K^+K^-K^+K^-$ invariant mass with the tight BDT selection applied. A fit to the total PDF as described in the text is shown as a (red) solid line, $ B ^0_ s \rightarrow \phi\phi$ as a (blue) long-dashed line, $ B ^0 \rightarrow \phi\phi$ as a (blue) short-dashed line, and the combinatorial background as a (purple) dotted line. |
Fig3.pdf [9 KiB] HiDef png [227 KiB] Thumbnail [176 KiB] *.C file |

|
|
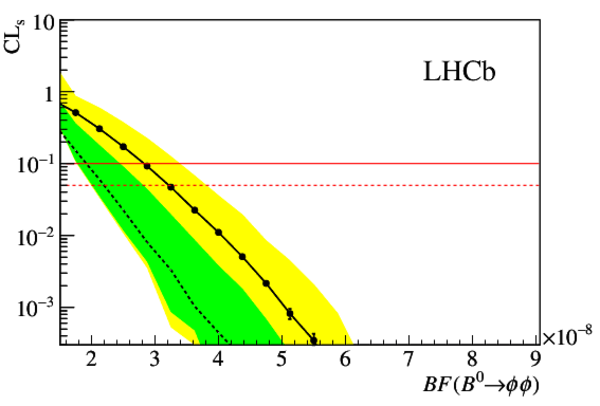
Results of the $\text{CL}_\text{s}$ scan as a function of the $ B ^0 \rightarrow \phi\phi$ branching fraction ($BF$). The observed $\text{CL}_\text{s}$ distribution is given by the (black) points and solid line, while the expected distribution is given by the (black) dashed line. The dark (green) and light (yellow) bands mark the $1\sigma$ and $2\sigma$ confidence regions on the expected $\text{CL}_\text{s}$. The upper limits at 90$ \%$ and 95$ \%$ confidence level are where the observed $\text{CL}_\text{s}$ line intercepts the (red) solid and dashed horizontal lines, respectively. |
Fig4.pdf [5 KiB] HiDef png [115 KiB] Thumbnail [82 KiB] *.C file |
|
|
Animated gif made out of all figures. |
PAPER-2015-028.gif Thumbnail |

|
![HiDef png [222 KiB]](Directory_LHCb-PAPER-2015-028/hidef_Fig1.png)
![HiDef png [248 KiB]](Directory_LHCb-PAPER-2015-028/hidef_Fig2.png)
![HiDef png [227 KiB]](Directory_LHCb-PAPER-2015-028/hidef_Fig3.png)
![HiDef png [115 KiB]](Directory_LHCb-PAPER-2015-028/hidef_Fig4.png)
Tables and captions
|
Predictions for the $ B ^0_ s \rightarrow \phi \phi$ branching fraction. The first and second uncertainties of Refs. [8,9] reflect the knowledge of CKM parameters and power corrections, respectively. |
Table_1.pdf [53 KiB] HiDef png [57 KiB] Thumbnail [27 KiB] tex code |

|
|
Summary of the systematic uncertainties on the measurement of the ratio of branching fractions $\mathcal{B}( B ^0_ s \rightarrow \phi \phi)/\mathcal{B}( B ^0 \rightarrow \phi K^*)$. |
Table_2.pdf [56 KiB] HiDef png [86 KiB] Thumbnail [39 KiB] tex code |

|
![HiDef png [57 KiB]](Directory_LHCb-PAPER-2015-028/hidef_Table_1.png)
![HiDef png [86 KiB]](Directory_LHCb-PAPER-2015-028/hidef_Table_2.png)
Created on 27 April 2024.