Information
LHCb-PAPER-2015-031
CERN-EP-2016-084
arXiv:1604.03475 [PDF]
(Submitted on 12 Apr 2016)
Eur. Phys. J. C76 (2016) 412
Inspire 1445118
Tools
Abstract
The oscillation frequency, $\Delta m_d$, of $B^0$ mesons is measured using semileptonic decays with a $D^-$ or $D^{*-}$ meson in the final state, in a data sample of $pp$ collisions collected by the LHCb detector corresponding to an integrated luminosity of 3.0$ fb^{-1}$. A combination of the two decay modes gives $\Delta m_d = (505.0 \pm 2.1 \pm 1.0) \rm ns^{-1}$, where the first uncertainty is statistical and the second is systematic. This is the most precise single measurement of this parameter. It is compatible with the current world average and has similar precision.
Figures and captions
|
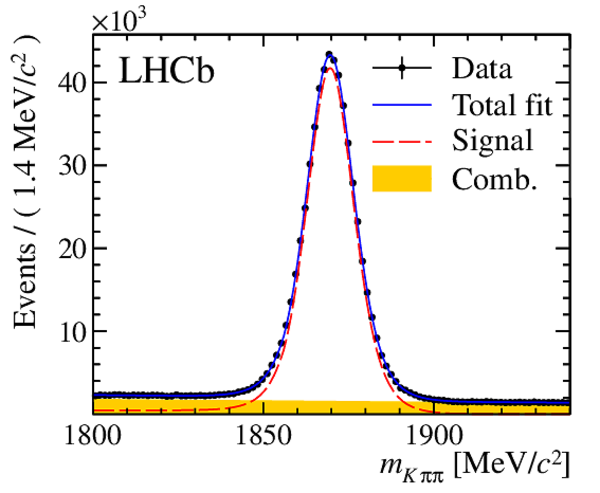
Distribution of $m_{K\pi\pi}$ for the $ B ^0 \rightarrow D ^- \mu ^+ \nu _\mu X$ candidates in (left) 2011 and (right) 2012 data. Projections of the fit function are superimposed (blue continuous line) for the full PDF and its components: (red dashed line) signal $ D ^-$ from $ B ^0$ or $ B ^+$ decays and (filled yellow area) combinatorial background. |
Fig1a.pdf [19 KiB] HiDef png [226 KiB] Thumbnail [178 KiB] *.C file |
|
|
Fig1b.pdf [19 KiB] HiDef png [220 KiB] Thumbnail [169 KiB] *.C file |

|
|
|
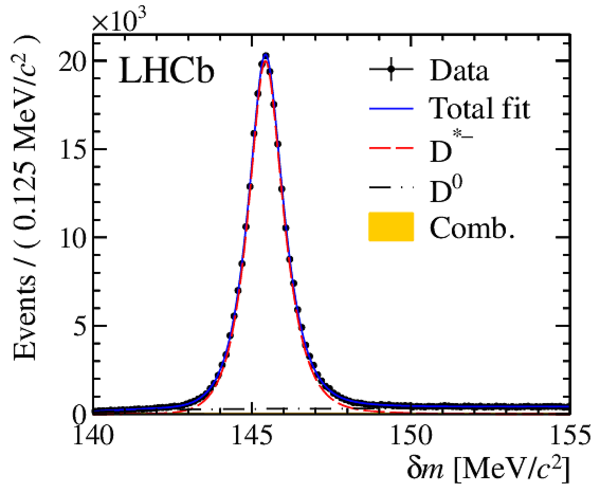
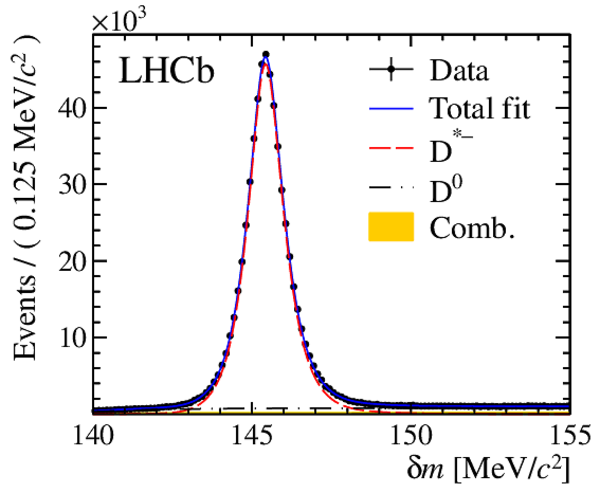
Distributions of (top) $m_{K\pi}$ and (bottom) $\delta m$ for $ B ^0 \rightarrow D ^{*-} \mu ^+ \nu _\mu X$ candidates in (left) 2011 and (right) 2012 data. Projections of the fit function are superimposed for (blue continuous line) the full PDF and its components: (red dashed line) signal $ D ^{*-}$ from $ B ^0$ or $ B ^+$ decays, (black dashed-dotted line) $\overline{ D }{} {}^0$ from $ B $ and (filled yellow area) combinatorial backgrounds. |
Fig2a.pdf [19 KiB] HiDef png [242 KiB] Thumbnail [193 KiB] *.C file |

|
|
Fig2b.pdf [20 KiB] HiDef png [246 KiB] Thumbnail [199 KiB] *.C file |

|
|
|
Fig2c.pdf [21 KiB] HiDef png [211 KiB] Thumbnail [170 KiB] *.C file |
|
|
|
Fig2d.pdf [21 KiB] HiDef png [213 KiB] Thumbnail [174 KiB] *.C file |
|
|
|
Fits to the output of the $ B ^+$ veto BDT for (top four plots) $ B ^0 \rightarrow D ^- \mu ^+ \nu _\mu X$ and (bottom four plots) $ B ^0 \rightarrow D ^{*-} \mu ^+ \nu _\mu X$ in 2012 data, for each tagging category. The filled red histogram, the dashed green line, and the continuous blue line correspond to background, signal, and total templates, respectively. The average mistag fraction per category increases when going from (a) to (d), and (e) to (h). |
Fig3a.pdf [29 KiB] HiDef png [322 KiB] Thumbnail [196 KiB] *.C file |

|
|
Fig3b.pdf [30 KiB] HiDef png [363 KiB] Thumbnail [206 KiB] *.C file |

|
|
|
Decay time distributions for (left) $ B ^0 \rightarrow D ^- \mu ^+ \nu _\mu X$ and (right) $ B ^0 \rightarrow D ^{*-} \mu ^+ \nu _\mu X$ in the category with lowest mistag in 2012 data. |
Fig4a.pdf [28 KiB] HiDef png [316 KiB] Thumbnail [254 KiB] *.C file |

|
|
Fig4b.pdf [29 KiB] HiDef png [303 KiB] Thumbnail [257 KiB] *.C file |

|
|
|
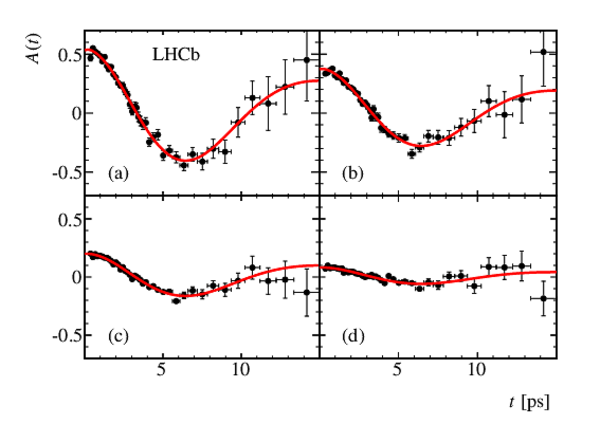
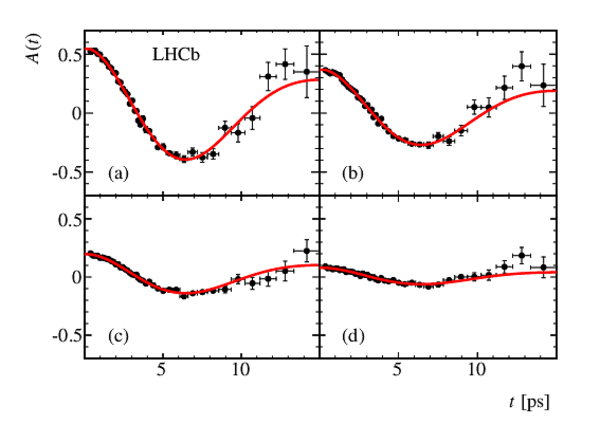
Mixing asymmetry projections in the four tagging categories for (top plots) $ B ^0 \rightarrow D ^- \mu ^+ \nu _\mu X$ and (bottom plots) $ B ^0 \rightarrow D ^{*-} \mu ^+ \nu _\mu X$ for 2011 data. The average mistag per category increases when going from (a) to (d), and from (e) to (h). |
Fig5a.pdf [26 KiB] HiDef png [183 KiB] Thumbnail [149 KiB] *.C file |
|
|
Fig5b.pdf [27 KiB] HiDef png [194 KiB] Thumbnail [156 KiB] *.C file |

|
|
|
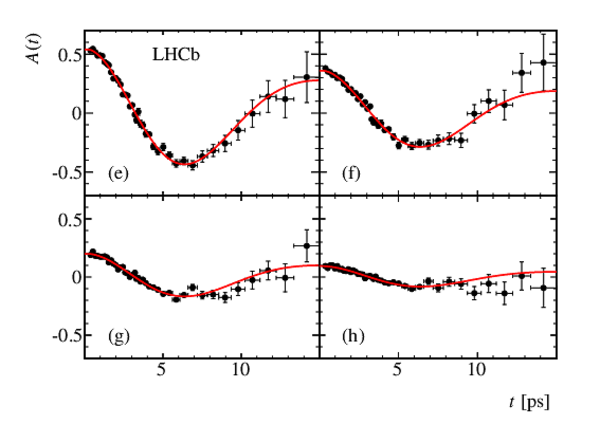
Mixing asymmetry projections in the four tagging categories for (top plots) $ B ^0 \rightarrow D ^- \mu ^+ \nu _\mu X$ and (bottom plots) $ B ^0 \rightarrow D ^{*-} \mu ^+ \nu _\mu X$ for 2012 data. The average mistag per category increases when going from (a) to (d), and from (e) to (h). |
Fig6a.pdf [25 KiB] HiDef png [170 KiB] Thumbnail [138 KiB] *.C file |
|
|
Fig6b.pdf [26 KiB] HiDef png [179 KiB] Thumbnail [143 KiB] *.C file |
|
|
|
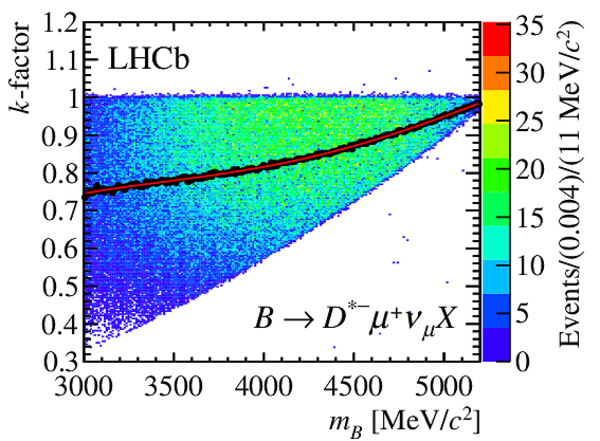
The $k$-factor distribution and the average $k$-factor (black points) as a function of the visible mass of the $ B$ candidate, in samples of simulated (top) $ B ^0 \rightarrow D ^- \mu ^+ \nu _\mu X$ and (bottom) $ B ^0 \rightarrow D ^{*-} \mu ^+ \nu _\mu X$ decays. Polynomial fits to the average $k$-factor are also shown as a solid (red) line. |
Fig7a.pdf [96 KiB] HiDef png [1 MiB] Thumbnail [504 KiB] *.C file |

|
|
Fig7b.pdf [103 KiB] HiDef png [1 MiB] Thumbnail [505 KiB] *.C file |
|
|
|
Animated gif made out of all figures. |
PAPER-2015-031.gif Thumbnail |

|
![HiDef png [226 KiB]](Directory_LHCb-PAPER-2015-031/hidef_Fig1a.png)
![HiDef png [220 KiB]](Directory_LHCb-PAPER-2015-031/hidef_Fig1b.png)
![HiDef png [242 KiB]](Directory_LHCb-PAPER-2015-031/hidef_Fig2a.png)
![HiDef png [246 KiB]](Directory_LHCb-PAPER-2015-031/hidef_Fig2b.png)
![HiDef png [211 KiB]](Directory_LHCb-PAPER-2015-031/hidef_Fig2c.png)
![HiDef png [213 KiB]](Directory_LHCb-PAPER-2015-031/hidef_Fig2d.png)
![HiDef png [322 KiB]](Directory_LHCb-PAPER-2015-031/hidef_Fig3a.png)
![HiDef png [363 KiB]](Directory_LHCb-PAPER-2015-031/hidef_Fig3b.png)
![HiDef png [316 KiB]](Directory_LHCb-PAPER-2015-031/hidef_Fig4a.png)
![HiDef png [303 KiB]](Directory_LHCb-PAPER-2015-031/hidef_Fig4b.png)
![HiDef png [183 KiB]](Directory_LHCb-PAPER-2015-031/hidef_Fig5a.png)
![HiDef png [194 KiB]](Directory_LHCb-PAPER-2015-031/hidef_Fig5b.png)
![HiDef png [170 KiB]](Directory_LHCb-PAPER-2015-031/hidef_Fig6a.png)
![HiDef png [179 KiB]](Directory_LHCb-PAPER-2015-031/hidef_Fig6b.png)
![HiDef png [1 MiB]](Directory_LHCb-PAPER-2015-031/hidef_Fig7a.png)
![HiDef png [1 MiB]](Directory_LHCb-PAPER-2015-031/hidef_Fig7b.png)
Tables and captions
|
Results for $\Delta m_{ d }$ measured in each mode for 2011 and 2012 data separately, for the total sample, and for the combination of the two modes. The quoted uncertainties for the separate samples are statistical only. For the total samples and the combination, they refer to statistical and total systematic uncertainties, respectively. |
Table_1.pdf [53 KiB] HiDef png [43 KiB] Thumbnail [20 KiB] tex code |

|
|
Sources of systematic uncertainties on $\Delta m_{ d }$ , separated into those that are correlated and uncorrelated between the two decay channels $ B ^0 \rightarrow D ^- \mu ^+ \nu _\mu X$ and $ B ^0 \rightarrow D ^{*-} \mu ^+ \nu _\mu X$ . |
Table_2.pdf [52 KiB] HiDef png [45 KiB] Thumbnail [19 KiB] tex code |

|
![HiDef png [43 KiB]](Directory_LHCb-PAPER-2015-031/hidef_Table_1.png)
![HiDef png [45 KiB]](Directory_LHCb-PAPER-2015-031/hidef_Table_2.png)
Created on 27 April 2024.