Information
LHCb-PAPER-2015-036
CERN-PH-EP-2015-202
arXiv:1508.04094 [PDF]
(Submitted on 17 Aug 2015)
Phys. Rev. Lett. 115 (2015) 161802
Inspire 1388185
Tools
Abstract
A search is presented for hidden-sector bosons, $\chi$, produced in the decay ${B^0 \to K^*(892)^0\chi}$, with $K^*(892)^0 \to K^{+}\pi^{-}$ and $\chi \to\mu^+\mu^-$. The search is performed using $pp$-collision data corresponding to 3.0 fb$^{-1}$ collected with the LHCb detector. No significant signal is observed in the accessible mass range $214 \leq m({\chi}) \leq 4350$ MeV, and upper limits are placed on the branching fraction product $\mathcal{B}(B^0 \to K^*(892)^0\chi)\times\mathcal{B}(\chi \to\mu^+\mu^-)$ as a function of the mass and lifetime of the $\chi$ boson. These limits are of the order of $10^{-9}$ for $\chi$ lifetimes less than 100 ps over most of the $m(\chi)$ range, and place the most stringent constraints to date on many theories that predict the existence of additional low-mass bosons.
Figures and captions
|
Feynman diagram for the decay $ B^0 \to K^{*0}\chi$ , with $\chi \to \mu^+\mu^-$. |
Fig1.pdf [40 KiB] HiDef png [43 KiB] Thumbnail [22 KiB] *.C file |

|
|
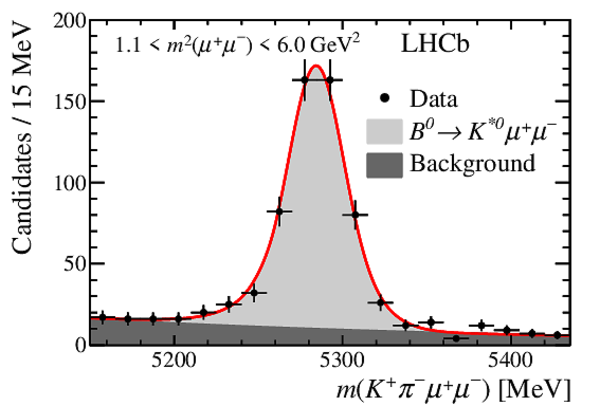
Invariant mass spectrum with fit overlaid for all prompt $ B^0 \to K^{*0}\mu^+\mu^-$ candidates with $1.1 < m^2(\mu^+\mu^-) < 6.0\mathrm{ Ge V} ^2$. |
Fig2.pdf [49 KiB] HiDef png [201 KiB] Thumbnail [173 KiB] *.C file |
|
|
Distribution of $ m(\mu^+\mu^-)$ in the (black) prompt and (red) displaced regions. The shaded bands denote regions where no search is performed due to (possible) resonance contributions. The $ {J\mskip -3mu/\mskip -2mu\psi\mskip 2mu}$ , $\psi(2S)$ and $\psi(3770)$ peaks are suppressed to better display the search region. |
Fig3.pdf [19 KiB] HiDef png [139 KiB] Thumbnail [126 KiB] *.C file |

|
|
Upper limits at 95% CL for (left axis) $\mathcal{B}( B^0 \to K^{*0}\chi (\mu^+\mu^-))/\mathcal{B}( B^0 \to K^{*0}\mu^+\mu^- )$, with $ B^0 \to K^{*0}\mu^+\mu^-$ in $1.1 < m^2(\mu^+\mu^-) < 6.0\mathrm{ Ge V} ^2$, and (right axis) $\mathcal{B}( B^0 \to K^{*0}\chi (\mu^+\mu^-))$. The sparseness of the data leads to rapid fluctuations in the limits. Excluding the region near $2m(\mu)$, the relative limits for $\tau < 10 ps $ are between 0.005--0.05 and all relative limits for $\tau \leq 1000 ps $ are less than one. |
Fig4.pdf [47 KiB] HiDef png [207 KiB] Thumbnail [130 KiB] *.C file |

|
|
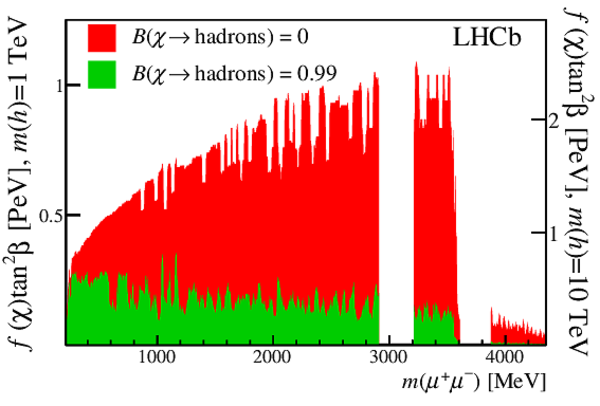
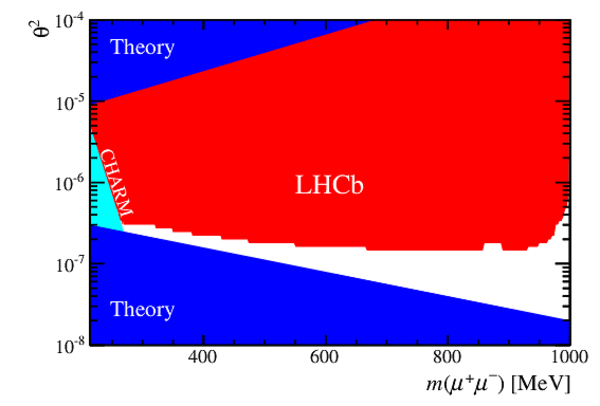
Exclusion regions at 95% CL: (left) constraints on the axion model of Ref. [20]; (right) constraints on the inflaton model of Ref. [52]. The regions excluded by the theory [52] and by the CHARM experiment [53] are also shown. |
Fig5a.pdf [27 KiB] HiDef png [262 KiB] Thumbnail [177 KiB] *.C file |
|
|
Fig5b.pdf [15 KiB] HiDef png [122 KiB] Thumbnail [88 KiB] *.C file |
|
|
|
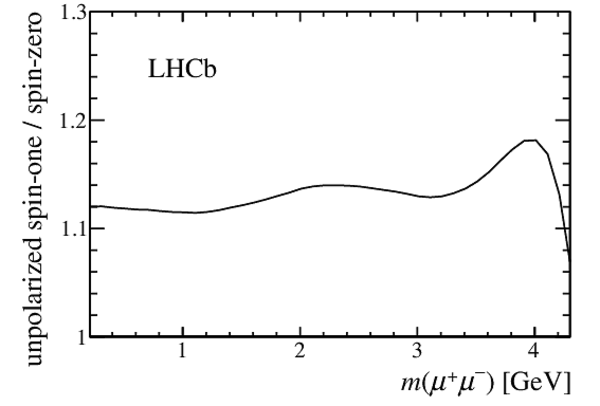
(left) Integral values for 1s, 2s and 2c relative to the value for 1c (see text for details). The dashed lines show the values in the absence of inefficiency. (right) Ratio of the efficiency for an unpolarized spin-one boson to that of a spin-zero boson. |
Fig1aS.pdf [14 KiB] HiDef png [148 KiB] Thumbnail [124 KiB] *.C file |

|
|
Fig1bS.pdf [13 KiB] HiDef png [73 KiB] Thumbnail [39 KiB] *.C file |
|
|
|
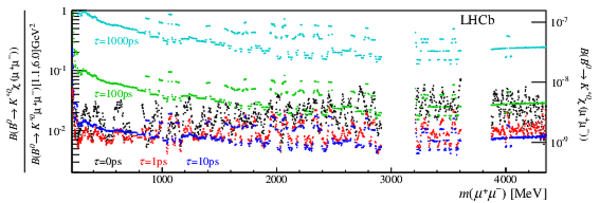
Upper limits at 95% CL for (left axis) $\mathcal{B}( B^0 \to K^{*0}\chi (\mu^+\mu^-))/\mathcal{B}( B^0 \to K^{*0}\mu^+\mu^- )$, with $ B^0 \to K^{*0}\mu^+\mu^-$ in $1.1 < m^2(\mu^+\mu^-) < 6.0\mathrm{ Ge V} ^2$, and (right axis) $\mathcal{B}( B^0 \to K^{*0}\chi (\mu^+\mu^-))$. Same as Fig. 4 in the Letter but including the $\tau = 0$ and 1 ps limits. |
Fig2S.pdf [67 KiB] HiDef png [329 KiB] Thumbnail [198 KiB] *.C file |

|
|
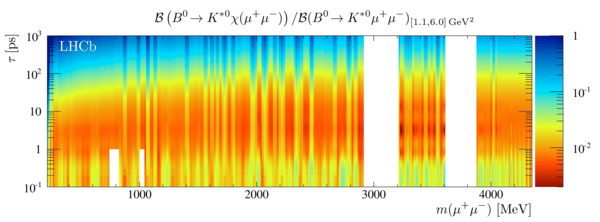
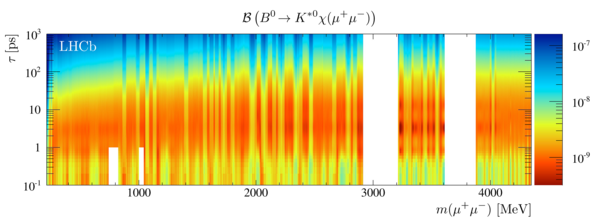
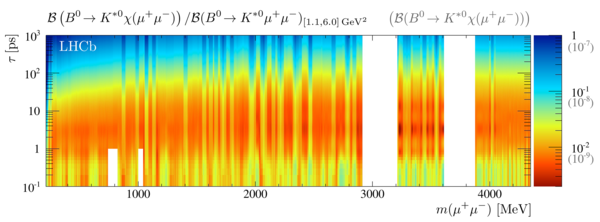
Upper limits at 95% CL for (top) $\mathcal{B}( B^0 \to K^{*0}\chi (\mu^+\mu^-))/\mathcal{B}( B^0 \to K^{*0}\mu^+\mu^- )$, with $ B^0 \to K^{*0}\mu^+\mu^-$ in $1.1 < m^2(\mu^+\mu^-) < 6.0\mathrm{ Ge V} ^2$, (middle) $\mathcal{B}( B^0 \to K^{*0}\chi (\mu^+\mu^-))$, and (bottom) both relative and absolute limits. The $\omega$ and $\phi$ resonance regions are only excluded in the prompt region. A utility is provided to obtain these limits for any $( m(\chi) ,\tau(\chi) )$ on the CERN Document Server. |
Fig3aS.pdf [525 KiB] HiDef png [1 MiB] Thumbnail [381 KiB] *.C file |

|
|
Fig3bS.pdf [494 KiB] HiDef png [1 MiB] Thumbnail [375 KiB] *.C file |

|
|
|
Fig3cS.pdf [608 KiB] HiDef png [1 MiB] Thumbnail [396 KiB] *.C file |

|
|
|
Animated gif made out of all figures. |
PAPER-2015-036.gif Thumbnail |

|
![HiDef png [43 KiB]](Directory_LHCb-PAPER-2015-036/hidef_Fig1.png)
![HiDef png [201 KiB]](Directory_LHCb-PAPER-2015-036/hidef_Fig2.png)
![HiDef png [139 KiB]](Directory_LHCb-PAPER-2015-036/hidef_Fig3.png)
![HiDef png [207 KiB]](Directory_LHCb-PAPER-2015-036/hidef_Fig4.png)
![HiDef png [262 KiB]](Directory_LHCb-PAPER-2015-036/hidef_Fig5a.png)
![HiDef png [122 KiB]](Directory_LHCb-PAPER-2015-036/hidef_Fig5b.png)
![HiDef png [148 KiB]](Directory_LHCb-PAPER-2015-036/hidef_Fig1aS.png)
![HiDef png [73 KiB]](Directory_LHCb-PAPER-2015-036/hidef_Fig1bS.png)
![HiDef png [329 KiB]](Directory_LHCb-PAPER-2015-036/hidef_Fig2S.png)
![HiDef png [1 MiB]](Directory_LHCb-PAPER-2015-036/hidef_Fig3aS.png)
![HiDef png [1 MiB]](Directory_LHCb-PAPER-2015-036/hidef_Fig3bS.png)
![HiDef png [1 MiB]](Directory_LHCb-PAPER-2015-036/hidef_Fig3cS.png)
Supplementary Material [file]
| Supplementary material full pdf |
supp.pdf [1 MiB] |

|
|
This ZIP file contains supplemetary material for the publication LHCb-PAPER-2015-036. The files are: supp.pdf: An overview of the extra figures. *.pdf, *.png, *.eps, *.C: The figures in variuous formats. Along with a simple macro for obtaining the upper limits (UL) for any value of mass and lifetime for LHCb-PAPER-2015-036 which uses files: lhcb_2015_036.root: ROOT file containing splines from which the limit can be obtained for any value of tau. getUL.C: ROOT macro defining getUL function. test.C: ROOT macro for testing the code locally. Use: It is recommended that you first try and do the following in ROOT (in the directory where this package is located): .L test.C test(100,0); test(100,1); The first command loads test.C. The second should produce a relative UL plot for tau = 100ps similar to Fig 2 of the Supplemental Material. The third command produces the same plot but for absolute limits. Please check a few of these to make sure that the file is being read in properly in ROOT. You should be able to ignore any streamer warnings from ROOT. Then, you can obtain the UL for any value of mass and lifetime by doing: .L getUL.C getUL(500,10,0) Etc. Please send any bug reports or requests to mwill@mit.edu. |
Fig1aS.pdf [14 KiB] HiDef png [148 KiB] Thumbnail [124 KiB] *C file |

|
|
Fig1bS.pdf [13 KiB] HiDef png [73 KiB] Thumbnail [39 KiB] *C file |

|
|
|
Fig2S.pdf [67 KiB] HiDef png [329 KiB] Thumbnail [198 KiB] *C file |
|
|
|
Fig3aS.pdf [525 KiB] HiDef png [1 MiB] Thumbnail [381 KiB] *C file |
|
|
|
Fig3bS.pdf [494 KiB] HiDef png [1 MiB] Thumbnail [375 KiB] *C file |
|
|
|
Fig3cS.pdf [608 KiB] HiDef png [1 MiB] Thumbnail [396 KiB] *C file |
|
![HiDef png [148 KiB]](Directory_LHCb-PAPER-2015-036/supplementary/hidef_Fig1aS.png)
![HiDef png [73 KiB]](Directory_LHCb-PAPER-2015-036/supplementary/hidef_Fig1bS.png)
![HiDef png [329 KiB]](Directory_LHCb-PAPER-2015-036/supplementary/hidef_Fig2S.png)
![HiDef png [1 MiB]](Directory_LHCb-PAPER-2015-036/supplementary/hidef_Fig3aS.png)
![HiDef png [1 MiB]](Directory_LHCb-PAPER-2015-036/supplementary/hidef_Fig3bS.png)
![HiDef png [1 MiB]](Directory_LHCb-PAPER-2015-036/supplementary/hidef_Fig3cS.png)
Created on 27 April 2024.