Measurements of long-range near-side angular correlations in $\sqrt{s_{\text{NN}}}=5$TeV proton-lead collisions in the forward region
[to restricted-access page]Information
LHCb-PAPER-2015-040
CERN-PH-EP-2015-308
arXiv:1512.00439 [PDF]
(Submitted on 01 Dec 2015)
Phys. Lett. B762 (2016) 473
Inspire 1407486
Tools
Abstract
Two-particle angular correlations are studied in proton-lead collisions at a nucleon-nucleon centre-of-mass energy of $\sqrt{s_{\text{NN}}}=5$TeV, collected with the LHCb detector at the LHC. The analysis is based on data recorded in two beam configurations, in which either the direction of the proton or that of the lead ion is analysed. The correlations are measured in the laboratory system as a function of relative pseudorapidity, $\Delta\eta$, and relative azimuthal angle, $\Delta\phi$, for events in different classes of event activity and for different bins of particle transverse momentum. In high-activity events a long-range correlation on the near side, $\Delta\phi \approx 0$, is observed in the pseudorapidity range $2.0<\eta<4.9$. This measurement of long-range correlations on the near side in proton-lead collisions extends previous observations into the forward region up to $\eta=4.9$. The correlation increases with growing event activity and is found to be more pronounced in the direction of the lead beam. However, the correlation in the direction of the lead and proton beams are found to be compatible when comparing events with similar absolute activity in the direction analysed.
Figures and captions
|
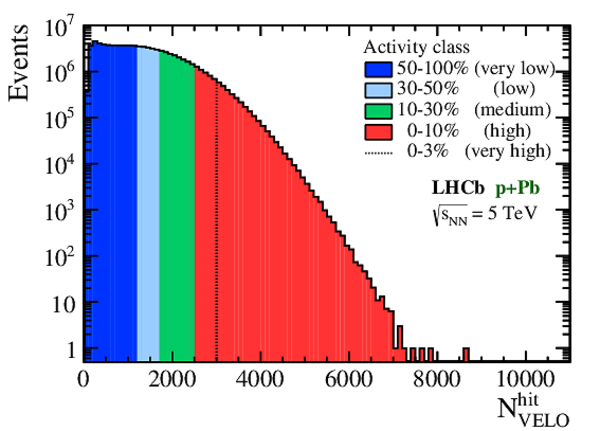
Hit-multiplicity distribution in the VELO for selected events of the minimum-bias samples in the (left) $ p + \mathrm{Pb}$ and (right) $\mathrm{Pb} + p$ configurations. The activity classes are defined as fractions of the full distribution, as indicated by colours (shades). The $0-3\%$ class is a sub-sample of the $0-10\%$ class. |
EventB[..].pdf [19 KiB] HiDef png [240 KiB] Thumbnail [204 KiB] *.C file |
|
|
EventB[..].pdf [19 KiB] HiDef png [249 KiB] Thumbnail [205 KiB] *.C file |

|
|
|
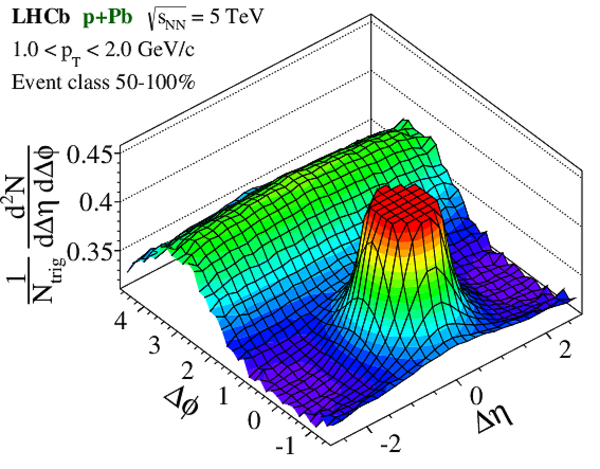
Two-particle correlation functions for events recorded in the $ p + \mathrm{Pb}$ configuration, showing the (left) low and (right) high event-activity classes. The analysed pairs of prompt charged particles are selected in a $p_{\mathrm{ T}}$ range of $1-2 {\mathrm{ Ge V /}c} $. The near-side peak around $\Delta\eta=\Delta\phi=0$ is truncated in the histograms. |
cor_pA[..].pdf [48 KiB] HiDef png [979 KiB] Thumbnail [508 KiB] *.C file |
|
|
cor_pA[..].pdf [51 KiB] HiDef png [965 KiB] Thumbnail [501 KiB] *.C file |

|
|
|
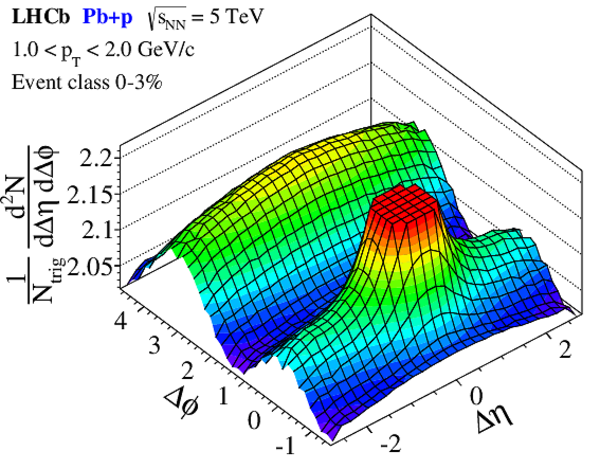
Two-particle correlation functions for events recorded in the $\mathrm{Pb} + p$ configuration, showing the (left) low and (right) high event-activity classes. The analysed pairs of prompt charged particles are selected in a $p_{\mathrm{ T}}$ range of $1-2 {\mathrm{ Ge V /}c} $. The near-side peak around $(\Delta\eta=\Delta\phi=0)$ is truncated in the histograms. |
cor_Ap[..].pdf [48 KiB] HiDef png [983 KiB] Thumbnail [504 KiB] *.C file |

|
|
cor_Ap[..].pdf [51 KiB] HiDef png [982 KiB] Thumbnail [524 KiB] *.C file |
|
|
|
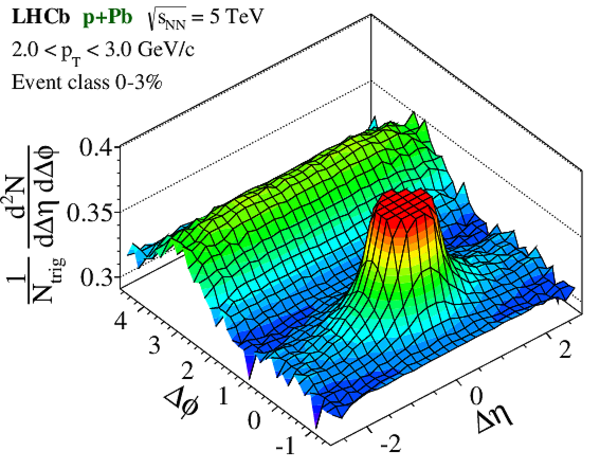
Two-particle correlation functions for events recorded in the $ p + \mathrm{Pb}$ (left) and $\mathrm{Pb} + p$ (right) configurations, showing the $0-3\%$ event-activity class. The analysed pairs of prompt charged particles are selected in a $p_{\mathrm{ T}}$ range of $2-3 {\mathrm{ Ge V /}c} $. The near-side peak around $(\Delta\eta=\Delta\phi=0)$ is truncated in each histogram. |
cor_pA[..].pdf [48 KiB] HiDef png [952 KiB] Thumbnail [487 KiB] *.C file |
|
|
cor_Ap[..].pdf [49 KiB] HiDef png [927 KiB] Thumbnail [483 KiB] *.C file |

|
|
|
One-dimensional correlation yield as a function of $\Delta\phi$ obtained from the ZYAM-method by averaging over $2.0<\Delta\eta<2.9$. The subtracted yields are presented for $\sqrt{s_{\scriptscriptstyle N N}}=5\mathrm{ Te V} $ proton-lead collisions recorded in $ p + \mathrm{Pb}$ (full green circles) and $\mathrm{Pb} + p$ (open blue circles) configurations. The ZYAM constant is given in each panel. Event classes are compared for low to very-high activities from top to bottom, and different intervals of increasing $ p_{\mathrm{ T}} $ from left to right. Only statistical uncertainties are shown. Error bars are often smaller than the markers. |
PaperP[..].pdf [73 KiB] HiDef png [1 MiB] Thumbnail [860 KiB] *.C file |

|
|
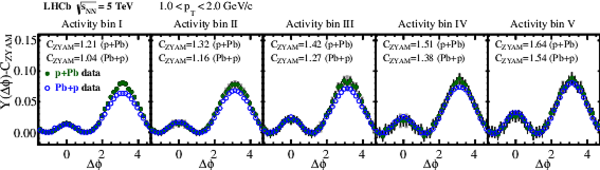
One-dimensional correlation yield as a function of $\Delta\phi$ obtained from the ZYAM-method by averaging the two-dimensional distribution over $2.0<\Delta\eta<2.9$. The results for the $ p + \mathrm{Pb}$ and $\mathrm{Pb} + p$ samples are compared in five event classes which probe identical activities in the range $2.0<\eta<4.9$. The measured hit-multiplicities of the $ p + \mathrm{Pb}$ sample are scaled to agree with the hit-multiplicities of the $\mathrm{Pb} + p$ sample. The uncertainty band represents the systematic limitation of the scaling procedure. The error bars represent the statistical uncertainty. |
subbin[..].pdf [40 KiB] HiDef png [290 KiB] Thumbnail [180 KiB] *.C file |
|
|
Animated gif made out of all figures. |
PAPER-2015-040.gif Thumbnail |

|
![HiDef png [240 KiB]](Directory_LHCb-PAPER-2015-040/hidef_EventBinning_VCl_pA.png)
![HiDef png [249 KiB]](Directory_LHCb-PAPER-2015-040/hidef_EventBinning_VCl_Ap.png)
![HiDef png [979 KiB]](Directory_LHCb-PAPER-2015-040/hidef_cor_pA_pt1_low.png)
![HiDef png [965 KiB]](Directory_LHCb-PAPER-2015-040/hidef_cor_pA_pt1_high.png)
![HiDef png [983 KiB]](Directory_LHCb-PAPER-2015-040/hidef_cor_Ap_pt1_low.png)
![HiDef png [982 KiB]](Directory_LHCb-PAPER-2015-040/hidef_cor_Ap_pt1_high.png)
![HiDef png [952 KiB]](Directory_LHCb-PAPER-2015-040/hidef_cor_pA_pt2_high.png)
![HiDef png [927 KiB]](Directory_LHCb-PAPER-2015-040/hidef_cor_Ap_pt2_high.png)
![HiDef png [1 MiB]](Directory_LHCb-PAPER-2015-040/hidef_PaperProjections.png)
![HiDef png [290 KiB]](Directory_LHCb-PAPER-2015-040/hidef_subbinProjection_scaledpA_pT1.png)
Tables and captions
|
Relative event-activity classes defined by the VELO -hit multiplicity, $\mathcal N^{\mathrm{hit}}_{{\scriptscriptstyle \text{VELO }}}$ , of an event. The classes are defined as fractions of the $\mathcal N^{\mathrm{hit}}_{{\scriptscriptstyle \text{VELO }}}$ distribution for minimum-bias recorded events in the $ p + \mathrm{Pb}$ or $\mathrm{Pb} + p$ configuration. The $0-3\%$ class is a sub-sample of the $0-10\%$ class. For illustration purposes the average number, $\langle N_{ch} \rangle_{\text{MC}}$, of prompt charged particles with $ p >2 {\mathrm{ Ge V /}c} $, $ p_{\mathrm{ T}} >0.15 {\mathrm{ Ge V /}c} $ and $2.0<\eta<4.9$ is listed for events simulated with the Hijing event generator. Statistical uncertainties are negligible. |
Table_1.pdf [55 KiB] HiDef png [70 KiB] Thumbnail [31 KiB] tex code |

|
|
Common absolute activity bins for the $ p + \mathrm{Pb}$ and $\mathrm{Pb} + p$ samples. The activity of $ p + \mathrm{Pb}$ events is scaled to match the same activity ranges of $\mathrm{Pb} + p$ events, as explained in the text. For illustration purposes the average number, $\langle N_{ch} \rangle_{\text{MC}}$, of prompt charged particles with $ p >2 {\mathrm{ Ge V /}c} $, $ p_{\mathrm{ T}} >0.15 {\mathrm{ Ge V /}c} $ and $2.0<\eta<4.9$ is listed for events simulated with the Hijing event generator. The uncertainties are due to the scaling factor of $0.77 \pm 0.08$. Statistical uncertainties are negligible. |
Table_2.pdf [54 KiB] HiDef png [72 KiB] Thumbnail [36 KiB] tex code |

|
![HiDef png [70 KiB]](Directory_LHCb-PAPER-2015-040/hidef_Table_1.png)
![HiDef png [72 KiB]](Directory_LHCb-PAPER-2015-040/hidef_Table_2.png)
Created on 27 April 2024.