Measurements of prompt charm production cross-sections in $pp$ collisions at $\sqrt{s}$ = 13 TeV
[to restricted-access page]Information
LHCb-PAPER-2015-041
CERN-PH-EP-2015-272
arXiv:1510.01707 [PDF]
(Submitted on 06 Oct 2015)
JHEP 05 (2017) 074
Inspire 1396331
Tools
Abstract
Production cross-sections of prompt charm mesons are measured with the first data from $pp$ collisions at the LHC at a centre-of-mass energy of $13 \mathrm{TeV}$. The data sample corresponds to an integrated luminosity of $4.98 \pm 0.19 \mathrm{pb}^{-1}$ collected by the LHCb experiment. The production cross-sections of $D^{0}$, $D^{+}$, $D_{s}^{+}$, and $D^{*+}$ mesons are measured in bins of charm meson transverse momentum, $p_{\mathrm{T}}$, and rapidity, $y$, and cover the range $0 < p_{\mathrm{T}} < 15 \mathrm{GeV}/c$ and $2.0 < y < 4.5$. The inclusive cross-sections for the four mesons, including charge conjugation, within the range of $1 < p_{\mathrm{T}} < 8 \mathrm{GeV}/c$ are found to be \begin{equation} \sigma(pp \to D^{0} X) = 2072 \pm 2 \pm 124 \mu\mathrm{b}\\ \sigma(pp \to D^{+} X) = 834 \pm 2 \pm \phantom{1}78 \mu\mathrm{b}\\ \sigma(pp \to D_{s}^{+} X) = 353 \pm 9 \pm \phantom{1}76 \mu\mathrm{b}\\ \sigma(pp \to D^{*+} X) = 784 \pm 4 \pm \phantom{1}87 \mu\mathrm{b} \end{equation} where the uncertainties are due to statistical and systematic uncertainties, respectively.
Figures and captions
|
Distributions for selected $ D^{0} \to K^{-} \pi^{+} $ candidates: (left) $ K^{-} \pi^{+} $ invariant mass and (right) $\ln{\chi^2_{\rm IP}}$ for a mass window of $\pm\SI{20}{\mevcc}$ around the nominal $ D^{0}$ mass. The sum of the simultaneous likelihood fits in each $ ( p_{\mathrm{T}} , y )$ bin is shown, with components as indicated in the legends. |
Fig1a.pdf [60 KiB] HiDef png [361 KiB] Thumbnail [191 KiB] *.C file |

|
|
Fig1b.pdf [65 KiB] HiDef png [345 KiB] Thumbnail [187 KiB] *.C file |

|
|
|
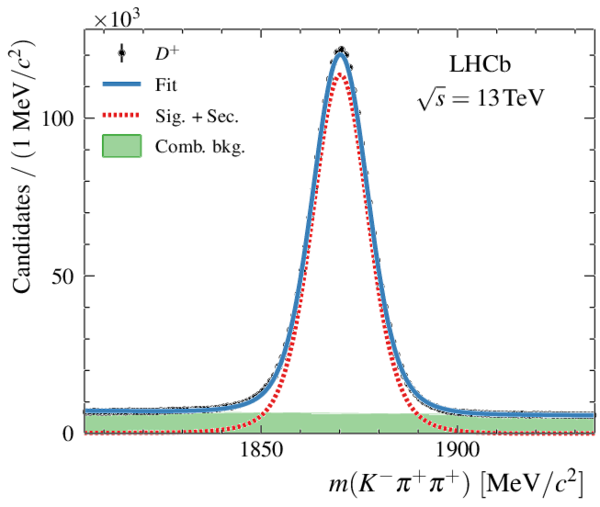
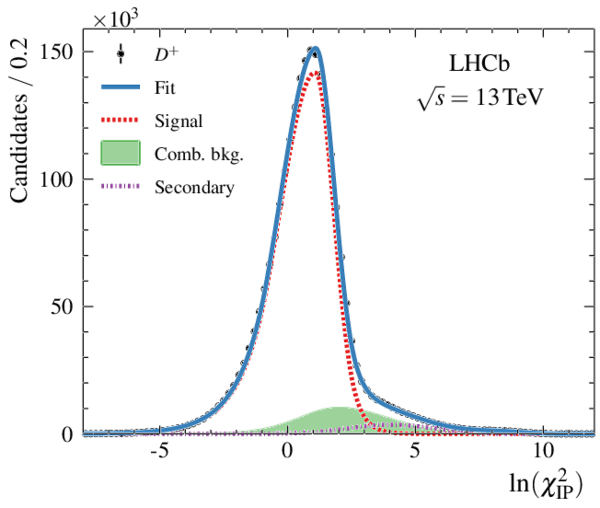
Distributions for selected $ D^{+} \to K^{-} \pi^{+} \pi^{+} $ candidates: (left) $ K^{-} \pi^{+} \pi^{+} $ invariant mass and (right) $\ln{\chi^2_{\rm IP}}$ for a mass window of $\pm\SI{20}{\mevcc}$ around the nominal $ D^{+}$ mass. The sum of the simultaneous likelihood fits in each $ ( p_{\mathrm{T}} , y )$ bin is shown, with components as indicated in the legends. |
Fig2a.pdf [60 KiB] HiDef png [355 KiB] Thumbnail [189 KiB] *.C file |
|
|
Fig2b.pdf [65 KiB] HiDef png [344 KiB] Thumbnail [185 KiB] *.C file |
|
|
|
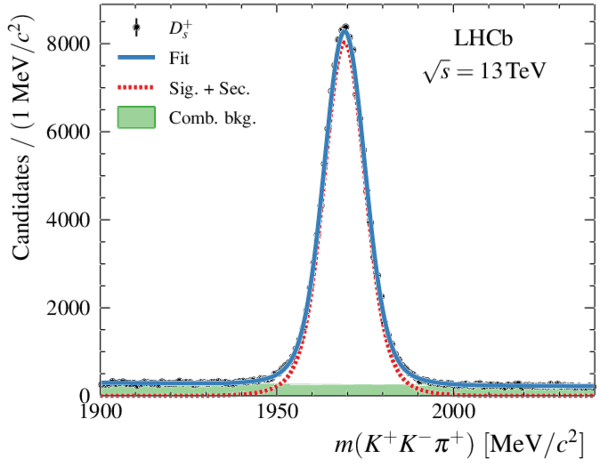
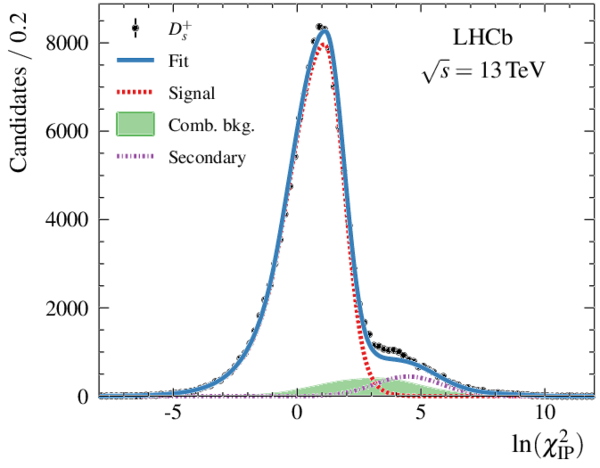
Distributions for selected $ D_{ s }^{+} \to ( K^{-} K^{+} )_{\phi}\pi^{+} $ candidates: (left) $ K^{+} K^{-} \pi^{+} $ invariant mass and (right) $\ln{\chi^2_{\rm IP}}$ for a mass window of $\pm\SI{20}{\mevcc}$ around the nominal $ D_{ s }^{+}$ mass. The sum of the simultaneous likelihood fits in each $ ( p_{\mathrm{T}} , y )$ bin is shown, with components as indicated in the legends. |
Fig3a.pdf [61 KiB] HiDef png [332 KiB] Thumbnail [181 KiB] *.C file |
|
|
Fig3b.pdf [65 KiB] HiDef png [329 KiB] Thumbnail [181 KiB] *.C file |
|
|
|
Distributions for selected $ D^{*+} \to D^{0} \pi^{+} $ candidates, with $ D^{0} \to K^{-} \pi^{+} $ : (left) $\Delta{m} = m( D^{*+} ) - m( D^{0} )$ for a mass window of $\pm\SI{20}{\mevcc}$ around the nominal $ D^{0}$ mass and (right) $\ln{\chi^2_{\rm IP}}$ with an additional mass window of $\pm\SI{3}{\mevcc}$ around the nominal $ D^{*+}$ {}- $ D^{0}$ mass difference. The sum of the simultaneous likelihood fits in each $ ( p_{\mathrm{T}} , y )$ bin is shown, with components as indicated in the legends. |
Fig4a.pdf [80 KiB] HiDef png [372 KiB] Thumbnail [198 KiB] *.C file |

|
|
Fig4b.pdf [65 KiB] HiDef png [363 KiB] Thumbnail [193 KiB] *.C file |

|
|
|
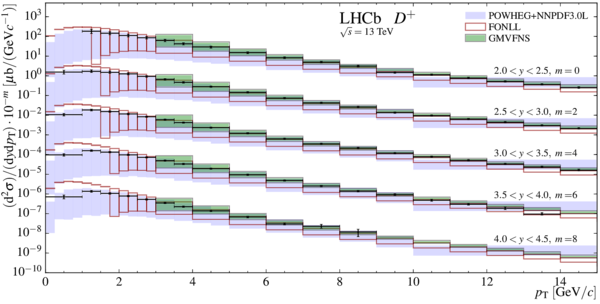
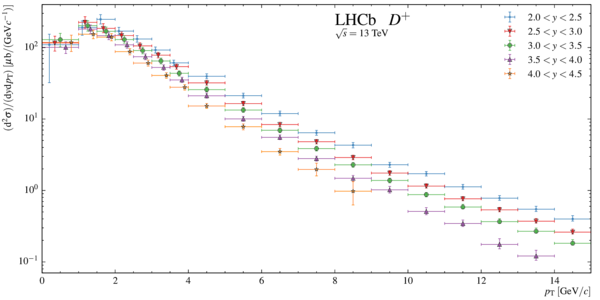
Measurements and predictions for the absolute prompt (top) $ D^{0}$ , and (bottom) $ D^{+}$ cross-sections at $\sqrt{s} = \SI{13}{\TeV}$ . Each set of measurements and predictions in a given rapidity bin is offset by a multiplicative factor $10^{-m}$, where the factor $m$ is shown on the plots. The boxes indicate the $\pm1\sigma$ uncertainty band on the theory predictions. In cases where this band spans more than two orders of magnitude only its upper edge is indicated. |
Fig5a.pdf [242 KiB] HiDef png [264 KiB] Thumbnail [178 KiB] *.C file |

|
|
Fig5b.pdf [243 KiB] HiDef png [269 KiB] Thumbnail [181 KiB] *.C file |
|
|
|
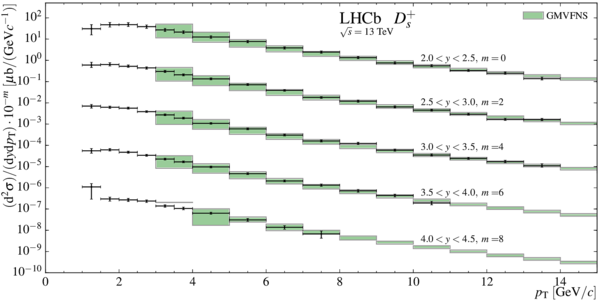
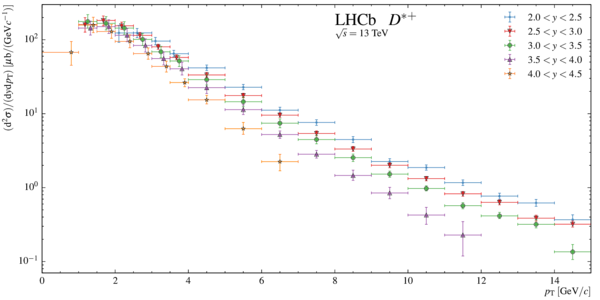
Measurements and predictions for the absolute prompt (top) $ D_{ s }^{+}$ , and (bottom) $ D^{*+}$ cross-sections at $\sqrt{s} = \SI{13}{\TeV}$ . Each set of measurements and predictions in a given rapidity bin is offset by a multiplicative factor $10^{-m}$, where the factor $m$ is shown on the plots. The boxes indicate the $\pm1\sigma$ uncertainty band on the theory predictions. In cases where this band spans more than two orders of magnitude only its upper edge is indicated. |
Fig6a.pdf [234 KiB] HiDef png [164 KiB] Thumbnail [126 KiB] *.C file |
|
|
Fig6b.pdf [239 KiB] HiDef png [219 KiB] Thumbnail [151 KiB] *.C file |

|
|
|
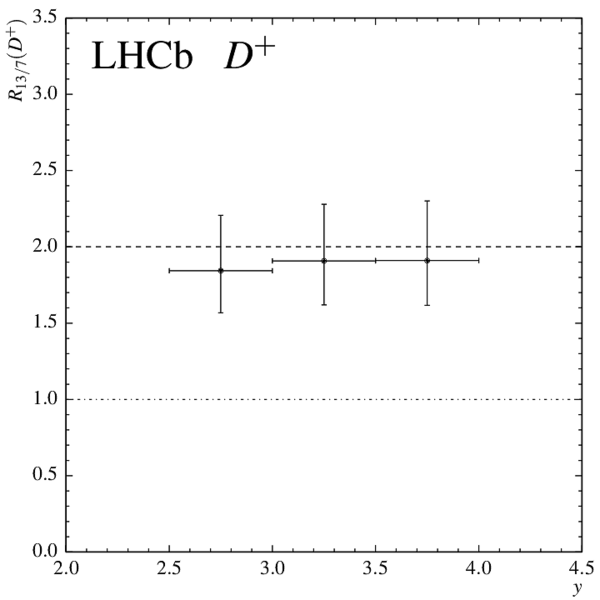
Measurements and predictions of the prompt $ D^{0}$ , $ D^{+}$ , $ D_{ s }^{+}$ , and $ D^{*+}$ cross-section ratios. The dash-dotted lines indicate the unit ratio for each of the rapidity intervals and the dashed lines indicate a ratio of two. Each set of measurements and predictions in a given rapidity bin is offset by an additive constant $m$, which is shown on the plot. No prediction is available for the $ D_{ s }^{+}$ ratio. |
Fig7a.pdf [172 KiB] HiDef png [374 KiB] Thumbnail [330 KiB] *.C file |

|
|
Fig7b.pdf [171 KiB] HiDef png [323 KiB] Thumbnail [298 KiB] *.C file |

|
|
|
Fig7c.pdf [167 KiB] HiDef png [180 KiB] Thumbnail [111 KiB] *.C file |

|
|
|
Fig7d.pdf [200 KiB] HiDef png [314 KiB] Thumbnail [279 KiB] *.C file |

|
|
|
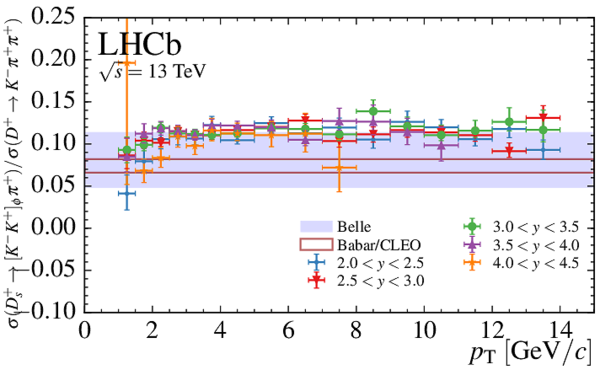
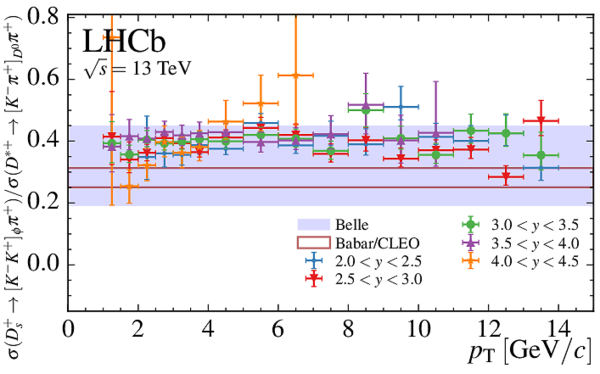
Ratios of cross-section-times-branching-fraction measurements of (top) $ D^{+}$ , (middle) $ D_{ s }^{+}$ , and (bottom) $ D^{*+}$ mesons with respect to the $ D^{0}$ measurements. The bands indicate the corresponding ratios computed using measurements from $ e^{+} e^{-} $ collider experiments [40,41,42]. The ratios are given as a function of $ p_{\mathrm{T}}$ and different symbols indicate different ranges in $ y$ . The notation $\sigma( D \to f )$ is shorthand for $\sigma(D)\times\mathcal{B} ( D \to f )$ . |
Fig8a.pdf [236 KiB] HiDef png [257 KiB] Thumbnail [182 KiB] *.C file |

|
|
Fig8b.pdf [236 KiB] HiDef png [273 KiB] Thumbnail [205 KiB] *.C file |

|
|
|
Fig8c.pdf [236 KiB] HiDef png [278 KiB] Thumbnail [198 KiB] *.C file |

|
|
|
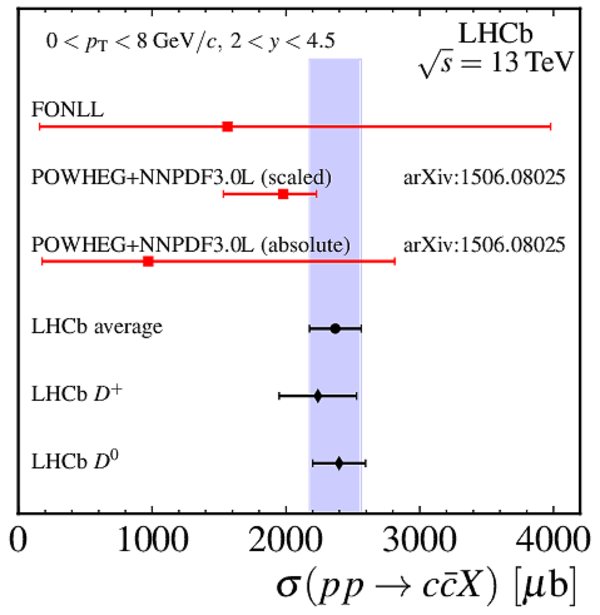
Integrated cross-sections (black diamonds), their average (black circle and blue band) and theory predictions (red squares) [1,2] are shown (left) based on the $ D^{0}$ and $ D^{+}$ for $0 < p_{\mathrm{T}} < \SI{8}{\gevc}$ and (right) for measurements based on all four mesons for $1 < p_{\mathrm{T}} < \SI{8}{\gevc}$. The "absolute" predictions are based on calculations of the \SI{13}{\TeV} cross-section, while the "scaled" predictions are based on calculations of the $13$ to \SI{7}{\TeV} ratio multiplied with the LHCb measurement at \SI{7}{\TeV} [16]. |
Fig9a.pdf [225 KiB] HiDef png [240 KiB] Thumbnail [223 KiB] *.C file |
|
|
Fig9b.pdf [225 KiB] HiDef png [165 KiB] Thumbnail [154 KiB] *.C file |

|
|
|
Ratios of cross-section-times-branching-fraction measurements of (top) $ D^{*+}$ , and (middle) $ D_{ s }^{+}$ mesons with respect to $ D^{+}$ cross-sections, and (bottom) $ D_{ s }^{+}$ over $ D^{*+}$ mesons. The bands indicate the corresponding ratios computed using measurements from $ e^{+} e^{-} $ collider experiments [40,41,42]. The ratios are given as a function of $ p_{\mathrm{T}}$ and different symbols indicate different ranges in $ y$ . The notation $\sigma( D \to f )$ is shorthand for $\sigma(D)\times\mathcal{B} ( D \to f )$ . |
Fig10a.pdf [236 KiB] HiDef png [280 KiB] Thumbnail [202 KiB] *.C file |

|
|
Fig10b.pdf [236 KiB] HiDef png [274 KiB] Thumbnail [204 KiB] *.C file |
|
|
|
Fig10c.pdf [236 KiB] HiDef png [281 KiB] Thumbnail [199 KiB] *.C file |
|
|
|
Animated gif made out of all figures. |
PAPER-2015-041.gif Thumbnail |

|
![HiDef png [361 KiB]](Directory_LHCb-PAPER-2015-041/hidef_Fig1a.png)
![HiDef png [345 KiB]](Directory_LHCb-PAPER-2015-041/hidef_Fig1b.png)
![HiDef png [355 KiB]](Directory_LHCb-PAPER-2015-041/hidef_Fig2a.png)
![HiDef png [344 KiB]](Directory_LHCb-PAPER-2015-041/hidef_Fig2b.png)
![HiDef png [332 KiB]](Directory_LHCb-PAPER-2015-041/hidef_Fig3a.png)
![HiDef png [329 KiB]](Directory_LHCb-PAPER-2015-041/hidef_Fig3b.png)
![HiDef png [372 KiB]](Directory_LHCb-PAPER-2015-041/hidef_Fig4a.png)
![HiDef png [363 KiB]](Directory_LHCb-PAPER-2015-041/hidef_Fig4b.png)
![HiDef png [264 KiB]](Directory_LHCb-PAPER-2015-041/hidef_Fig5a.png)
![HiDef png [269 KiB]](Directory_LHCb-PAPER-2015-041/hidef_Fig5b.png)
![HiDef png [164 KiB]](Directory_LHCb-PAPER-2015-041/hidef_Fig6a.png)
![HiDef png [219 KiB]](Directory_LHCb-PAPER-2015-041/hidef_Fig6b.png)
![HiDef png [374 KiB]](Directory_LHCb-PAPER-2015-041/hidef_Fig7a.png)
![HiDef png [323 KiB]](Directory_LHCb-PAPER-2015-041/hidef_Fig7b.png)
![HiDef png [180 KiB]](Directory_LHCb-PAPER-2015-041/hidef_Fig7c.png)
![HiDef png [314 KiB]](Directory_LHCb-PAPER-2015-041/hidef_Fig7d.png)
![HiDef png [257 KiB]](Directory_LHCb-PAPER-2015-041/hidef_Fig8a.png)
![HiDef png [273 KiB]](Directory_LHCb-PAPER-2015-041/hidef_Fig8b.png)
![HiDef png [278 KiB]](Directory_LHCb-PAPER-2015-041/hidef_Fig8c.png)
![HiDef png [240 KiB]](Directory_LHCb-PAPER-2015-041/hidef_Fig9a.png)
![HiDef png [165 KiB]](Directory_LHCb-PAPER-2015-041/hidef_Fig9b.png)
![HiDef png [280 KiB]](Directory_LHCb-PAPER-2015-041/hidef_Fig10a.png)
![HiDef png [274 KiB]](Directory_LHCb-PAPER-2015-041/hidef_Fig10b.png)
![HiDef png [281 KiB]](Directory_LHCb-PAPER-2015-041/hidef_Fig10c.png)
Tables and captions
|
Prompt signal yields in the fully selected dataset, summed over all ( $ p_{\mathrm{T}}$ , $ y$ ) bins in which a measurement is made. |
Table_1.pdf [51 KiB] HiDef png [95 KiB] Thumbnail [40 KiB] tex code |

|
|
Systematic uncertainties expressed as fractions of the cross-section measurements, in percent. Uncertainties that are computed bin-by-bin are expressed as ranges giving the minimum to maximum values. Ranges for the correlations between $ p_{\mathrm{T}}$ - $ y$ bins and between modes are also given, expressed in percent. |
Table_2.pdf [47 KiB] HiDef png [79 KiB] Thumbnail [35 KiB] tex code |

|
|
Prompt charm production cross-sections in the kinematic ranges given. The computation of the extrapolation factors is described in the text. The first uncertainty on the cross-section is statistical, and the second is systematic and includes the contribution from the extrapolation factor. No extrapolation factor is given for $ D^{+} _{( s )}$ as a measurement is available in every bin of the integrated phase space. |
Table_3.pdf [60 KiB] HiDef png [101 KiB] Thumbnail [51 KiB] tex code |

|
|
Ratios of integrated cross-section-times-branching-fraction measurements in the kinematic range $1 < p_{\mathrm{T}} < \SI{8}{\gevc}$ and $2 < y < 4.5$. The first uncertainty on the ratio is statistical and the second is systematic. The notation $\sigma( D \to f )$ is shorthand for $\sigma(D)\times\mathcal{B} ( D \to f )$ . |
[Error creating the table] |
![HiDef png [95 KiB]](Directory_LHCb-PAPER-2015-041/hidef_Table_1.png)
![HiDef png [79 KiB]](Directory_LHCb-PAPER-2015-041/hidef_Table_2.png)
![HiDef png [101 KiB]](Directory_LHCb-PAPER-2015-041/hidef_Table_3.png)
Supplementary Material [file]
| Supplementary material full pdf |
supple[..].pdf [564 KiB] |

|
|
This ZIP file contains supplemetary material for the publication LHCb-PAPER-2014-041. The files are: supplementary.pdf : An overview of the extra figures *.pdf, *.png, *.jpg, *.eps : The figures in various formats |
Fig1a-S.pdf [270 KiB] HiDef png [131 KiB] Thumbnail [92 KiB] *C file |

|
|
Fig1b-S.pdf [273 KiB] HiDef png [144 KiB] Thumbnail [98 KiB] *C file |
|
|
|
Fig2a-S.pdf [269 KiB] HiDef png [137 KiB] Thumbnail [96 KiB] *C file |

|
|
|
Fig2b-S.pdf [268 KiB] HiDef png [138 KiB] Thumbnail [95 KiB] *C file |
|
|
|
Fig3a-S.pdf [167 KiB] HiDef png [66 KiB] Thumbnail [38 KiB] *C file |

|
|
|
Fig3b-S.pdf [167 KiB] HiDef png [65 KiB] Thumbnail [37 KiB] *C file |
|
|
|
Fig4a-S.pdf [166 KiB] HiDef png [65 KiB] Thumbnail [34 KiB] *C file |

|
|
|
Fig4b-S.pdf [165 KiB] HiDef png [64 KiB] Thumbnail [33 KiB] *C file |
|
![HiDef png [131 KiB]](Directory_LHCb-PAPER-2015-041/supplementary/hidef_Fig1a-S.png)
![HiDef png [144 KiB]](Directory_LHCb-PAPER-2015-041/supplementary/hidef_Fig1b-S.png)
![HiDef png [137 KiB]](Directory_LHCb-PAPER-2015-041/supplementary/hidef_Fig2a-S.png)
![HiDef png [138 KiB]](Directory_LHCb-PAPER-2015-041/supplementary/hidef_Fig2b-S.png)
![HiDef png [66 KiB]](Directory_LHCb-PAPER-2015-041/supplementary/hidef_Fig3a-S.png)
![HiDef png [65 KiB]](Directory_LHCb-PAPER-2015-041/supplementary/hidef_Fig3b-S.png)
![HiDef png [65 KiB]](Directory_LHCb-PAPER-2015-041/supplementary/hidef_Fig4a-S.png)
![HiDef png [64 KiB]](Directory_LHCb-PAPER-2015-041/supplementary/hidef_Fig4b-S.png)
Created on 27 April 2024.