Model-independent measurement of mixing parameters in $D^0 \to K_S^0 \pi^+ \pi^-$ decays
[to restricted-access page]Information
LHCb-PAPER-2015-042
CERN-PH-EP-2015-249
arXiv:1510.01664 [PDF]
(Submitted on 06 Oct 2015)
JHEP 04 (2016) 033
Inspire 1396327
Tools
Abstract
The first model-independent measurement of the charm mixing parameters in the decay $D^0 \to K_S \pi^+ \pi^-$ is reported, using a sample of $pp$ collision data recorded by the LHCb experiment, corresponding to an integrated luminosity of 1.0 fb$^{-1}$ at a centre-of-mass energy of 7 TeV. The measured values are \begin{eqnarray*} x &=& (-0.86 \pm 0.53 \pm 0.17) \times 10^{-2}, \\ y &=& (+0.03 \pm 0.46 \pm 0.13) \times 10^{-2}, \end{eqnarray*} where the first uncertainties are statistical and include small contributions due to the external input for the strong phase measured by the CLEO collaboration, and the second uncertainties are systematic.
Figures and captions
|
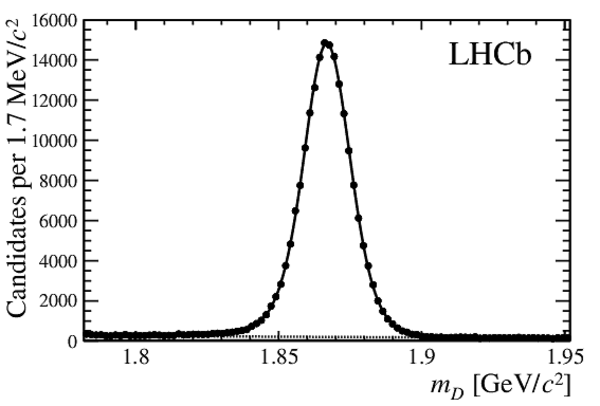
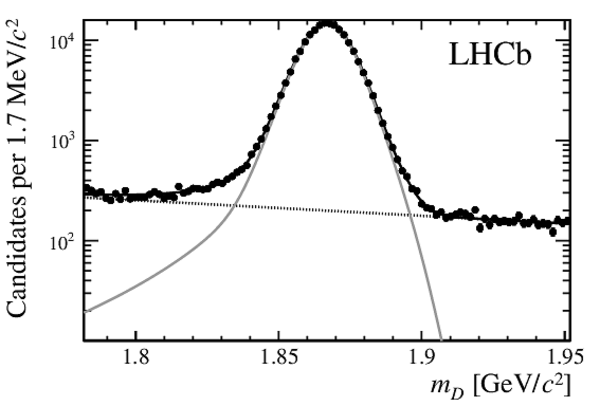
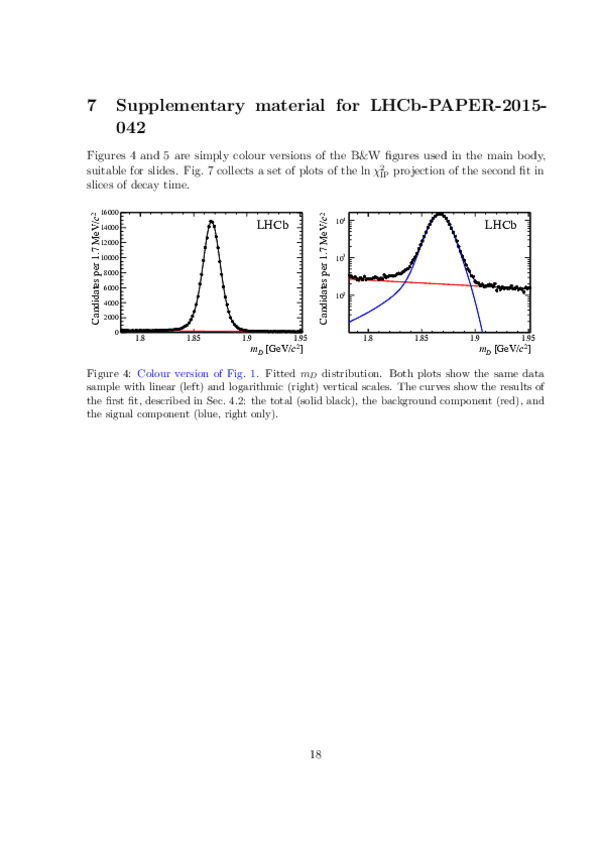
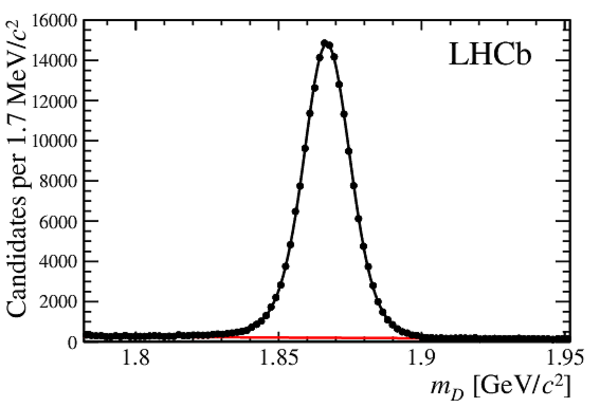
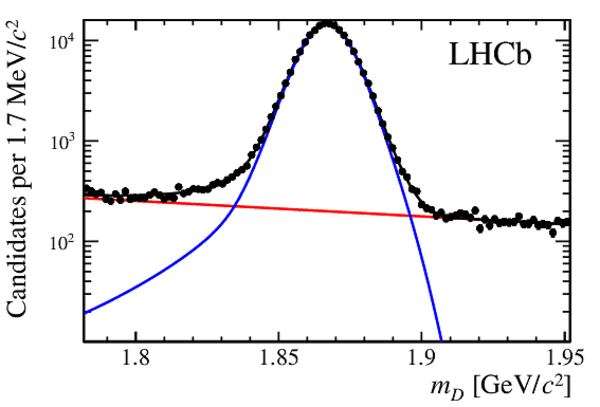
Fitted $m_D$ distribution. Both plots show the same data sample with (left) linear and (right) logarithmic vertical scales. The curves show the results of the first fit, described in Sec. 4.2: the total (solid black), the background component (dotted), and the signal component (grey, right only). |
paperP[..].pdf [33 KiB] HiDef png [111 KiB] Thumbnail [62 KiB] *.C file |
|
|
paperP[..].pdf [43 KiB] HiDef png [114 KiB] Thumbnail [59 KiB] *.C file |
|
|
|
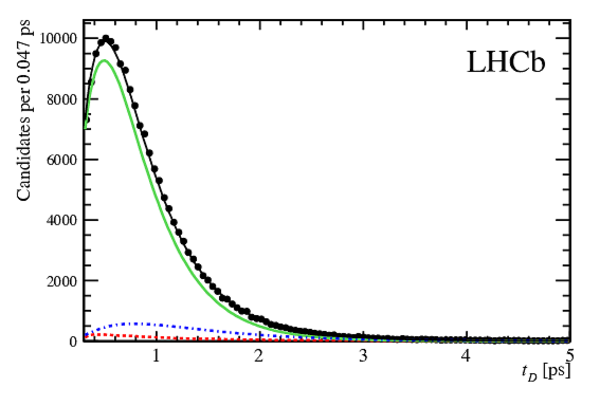
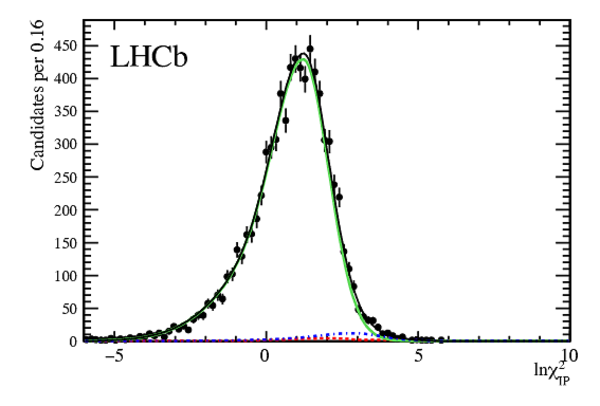
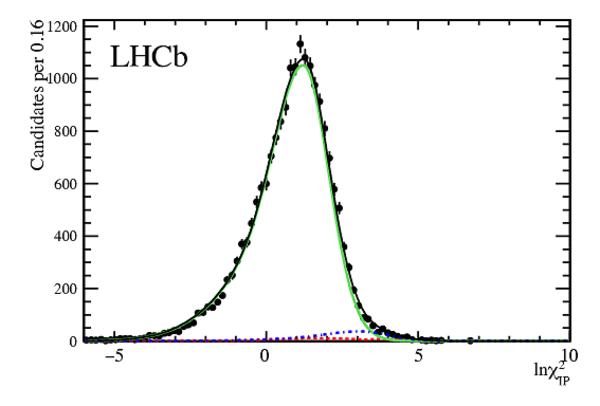
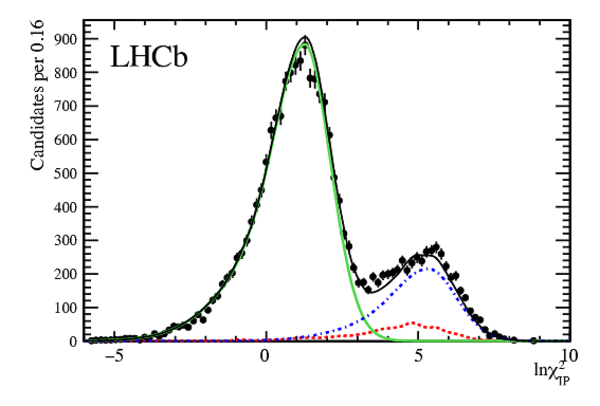
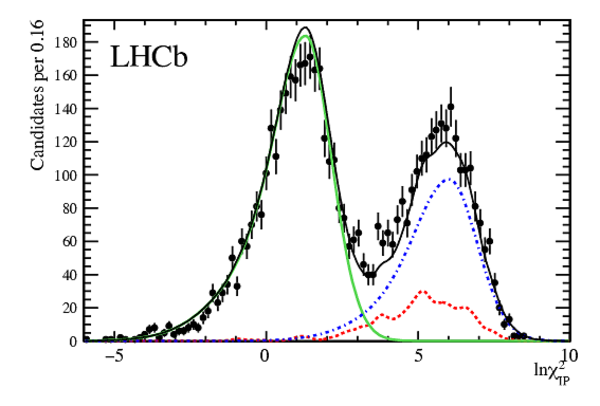
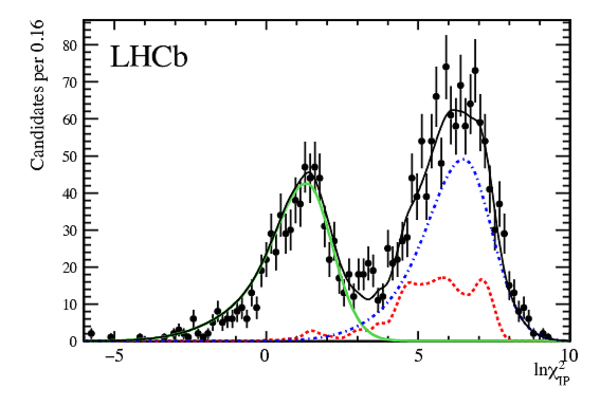
Decay time projection from the fit for separation of prompt and secondary candidates. The curves show the results of the fit described in Sec. 4.4: the total (solid black), the prompt component (solid green), the secondary component (dot-dashed blue), and the combinatorial component (dashed red). Both plots show the same data sample with linear (top) and logarithmic (bottom) vertical scales. |
D0_t_s[..].pdf [31 KiB] HiDef png [170 KiB] Thumbnail [121 KiB] *.C file |
|
|
D0_t_s[..].pdf [33 KiB] HiDef png [191 KiB] Thumbnail [152 KiB] *.C file |

|
|
|
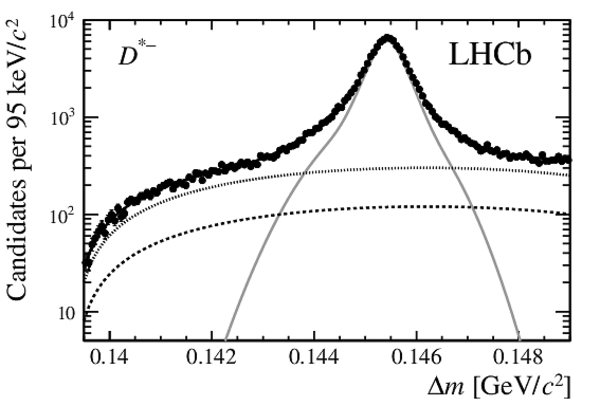
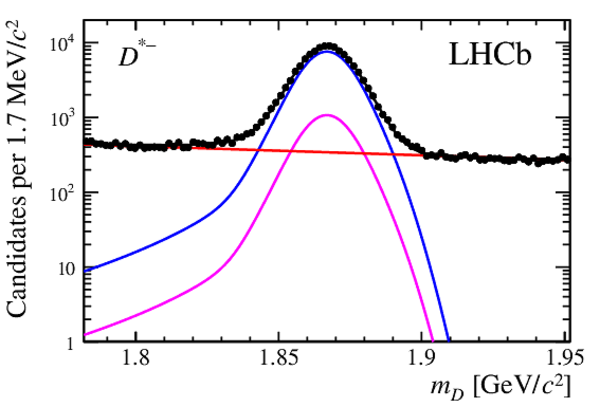
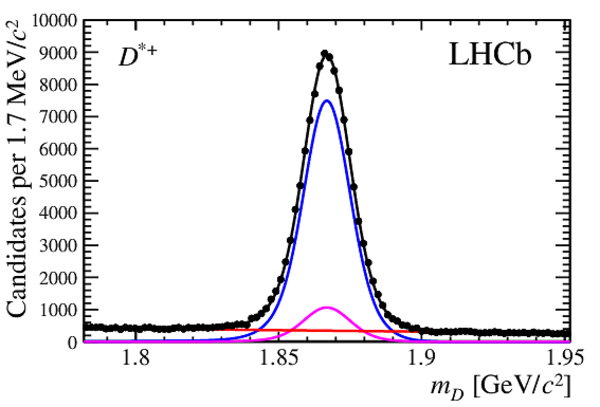
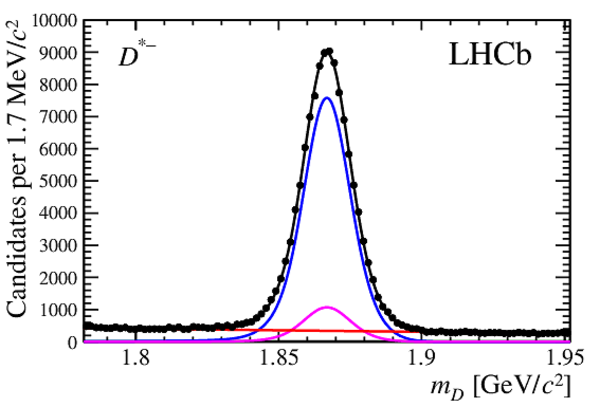
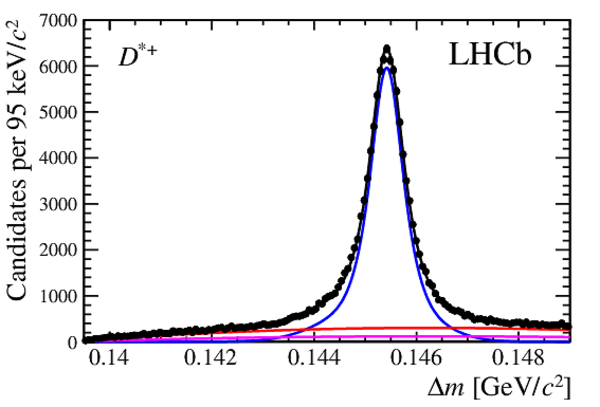
Fitted $(m_D, \Delta m)$ distributions. The upper row shows the $m_D$ projection and the lower row $\Delta m$. The left column shows $ D ^{*+}$ candidates and the right column $ D ^{*-}$ . The signal and background components are shown separately (signal as solid grey, $ D ^0$ background dashed, combinatoric background dotted, and the sum as solid black). |
paperP[..].pdf [34 KiB] HiDef png [128 KiB] Thumbnail [69 KiB] *.C file |

|
|
paperP[..].pdf [34 KiB] HiDef png [128 KiB] Thumbnail [70 KiB] *.C file |

|
|
|
paperP[..].pdf [43 KiB] HiDef png [143 KiB] Thumbnail [77 KiB] *.C file |

|
|
|
paperP[..].pdf [43 KiB] HiDef png [143 KiB] Thumbnail [77 KiB] *.C file |
|
|
|
Animated gif made out of all figures. |
PAPER-2015-042.gif Thumbnail |

|
Tables and captions
|
Systematic uncertainties on $x$ and $y$. The statistical uncertainties, which include the uncertainties associated with the CLEO parameters $(c_i, s_i)$, are shown for comparison. |
Table_1.pdf [57 KiB] HiDef png [140 KiB] Thumbnail [60 KiB] tex code |

|
Supplementary Material [file]


![HiDef png [111 KiB]](Directory_LHCb-PAPER-2015-042/hidef_paperPlot-fit1-BW.png)
![HiDef png [114 KiB]](Directory_LHCb-PAPER-2015-042/hidef_paperPlot-fit1-BW-log.png)
![HiDef png [170 KiB]](Directory_LHCb-PAPER-2015-042/hidef_D0_t_signal-matSingleHisto-editedByHand-stamped.png)
![HiDef png [191 KiB]](Directory_LHCb-PAPER-2015-042/hidef_D0_t_signal-matSingleHisto-log-editedByHand-stamped.png)
![HiDef png [128 KiB]](Directory_LHCb-PAPER-2015-042/hidef_paperPlot-fit3-massD0-BW-log.png)
![HiDef png [128 KiB]](Directory_LHCb-PAPER-2015-042/hidef_paperPlot-fit3-massD0bar-BW-log.png)
![HiDef png [143 KiB]](Directory_LHCb-PAPER-2015-042/hidef_paperPlot-fit3-dmD0-BW-log.png)
![HiDef png [143 KiB]](Directory_LHCb-PAPER-2015-042/hidef_paperPlot-fit3-dmD0bar-BW-log.png)
![HiDef png [140 KiB]](Directory_LHCb-PAPER-2015-042/hidef_Table_1.png)
![HiDef png [141 KiB]](Directory_LHCb-PAPER-2015-042/supplementary/hidef_Fig4a.png)
![HiDef png [154 KiB]](Directory_LHCb-PAPER-2015-042/supplementary/hidef_Fig4b.png)
![HiDef png [173 KiB]](Directory_LHCb-PAPER-2015-042/supplementary/hidef_Fig5a.png)
![HiDef png [174 KiB]](Directory_LHCb-PAPER-2015-042/supplementary/hidef_Fig5b.png)
![HiDef png [190 KiB]](Directory_LHCb-PAPER-2015-042/supplementary/hidef_Fig5c.png)
![HiDef png [191 KiB]](Directory_LHCb-PAPER-2015-042/supplementary/hidef_Fig5d.png)
![HiDef png [193 KiB]](Directory_LHCb-PAPER-2015-042/supplementary/hidef_Fig6a.png)
![HiDef png [193 KiB]](Directory_LHCb-PAPER-2015-042/supplementary/hidef_Fig6b.png)
![HiDef png [191 KiB]](Directory_LHCb-PAPER-2015-042/supplementary/hidef_Fig6c.png)
![HiDef png [192 KiB]](Directory_LHCb-PAPER-2015-042/supplementary/hidef_Fig6d.png)
![HiDef png [185 KiB]](Directory_LHCb-PAPER-2015-042/supplementary/hidef_Fig7a.png)
![HiDef png [172 KiB]](Directory_LHCb-PAPER-2015-042/supplementary/hidef_Fig7b.png)
![HiDef png [175 KiB]](Directory_LHCb-PAPER-2015-042/supplementary/hidef_Fig7c.png)
![HiDef png [196 KiB]](Directory_LHCb-PAPER-2015-042/supplementary/hidef_Fig7d.png)
![HiDef png [199 KiB]](Directory_LHCb-PAPER-2015-042/supplementary/hidef_Fig7e.png)
![HiDef png [185 KiB]](Directory_LHCb-PAPER-2015-042/supplementary/hidef_Fig7f.png)
![HiDef png [207 KiB]](Directory_LHCb-PAPER-2015-042/supplementary/hidef_Fig7g.png)
![HiDef png [230 KiB]](Directory_LHCb-PAPER-2015-042/supplementary/hidef_Fig7h.png)
![HiDef png [210 KiB]](Directory_LHCb-PAPER-2015-042/supplementary/hidef_Fig7i.png)
![HiDef png [183 KiB]](Directory_LHCb-PAPER-2015-042/supplementary/hidef_Fig7j.png)
![HiDef png [163 KiB]](Directory_LHCb-PAPER-2015-042/supplementary/hidef_Fig7k.png)
![HiDef png [553 KiB]](Directory_LHCb-PAPER-2015-042/supplementary/hidef_Fig8a.png)
![HiDef png [642 KiB]](Directory_LHCb-PAPER-2015-042/supplementary/hidef_Fig8b.png)
![HiDef png [1 MiB]](Directory_LHCb-PAPER-2015-042/supplementary/hidef_Fig8c.png)
![HiDef png [1 MiB]](Directory_LHCb-PAPER-2015-042/supplementary/hidef_Fig8d.png)
Created on 27 April 2024.