Forward production of $\Upsilon$ mesons in $pp$ collisions at $\sqrt{s}=7$ and 8TeV
[to restricted-access page]Information
LHCb-PAPER-2015-045
CERN-PH-EP-2015-232
arXiv:1509.02372 [PDF]
(Submitted on 08 Sep 2015)
JHEP 11 (2015) 103
Inspire 1392456
Tools
Abstract
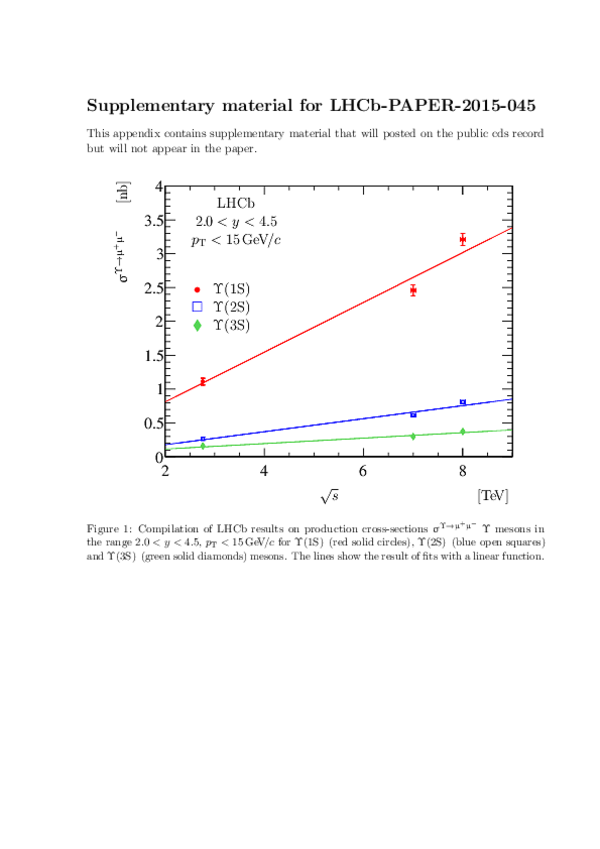
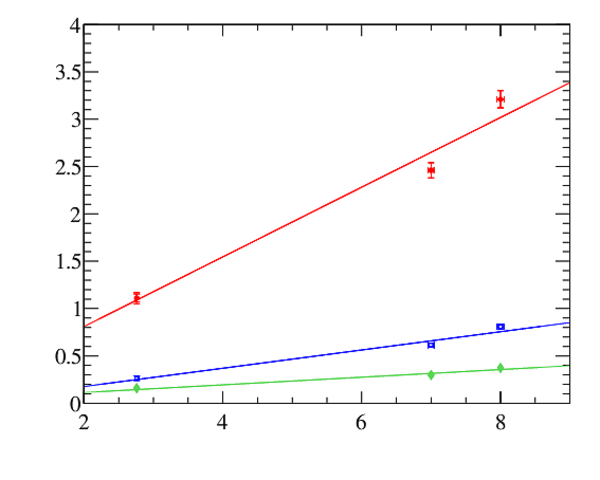
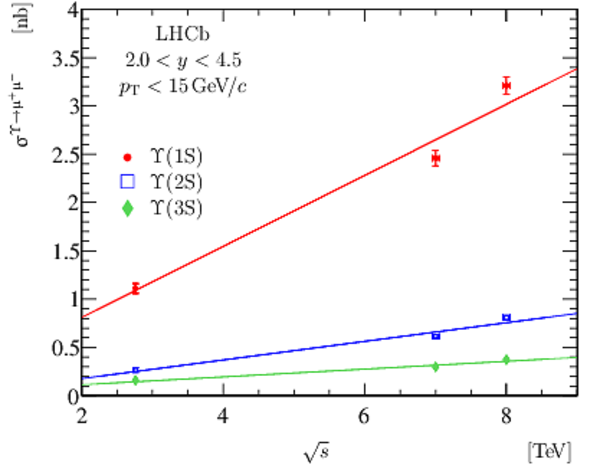
The production of $\Upsilon$ mesons in $pp$ collisions at $\sqrt=7$ and $8 \mathrm{TeV}$ is studied with the LHCb detector using data samples corresponding to an integrated luminosity of $1 \mathrm{fb}^{-1}$ and $2 \mathrm{fb}^{-1}$ respectively. The production cross-sections and ratios of cross-sections are measured as functions of the meson transverse momentum $p_T$ and rapidity $y$, for $p_T<30 \mathrm{GeV}/c$} and $2.0<y<4.5$.
Figures and captions
|
Efficiency-corrected dimuon mass distributions for (left) $\sqrt{s}=7 \mathrm{TeV}$ and (right) $\sqrt{s}=8 \mathrm{TeV}$ samples in the region $3< p_{\mathrm T} <4 {\mathrm{ Ge V /}c} $, $3.0<y<3.5$. The thick dark yellow solid curves show the result of the fits, as described in the text. The three peaks, shown with thin magenta solid lines, correspond to the $\Upsilon\mathrm{(1S)}$ , $\Upsilon\mathrm{(2S)}$ and $\Upsilon\mathrm{(3S)}$ signals (left to right). The background component is indicated with a blue dashed line. To show the signal peaks clearly, the range of the dimuon mass shown is narrower than that used in the fit. |
Fig_1.pdf [165 KiB] HiDef png [207 KiB] Thumbnail [166 KiB] *.C file tex code |

|
|
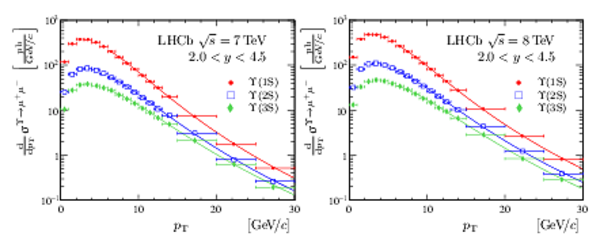
Double differential cross-sections $\dfrac{\mathrm{d}^2}{\mathrm{d} p_{\mathrm{T}} \mathrm{d} y}\upsigma^{\Upsilon\rightarrow \mu ^+\mu ^- }$ for (top) $\Upsilon\mathrm{(1S)}$ , (middle) $\Upsilon\mathrm{(2S)}$ and (bottom) $\Upsilon\mathrm{(3S)}$ at (left) $\sqrt{s}=7 \mathrm{TeV}$ and (right) $\sqrt{s}=8 \mathrm{TeV}$. The error bars indicate the sum in quadrature of the statistical and systematic uncertainties. The rapidity ranges $2.0<y<2.5$, $2.5<y<3.0$, $3.0<y<3.5$, $3.5<y<4.0$ and $4.0<y<4.5$ are shown with red filled circles, blue open squares, cyan downward triangles, magenta upward triangles and green diamonds, respectively. Some data points are displaced from the bin centres to improve visibility. |
Fig_2.pdf [197 KiB] HiDef png [681 KiB] Thumbnail [576 KiB] *.C file tex code |

|
|
Differential cross-sections $\frac{\mathrm{d}}{\mathrm{d} p_{\mathrm T} }\upsigma^{\Upsilon\rightarrow \mu ^+\mu ^- }$ in the range $2.0<y<4.5$ for (red solid circles) $\Upsilon\mathrm{(1S)}$ , (blue open squares) $\Upsilon\mathrm{(2S)}$ and (green solid diamonds) $\Upsilon\mathrm{(3S)}$ mesons for (left) $\sqrt{s}=7 \mathrm{TeV}$ and (right) $\sqrt{s}=8 \mathrm{TeV}$ data. The curves show the fit results with the Tsallis function in the range $6< p_{\mathrm T} <30 {\mathrm{ Ge V /}c} $. The data points are positioned in the bins according to Eq. (6) in Ref. \cite{Lafferty:1994cj}. |
Fig_3.pdf [130 KiB] HiDef png [223 KiB] Thumbnail [183 KiB] *.C file tex code |
|
|
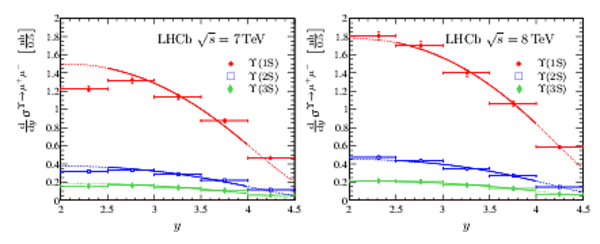
Differential cross-sections $\frac{\mathrm{d}}{\mathrm{d} y}\upsigma^{\Upsilon\rightarrow \mu ^+\mu ^- }$ in the range $ p_{\mathrm T} <30 {\mathrm{ Ge V /}c} $ for (red solid circles) $\Upsilon\mathrm{(1S)}$ , (blue open squares) $\Upsilon\mathrm{(2S)}$ and (green solid diamonds) $\Upsilon\mathrm{(3S)}$ mesons for (left) $\sqrt{s}=7 \mathrm{TeV}$ and (right) $\sqrt{s}=8 \mathrm{TeV}$ data. Thick lines show fit results with the CO model predictions from Ref. \cite{ Kisslinger:2011fe,Kisslinger:2013mev,*Kisslinger:2014zga} in the region $2.5<y<4.0$, and dashed lines show the extrapolation to the full region $2.0<y<4.5$. The data points are positioned in the bins according to Eq. (6) in Ref. \cite{Lafferty:1994cj}. |
Fig_4.pdf [127 KiB] HiDef png [188 KiB] Thumbnail [166 KiB] *.C file tex code |
|
|
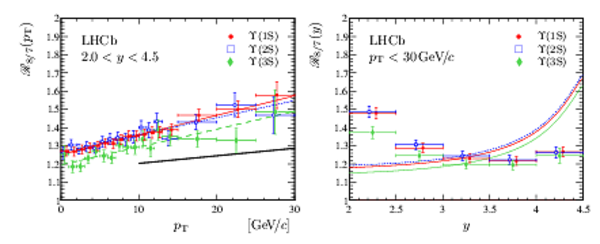
Ratios of the differential cross-sections (left) $\frac{\mathrm{d}}{\mathrm{d} p_{\mathrm T} }\upsigma^{\Upsilon\rightarrow \mu ^+\mu ^- }$ and (right) $\frac{\mathrm{d}}{\mathrm{d} y}\upsigma^{\Upsilon\rightarrow \mu ^+\mu ^- }$ at $\sqrt{s}=8$ and $7 \mathrm{TeV}$ for (red solid circles) $\Upsilon\mathrm{(1S)}$ , (blue open squares) $\Upsilon\mathrm{(2S)}$ and (green solid diamonds) $\Upsilon\mathrm{(3S)}$ . On the left hand plot, the results of the fit with a linear function are shown with straight thin red solid, blue dotted and green dashed lines. In the same plot, the nextdash-todash-leading order NRQCD theory predictions \cite{Han:2014kxa} are shown as a thick line. On the right hand plot, the curved red solid, blue dotted and greed dashed lines show the CO model predictions \cite{Kisslinger:2011fe,Kisslinger:2013mev,*Kisslinger:2014zga} with the normalisation fixed from the fits in Fig. ??? for $\Upsilon\mathrm{(1S)}$ , $\Upsilon\mathrm{(2S)}$ and $\Upsilon\mathrm{(3S)}$ mesons, respectively. Some data points are displaced from the bin centres to improve visibility. |
Fig_5.pdf [111 KiB] HiDef png [222 KiB] Thumbnail [177 KiB] *.C file tex code |
|
|
The production ratios $\mathscr{R}_{\mathrm{i,j}}$ for (top) $\Upsilon\mathrm{(2S)}$ to $\Upsilon\mathrm{(1S)}$ , (middle) $\Upsilon\mathrm{(3S)}$ to $\Upsilon\mathrm{(1S)}$ , and (bottom) $\Upsilon\mathrm{(3S)}$ to $\Upsilon\mathrm{(2S)}$ , measured with data collected at (left) $\sqrt{s}=7 \mathrm{TeV}$ and (right) $\sqrt{s}=8 \mathrm{TeV}$. The error bars indicate the sum in quadrature of the statistical and systematic uncertainties. The rapidity ranges $2.0< y<2.5$, $2.5\le y<3.0$, $3.0\le y<3.5$, $3.5\le y<4.0$ and $4.0\le y<4.5$ are shown with red circles, blue squares, cyan downward triangles, magenta upward triangles and green diamonds, respectively. Some data points are displaced from the bin centres to improve visibility. |
Fig_6.pdf [184 KiB] HiDef png [662 KiB] Thumbnail [543 KiB] *.C file tex code |

|
|
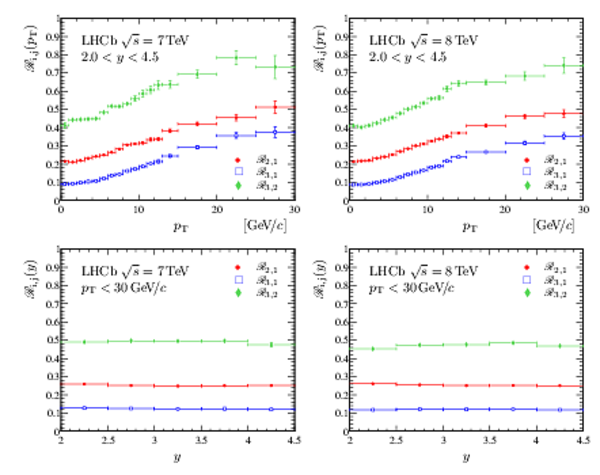
The production ratios (red solid circles) $\mathscr{R}_{2,1}$, (blue open squares) $\mathscr{R}_{3,1}$ and (green solid diamonds) $\mathscr{R}_{3,2}$ for (left) $\sqrt{s}=7 \mathrm{TeV}$ and (right) $\sqrt{s}=8 \mathrm{TeV}$ data, integrated over the (top) $2.0<y<4.5$ region and (bottom) $ p_{\mathrm T} <30 {\mathrm{ Ge V /}c} $ region. |
Fig_7.pdf [129 KiB] HiDef png [318 KiB] Thumbnail [297 KiB] *.C file tex code |
|
|
Animated gif made out of all figures. |
PAPER-2015-045.gif Thumbnail |

|
Tables and captions
|
Efficiency-corrected signal yields for data samples accumulated at $\sqrt{s} =7$ and $8 \mathrm{TeV}$ summed over the full kinematic range $ p_{\mathrm T} <30 {\mathrm{ Ge V /}c} $, $2.0<y<4.5$. The uncertainties are statistical only. |
Table_1.pdf [63 KiB] HiDef png [51 KiB] Thumbnail [25 KiB] tex code |

|
|
Summary of relative systematic uncertainties (in %) for the differential production cross-sections, their ratios, integrated cross-sections and the ratios $\mathscr{R}_{8/7}$. The ranges indicate variations depending on the $( p_{\mathrm T} ,y)$ bin and the \Upsilon state. |
Table_2.pdf [76 KiB] HiDef png [84 KiB] Thumbnail [38 KiB] tex code |

|
|
Production cross-section $\upsigma^{\Upsilon\mathrm{(1S)} \rightarrow \mu ^+\mu ^- }_{\mathrm{bin}}\left[ \rm pb \right]$ in $( p_{\mathrm T} ,y)$ bins for $\sqrt{s}=7 \mathrm{TeV}$. The first uncertainties are statistical and the second are the uncorrelated component of the systematic uncertainties. The overall correlated systematic uncertainty is 3.1% and is not included in the numbers in the table. The horizontal lines indicate bin boundaries. |
Table_3.pdf [34 KiB] HiDef png [262 KiB] Thumbnail [126 KiB] tex code |

|
|
Production cross-section $\upsigma^{\Upsilon\mathrm{(2S)} \rightarrow \mu ^+\mu ^- }_{\mathrm{bin}} \left[ \rm pb \right]$ in $( p_{\mathrm T} ,y)$ bins for $\sqrt{s}=7 \mathrm{TeV}$. The first uncertainties are statistical and the second are the uncorrelated component of the systematic uncertainties. The overall correlated systematic uncertainty is 3.1% and is not included in the numbers in the table. The horizontal lines indicate bin boundaries. |
Table_4.pdf [34 KiB] HiDef png [266 KiB] Thumbnail [129 KiB] tex code |

|
|
Production cross-section $\upsigma^{\Upsilon\mathrm{(3S)} \rightarrow \mu ^+\mu ^- }_{\mathrm{bin}} \left[ \rm pb \right]$ in $( p_{\mathrm T} ,y)$ bins for $\sqrt{s}=7 \mathrm{TeV}$. The first uncertainties are statistical and the second are the uncorrelated component of the systematic uncertainties. The overall correlated systematic uncertainty is 3.1% and is not included in the numbers in the table. The horizontal lines indicate bin boundaries. |
Table_5.pdf [34 KiB] HiDef png [277 KiB] Thumbnail [137 KiB] tex code |

|
|
Production cross-section $\upsigma^{\Upsilon\mathrm{(1S)} \rightarrow \mu ^+\mu ^- }_{\mathrm{bin}} \left[ \rm pb \right]$ in $( p_{\mathrm T} ,y)$ bins for $\sqrt{s}=8 \mathrm{TeV}$. The first uncertainties are statistical and the second are the uncorrelated component of the systematic uncertainties. The overall correlated systematic uncertainty is 2.8% and is not included in the numbers in the table. The horizontal lines indicate bin boundaries. |
Table_6.pdf [34 KiB] HiDef png [262 KiB] Thumbnail [126 KiB] tex code |

|
|
Production cross-section $\upsigma^{\Upsilon\mathrm{(2S)} \rightarrow \mu ^+\mu ^- }_{\mathrm{bin}} \left[ \rm pb \right]$ in $( p_{\mathrm T} ,y)$ bins for $\sqrt{s}=8 \mathrm{TeV}$. The first uncertainties are statistical and the second are the uncorrelated component of the systematic uncertainties. The overall correlated systematic uncertainty is 2.8% and is not included in the numbers in the table. The horizontal lines indicate bin boundaries. |
Table_7.pdf [34 KiB] HiDef png [270 KiB] Thumbnail [129 KiB] tex code |

|
|
Production cross-section $\upsigma^{\Upsilon\mathrm{(3S)} \rightarrow \mu ^+\mu ^- }_{\mathrm{bin}} \left[ \rm pb \right]$ in $( p_{\mathrm T} ,y)$ bins for $\sqrt{s}=8 \mathrm{TeV}$. The first uncertainties are statistical and the second are the uncorrelated component of the systematic uncertainty. The overall correlated systematic uncertainty is 2.8% and is not included in the numbers in the table. The horizontal lines indicate the bin boundaries. |
Table_8.pdf [34 KiB] HiDef png [276 KiB] Thumbnail [131 KiB] tex code |

|
|
Results of the fits to the transverse momentum spectra of \Upsilon mesons using the Tsallis function in the reduced range $6< p_{\mathrm T} <30 {\mathrm{ Ge V /}c} $. |
Table_9.pdf [28 KiB] HiDef png [61 KiB] Thumbnail [30 KiB] tex code |

|
|
The production cross-section $\upsigma^{\Upsilon\rightarrow \mu ^+\mu ^- }$ (in $\rm pb $) for \Upsilon mesons in the full kinematic range $ p_{\mathrm T} <30 {\mathrm{ Ge V /}c} $ (left two columns), and reduced range $ p_{\mathrm T} <15 {\mathrm{ Ge V /}c} $ (right two columns), for $2.0<y<4.5$. The first uncertainties are statistical and the second systematic. |
Table_10.pdf [66 KiB] HiDef png [46 KiB] Thumbnail [23 KiB] tex code |

|
|
The ratio of production cross-sections for \Upsilon mesons at $\sqrt{s}=8$ to that at $\sqrt{s}=7 \mathrm{TeV}$ in the full kinematic range $ p_{\mathrm T} <30 {\mathrm{ Ge V /}c} $ (left) and reduced range $ p_{\mathrm T} <15 {\mathrm{ Ge V /}c} $ (right) for $2.0< y<4.5$. The first uncertainties are statistical and the second systematic. |
Table_11.pdf [34 KiB] HiDef png [51 KiB] Thumbnail [26 KiB] tex code |

|
|
The ratio $\mathscr{R}_{\mathrm{2,1}}$ for $\sqrt{s}=7 \mathrm{TeV}$. The first uncertainties are statistical and the second are the uncorrelated component of the systematic uncertainties. The overall correlated systematic uncertainty is 0.7% and is not included in the numbers in the table. The horizontal lines indicate bin boundaries. |
Table_12.pdf [34 KiB] HiDef png [284 KiB] Thumbnail [136 KiB] tex code |

|
|
The ratio $\mathscr{R}_{\mathrm{3,1}}$ for $\sqrt{s}=7 \mathrm{TeV}$. The first uncertainties are statistical and the second are the uncorrelated component of the systematic uncertainties. The overall correlated systematic uncertainty is 0.7% and is not included in the numbers in the table. The horizontal lines indicate bin boundaries. |
Table_13.pdf [34 KiB] HiDef png [285 KiB] Thumbnail [137 KiB] tex code |

|
|
The ratio $\mathscr{R}_{\mathrm{2,1}}$ for $\sqrt{s}=8 \mathrm{TeV}$. The first uncertainties are statistical and the second are the uncorrelated component of the systematic uncertainties. The overall correlated systematic uncertainty is 0.7% and is not included in the numbers in the table. The horizontal lines indicate bin boundaries. |
Table_14.pdf [34 KiB] HiDef png [294 KiB] Thumbnail [140 KiB] tex code |

|
|
The ratio $\mathscr{R}_{\mathrm{3,1}}$ for $\sqrt{s}=8 \mathrm{TeV}$. The first uncertainties are statistical and the second are the uncorrelated component of the systematic uncertainties. The overall correlated systematic uncertainty is 0.7% and is not included in the numbers in the table. The horizontal lines indicate bin boundaries. |
Table_15.pdf [34 KiB] HiDef png [298 KiB] Thumbnail [142 KiB] tex code |

|
|
The ratios $\mathscr{R}_{\mathrm{i,j}}$ in the full kinematic range $ p_{\mathrm T} <30 {\mathrm{ Ge V /}c} $ and in the reduced range $ p_{\mathrm T} <15 {\mathrm{ Ge V /}c} $ for $2.0< y<4.5$. The first uncertainties are statistical and the second systematic. |
Table_16.pdf [45 KiB] HiDef png [115 KiB] Thumbnail [52 KiB] tex code |

|
Supplementary Material [file]


![HiDef png [207 KiB]](Directory_LHCb-PAPER-2015-045/hidef_Fig_1.png)
![HiDef png [681 KiB]](Directory_LHCb-PAPER-2015-045/hidef_Fig_2.png)
![HiDef png [223 KiB]](Directory_LHCb-PAPER-2015-045/hidef_Fig_3.png)
![HiDef png [188 KiB]](Directory_LHCb-PAPER-2015-045/hidef_Fig_4.png)
![HiDef png [222 KiB]](Directory_LHCb-PAPER-2015-045/hidef_Fig_5.png)
![HiDef png [662 KiB]](Directory_LHCb-PAPER-2015-045/hidef_Fig_6.png)
![HiDef png [318 KiB]](Directory_LHCb-PAPER-2015-045/hidef_Fig_7.png)
![HiDef png [51 KiB]](Directory_LHCb-PAPER-2015-045/hidef_Table_1.png)
![HiDef png [84 KiB]](Directory_LHCb-PAPER-2015-045/hidef_Table_2.png)
![HiDef png [262 KiB]](Directory_LHCb-PAPER-2015-045/hidef_Table_3.png)
![HiDef png [266 KiB]](Directory_LHCb-PAPER-2015-045/hidef_Table_4.png)
![HiDef png [277 KiB]](Directory_LHCb-PAPER-2015-045/hidef_Table_5.png)
![HiDef png [262 KiB]](Directory_LHCb-PAPER-2015-045/hidef_Table_6.png)
![HiDef png [270 KiB]](Directory_LHCb-PAPER-2015-045/hidef_Table_7.png)
![HiDef png [276 KiB]](Directory_LHCb-PAPER-2015-045/hidef_Table_8.png)
![HiDef png [61 KiB]](Directory_LHCb-PAPER-2015-045/hidef_Table_9.png)
![HiDef png [46 KiB]](Directory_LHCb-PAPER-2015-045/hidef_Table_10.png)
![HiDef png [51 KiB]](Directory_LHCb-PAPER-2015-045/hidef_Table_11.png)
![HiDef png [284 KiB]](Directory_LHCb-PAPER-2015-045/hidef_Table_12.png)
![HiDef png [285 KiB]](Directory_LHCb-PAPER-2015-045/hidef_Table_13.png)
![HiDef png [294 KiB]](Directory_LHCb-PAPER-2015-045/hidef_Table_14.png)
![HiDef png [298 KiB]](Directory_LHCb-PAPER-2015-045/hidef_Table_15.png)
![HiDef png [115 KiB]](Directory_LHCb-PAPER-2015-045/hidef_Table_16.png)
![HiDef png [130 KiB]](Directory_LHCb-PAPER-2015-045/supplementary/hidef_Fig1_supp.png)
![HiDef png [181 KiB]](Directory_LHCb-PAPER-2015-045/supplementary/hidef_Fig1_supp_full.png)
![HiDef png [118 KiB]](Directory_LHCb-PAPER-2015-045/supplementary/hidef_Fig2_supp.png)
![HiDef png [170 KiB]](Directory_LHCb-PAPER-2015-045/supplementary/hidef_Fig2_supp_full.png)
Created on 26 April 2024.