Production of associated $\Upsilon$ and open charm hadrons in $pp$ collisions at $\sqrt{s}=7$ and $8$ TeV via double parton scattering
[to restricted-access page]Information
LHCb-PAPER-2015-046
CERN-PH-EP-2015-279
arXiv:1510.05949 [PDF]
(Submitted on 20 Oct 2015)
JHEP 07 (2016) 052
Inspire 1399056
Tools
Abstract
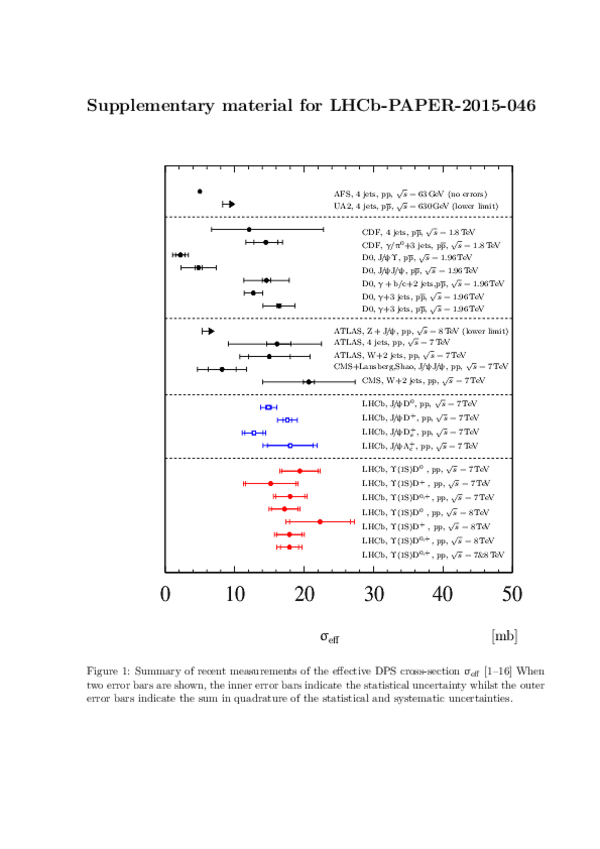
Associated production of bottomonia and open charm hadrons in $pp$ collisions at $\sqrt{s}=7$ and $8$TeV is observed using data corresponding to an integrated luminosity of 3$fb^{-1}$ accumulated with the LHCb detector. The observation of five combinations, $\Upsilon(1S)D^0$, $\Upsilon(2S)D^0$, $\Upsilon(1S)D^+$, $\Upsilon(2S)D^+$ and $\Upsilon(1S)D^+_{s}$, is reported. Production cross-sections are measured for $\Upsilon(1S)D^0$ and $\Upsilon(1S)D^+$ pairs in the forward region. The measured cross-sections and the differential distributions indicate the dominance of double parton scattering as the main production mechanism. This allows a precise measurement of the effective cross-section for double parton scattering.
Figures and captions
|
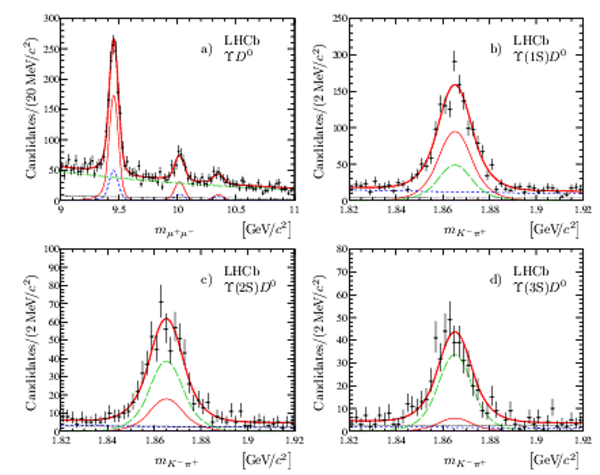
Invariant mass distributions for selected combination of \Upsilon mesons and $\mathsf{C}$ hadrons: a) $\Upsilon D ^0 $, b) $\Upsilon D ^+ $, c) $\Upsilon D ^+_ s $ and d) $\Upsilon\Lambda ^+_ c $. |
Fig_1.pdf [145 KiB] HiDef png [479 KiB] Thumbnail [261 KiB] *.C file tex code |

|
|
Projections from two-dimensional extended unbinned maximum likelihood fits in bands a) $1.844<m_{ K ^- \pi ^+ }<1.887 {\mathrm{ Me V /}c^2} $, b) $9.332<m_{\mu ^+\mu ^- } <9.575 {\mathrm{ Ge V /}c^2} $, c) $9.889<m_{\mu ^+\mu ^- } <10.145 {\mathrm{ Ge V /}c^2} $ and d) $10.216<m_{\mu ^+\mu ^- } <10.481 {\mathrm{ Ge V /}c^2} $. The total fit function is shown by a solid thick (red) curve; three individual $\Upsilon D ^0 $ signal components are shown by solid thin (red) curves; three components describing \Upsilon signals and combinatorial background in $ K ^- \pi ^+ $ mass are shown with short-dashed (blue) curves; the component modelling the true $ D ^0$ signal and combinatorial background in $\mu ^+\mu ^-$ mass is shown with a long-dashed (green) curve and the component describing combinatorial background is shown with a thin dotted (black) line. |
Fig_2.pdf [136 KiB] HiDef png [478 KiB] Thumbnail [383 KiB] *.C file tex code |
|
|
Projections from two-dimensional extended unbinned maximum likelihood fits in bands a) $1.848<m_{ K ^- \pi ^+ \pi ^+ }<1.891 {\mathrm{ Me V /}c^2} $, b) $9.332<m_{\mu ^+\mu ^- } <9.575 {\mathrm{ Ge V /}c^2} $ , c) $9.889<m_{\mu ^+\mu ^- } <10.145 {\mathrm{ Ge V /}c^2} $ and d) $10.216<m_{\mu ^+\mu ^- } <10.481 {\mathrm{ Ge V /}c^2} $. The total fit function is shown by a solid thick (red) curve; three individual $\Upsilon D ^+ $ signal components are shown by solid thin (red) curves; three components describing \Upsilon signals and combinatorial background in $ K ^- \pi ^+ \pi ^+ $ mass are shown with short-dashed (blue) curves; the component modelling the true $ D ^+$ signal and combinatorial background in $\mu ^+\mu ^-$ mass is shown with a long-dashed (green) curve and the component describing combinatorial background is shown with a thin dotted (black) line. |
Fig_3.pdf [134 KiB] HiDef png [494 KiB] Thumbnail [404 KiB] *.C file tex code |

|
|
Projections from two-dimensional extended unbinned maximum likelihood fits in bands a) $1.952<m_{\left( K ^- K ^+ \right)_{\phi }\pi ^+ }<1.988 {\mathrm{ Me V /}c^2} $, b) $9.332<m_{\mu ^+\mu ^- } <9.575 {\mathrm{ Ge V /}c^2} $ , c) $9.889<m_{\mu ^+\mu ^- } <10.145 {\mathrm{ Ge V /}c^2} $ and d) $10.216<m_{\mu ^+\mu ^- } <10.481 {\mathrm{ Ge V /}c^2} $. The total fit function is shown by a solid thick (red) curve; three individual $\Upsilon D ^+_ s $ signal components are shown by solid thin (red) curves; three components describing \Upsilon signals and combinatorial background in $\left( K ^- K ^+ \right)_{\phi }\pi ^+ $ mass are shown with short-dashed (blue) curves; the component modelling the true $ D ^+_ s $ signal and combinatorial background in $\mu ^+\mu ^-$ mass is shown with a long-dashed (green) curve and the component describing combinatorial background is shown with a thin dotted (black) line. |
Fig_4.pdf [128 KiB] HiDef png [414 KiB] Thumbnail [337 KiB] *.C file tex code |

|
|
Projections from two-dimensional extended unbinned maximum likelihood fits in bands a) $2.273<m_{ p K ^- \pi ^+ }<2.304 {\mathrm{ Me V /}c^2} $ , b) $9.332<m_{\mu ^+\mu ^- } <9.575 {\mathrm{ Ge V /}c^2} $ , c) $9.889<m_{\mu ^+\mu ^- } <10.145 {\mathrm{ Ge V /}c^2} $ and d) $10.216<m_{\mu ^+\mu ^- } <10.481 {\mathrm{ Ge V /}c^2} $ . The total fit function is shown by a solid thick (red) curve; three individual $\Upsilon\Lambda ^+_ c $ signal components are shown by solid thin (red) curves; three components describing \Upsilon signals and combinatorial background in $ p K ^- \pi ^+ $ mass are shown with short-dashed (blue) curves; the component modelling the true $\Lambda ^+_ c $ signal and combinatorial background in $\mu ^+\mu ^-$ mass is shown with a long-dashed green curve and the component describing combinatorial background is shown with a thin dotted (black) line. |
Fig_5.pdf [118 KiB] HiDef png [413 KiB] Thumbnail [366 KiB] *.C file tex code |

|
|
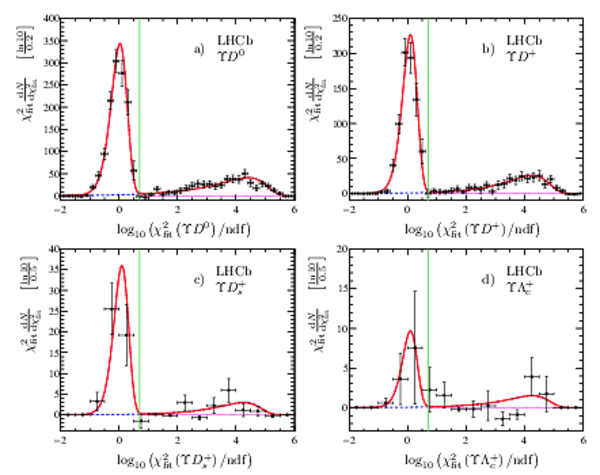
Background-subtracted distributions of $\chi^2 _{\mathrm{fit}}\left(\mathsf{C} \right)/\mathrm{ndf}$ for a) $\Upsilon D ^0 $, b) $\Upsilon D ^+ $, c) $\Upsilon D ^+_ s $ and d) $\Upsilon\Lambda ^+_ c $ cases. A thin vertical (green) line indicates the requirement $\chi^2 _{\mathrm{fit}}\left(\Upsilon\mathsf{C} \right)/\mathrm{ndf}<5$ used in the analysis. The solid (red) curves indicate a fit to a sum of two components, each described by $\Gamma$-distribution shape. The pileup component is shown with a dashed (blue) line. |
Fig_6.pdf [113 KiB] HiDef png [354 KiB] Thumbnail [307 KiB] *.C file tex code |
|
|
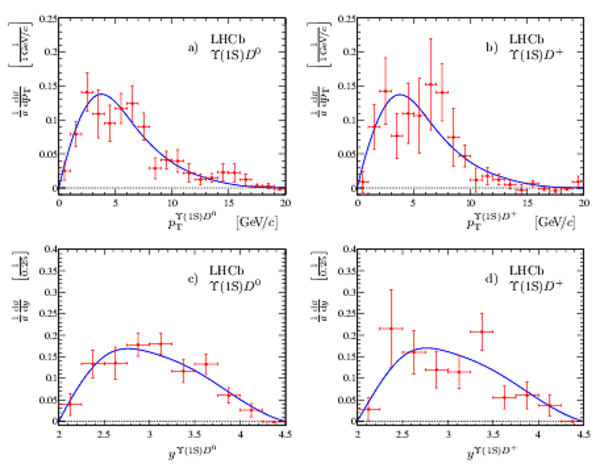
Background-subtracted and efficiency-corrected $ p^{\Upsilon}_{\mathrm{T}}$ (top) and $ p^{\mathsf{C} }_{\mathrm{T}}$ (bottom) distributions for $\Upsilon\mathrm{(1S)} D ^0 $ events (left) and $\Upsilon\mathrm{(1S)} D ^+ $ event (right). The transverse momentum spectra, derived within the DPS mechanism using the measurements from Refs. [41,44], are shown with the open (blue) squares. The SPS predictions [75] for the $ p^{\Upsilon}_{\mathrm{T}}$ spectra are shown with dashed (orange) and longdash-dashed (magenta) curves for calculations based on the $ k_{\mathrm{T}} $dash-factorization and the collinear approximation, respectively. All distributions are normalized to unity. |
Fig_7.pdf [124 KiB] HiDef png [276 KiB] Thumbnail [252 KiB] *.C file tex code |

|
|
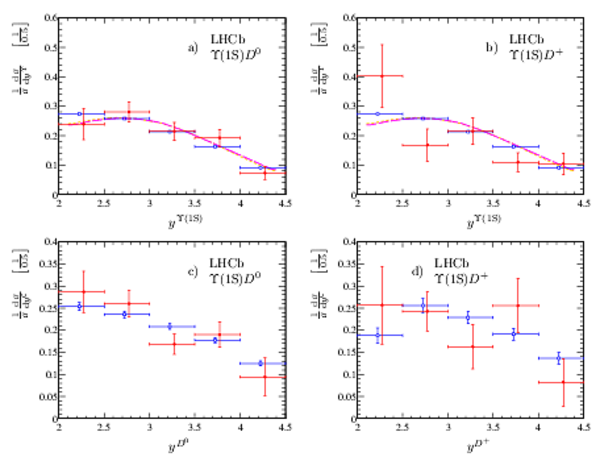
Background-subtracted and efficiency-corrected $ y^{\Upsilon}$ (top) and $ y^{\mathsf{C} }$ (bottom) distributions for $\Upsilon\mathrm{(1S)} D ^0 $ (left) and $\Upsilon\mathrm{(1S)} D ^+ $ (right) events. The rapidity spectra, derived within the DPS mechanism using the measurements from Refs. [41,44], are shown with the open (blue) squares. The SPS predictions [75] for the $ y^{\Upsilon}$ spectra are shown with dashed (orange) and longdash-dashed (magenta) curves for calculations based on the $ k_{\mathrm{T}} $dash-factorization and the collinear approximation, respectively. All distributions are normalized to unity. |
Fig_8.pdf [114 KiB] HiDef png [228 KiB] Thumbnail [215 KiB] *.C file tex code |
|
|
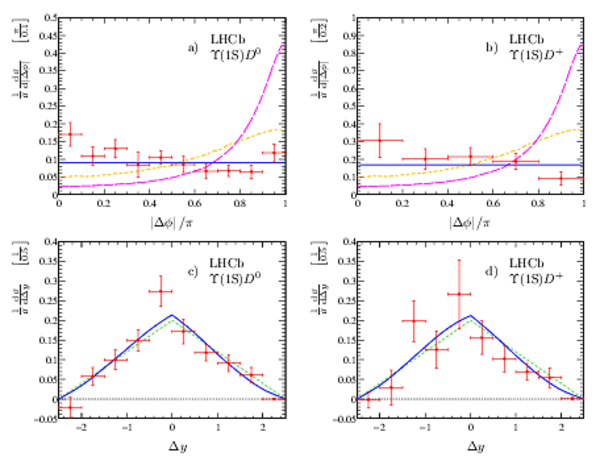
Background-subtracted and efficiency-corrected distributions for $\left|\Delta\phi\right|/\pi$ (top) and $\Delta y$ (bottom) for $\Upsilon\mathrm{(1S)} D ^0 $ (left) and $\Upsilon\mathrm{(1S)} D ^+ $ (right) events. Straight lines in the $\left|\Delta\phi\right|/\pi$ plots show the result of the fit with a constant function. The SPS predictions [75] for the shapes of $\Delta\phi$ distribution are shown with dashed (orange) and longdash-dashed (magenta) curves for calculations based on the $ k_{\mathrm{T}} $dash-factorization and the collinear approximation, respectively. The solid (blue) curves in the $\Delta y$ plots show the spectra obtained using a simplified simulation based on data from Refs. [41,44]. The dashed (green) lines show the triangle function expected for totally uncorrelated production of two particles, uniformly distributed in rapidity. All distributions are normalized to unity. |
Fig_9.pdf [157 KiB] HiDef png [299 KiB] Thumbnail [272 KiB] *.C file tex code |
|
|
Background-subtracted and efficiency-corrected $p_{\mathrm{T}}^{\Upsilon\mathrm{(1S)} \mathsf{C} }$ (top) and $y^{\Upsilon\mathrm{(1S)} \mathsf{C} }$ (bottom) distributions for $\Upsilon\mathrm{(1S)} D ^0 $ (left) and $\Upsilon\mathrm{(1S)} D ^+ $ (right) events. The blue curves show the spectra obtained using a simplified simulation based on data from Refs. [41,44]. All distributions are normalized to unity. |
Fig_10.pdf [126 KiB] HiDef png [296 KiB] Thumbnail [271 KiB] *.C file tex code |
|
|
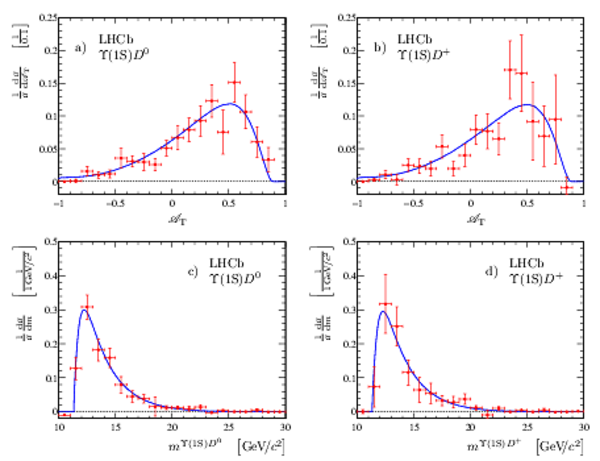
Background-subtracted and efficiency-corrected $\mathscr{A}_{\mathrm{T}}$ (top) and $m^{\Upsilon\mathrm{(1S)} \mathsf{C} }$ (bottom) distributions for $\Upsilon\mathrm{(1S)} D ^0 $ (left) and $\Upsilon\mathrm{(1S)} D ^+ $ (right) events. The blue curves show the spectra obtained using a simplified simulation based on data from Refs. [41,44]. All distributions are normalized to unity. |
Fig_11.pdf [235 KiB] HiDef png [283 KiB] Thumbnail [243 KiB] *.C file tex code |
|
|
Animated gif made out of all figures. |
PAPER-2015-046.gif Thumbnail |

|
Tables and captions
|
Signal yields $N^{\Upsilon\mathsf{C} }$ for $\Upsilon\mathsf{C} $ production, determined with two-dimensional extended unbinned maximum likelihood fits to the candidate $\Upsilon\mathsf{C} $ samples. |
Table_1.pdf [40 KiB] HiDef png [27 KiB] Thumbnail [13 KiB] tex code |

|
|
Statistical significances of the observed $\Upsilon\mathsf{C} $ signals in units of standard deviations determined using pseudoexperiments. The values in parentheses indicate the statistical significance calculated using Wilks' theorem [65]. |
Table_2.pdf [34 KiB] HiDef png [26 KiB] Thumbnail [12 KiB] tex code |

|
|
Summary of relative systematic uncertainties for $\upsigma^{\Upsilon\mathsf{C} }$ (in %). The total systematic uncertainty does not include the systematic uncertainty related to the knowledge of integrated luminosity [67]. The symbol $\oplus$ denotes the sum in quadrature. |
Table_3.pdf [73 KiB] HiDef png [85 KiB] Thumbnail [36 KiB] tex code |

|
|
Summary of relative systematic uncertainties for $\upsigma_{\mathrm{eff}}$ (in %). The reduced uncertainty for $\mathsf{C}$ hadron production cross-section, denoted as $\updelta(\upsigma^{\mathsf{C} })$, is recalculated from Ref. [41] taking into account the cancellation of correlated systematic uncertainties. |
Table_4.pdf [72 KiB] HiDef png [71 KiB] Thumbnail [32 KiB] tex code |

|
|
Summary of relative systematic uncertainties for the ratios $R^{\Upsilon\mathsf{C} }$ and $R^{ D ^0 / D ^+ }$ (in %). |
Table_5.pdf [70 KiB] HiDef png [88 KiB] Thumbnail [36 KiB] tex code |

|
Supplementary Material [file]


![HiDef png [479 KiB]](Directory_LHCb-PAPER-2015-046/hidef_Fig_1.png)
![HiDef png [478 KiB]](Directory_LHCb-PAPER-2015-046/hidef_Fig_2.png)
![HiDef png [494 KiB]](Directory_LHCb-PAPER-2015-046/hidef_Fig_3.png)
![HiDef png [414 KiB]](Directory_LHCb-PAPER-2015-046/hidef_Fig_4.png)
![HiDef png [413 KiB]](Directory_LHCb-PAPER-2015-046/hidef_Fig_5.png)
![HiDef png [354 KiB]](Directory_LHCb-PAPER-2015-046/hidef_Fig_6.png)
![HiDef png [276 KiB]](Directory_LHCb-PAPER-2015-046/hidef_Fig_7.png)
![HiDef png [228 KiB]](Directory_LHCb-PAPER-2015-046/hidef_Fig_8.png)
![HiDef png [299 KiB]](Directory_LHCb-PAPER-2015-046/hidef_Fig_9.png)
![HiDef png [296 KiB]](Directory_LHCb-PAPER-2015-046/hidef_Fig_10.png)
![HiDef png [283 KiB]](Directory_LHCb-PAPER-2015-046/hidef_Fig_11.png)
![HiDef png [27 KiB]](Directory_LHCb-PAPER-2015-046/hidef_Table_1.png)
![HiDef png [26 KiB]](Directory_LHCb-PAPER-2015-046/hidef_Table_2.png)
![HiDef png [85 KiB]](Directory_LHCb-PAPER-2015-046/hidef_Table_3.png)
![HiDef png [71 KiB]](Directory_LHCb-PAPER-2015-046/hidef_Table_4.png)
![HiDef png [88 KiB]](Directory_LHCb-PAPER-2015-046/hidef_Table_5.png)
![HiDef png [106 KiB]](Directory_LHCb-PAPER-2015-046/supplementary/hidef_Fig_supp.png)
![HiDef png [410 KiB]](Directory_LHCb-PAPER-2015-046/supplementary/hidef_Figure_supp.png)
![HiDef png [271 KiB]](Directory_LHCb-PAPER-2015-046/supplementary/hidef_lhcb-logo.png)
![Thumbnail [156 KiB]](Directory_LHCb-PAPER-2015-046/supplementary/thumbnail_lhcb-logo.png)
![HiDef png [88 KiB]](Directory_LHCb-PAPER-2015-046/supplementary/hidef_sigma_eff.png)
Created on 26 April 2024.