Information
LHCb-PAPER-2015-048
CERN-PH-EP-2015-306
arXiv:1512.00322 [PDF]
(Submitted on 01 Dec 2015)
Phys. Lett. B754 (2016) 167
Inspire 1407482
Tools
Abstract
A search for the lepton-flavour violating decay $D^0 \to e^\pm \mu^\mp$ is made with a dataset corresponding to an integrated luminosity of 3.0 fb$^{-1}$ of proton-proton collisions at centre-of-mass energies of $7$ TeV and $8$ TeV, collected by the LHCb experiment. Candidate $D^0$ mesons are selected using the decay $D^{*+} \to D^0 \pi^+$ and the $D^0 \to e^\pm \mu^\mp$ branching fraction is measured using the decay mode $D^0 \to K^-\pi^+$ as a normalisation channel. No significant excess of $D^0 \to e^\pm \mu^\mp$ candidates over the expected background is seen, and a limit is set on the branching fraction, $\mathcal{B}(D^0 \to e^\pm \mu^\mp) < 1.3 \times 10^{-8}$, at 90 confidence level. This is an order of magnitude lower than the previous limit and it further constrains the parameter space in some leptoquark models and in supersymmetric models with R-parity violation.
Figures and captions
|
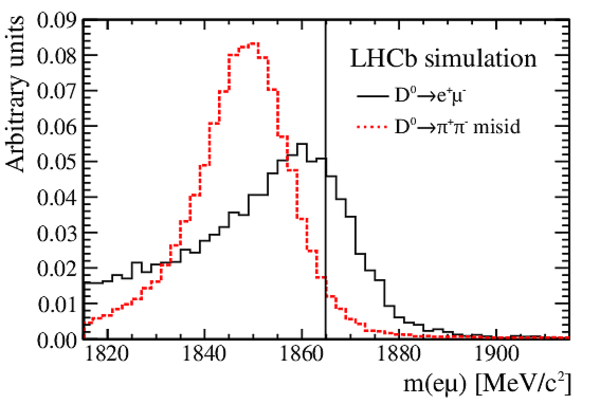
Mass spectra from simulation for $ D^0 \rightarrow e^\pm \mu^\mp$ decays (solid line) and $ D^0 \rightarrow \pi ^+ \pi ^- $ decays reconstructed as $ D^0 \rightarrow e^\pm \mu^\mp$ (dashed line). Each spectrum is normalized to unit area. The vertical line indicates the mass of the $ D ^0$ meson. |
Fig1.pdf [25 KiB] HiDef png [183 KiB] Thumbnail [180 KiB] *.C file |
|
|
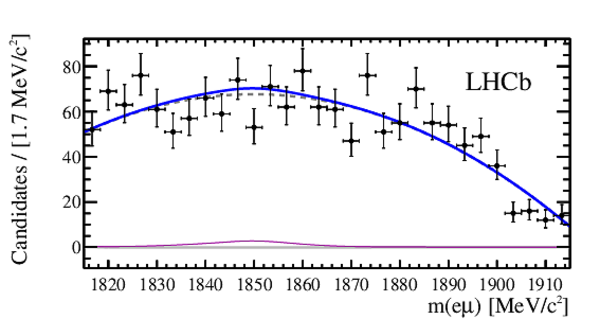
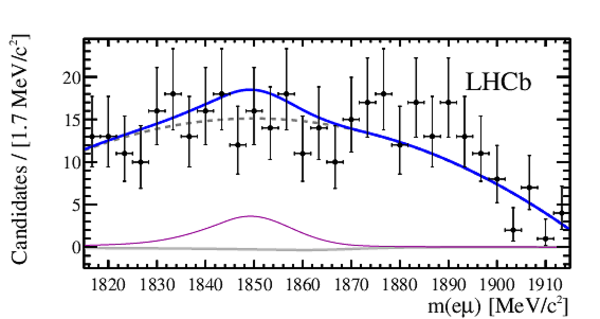
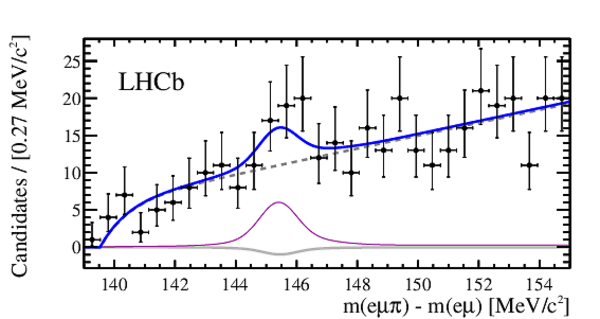
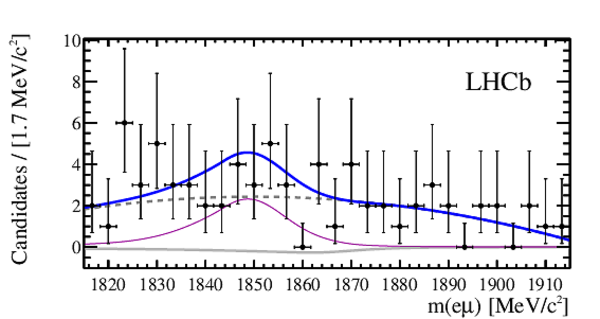
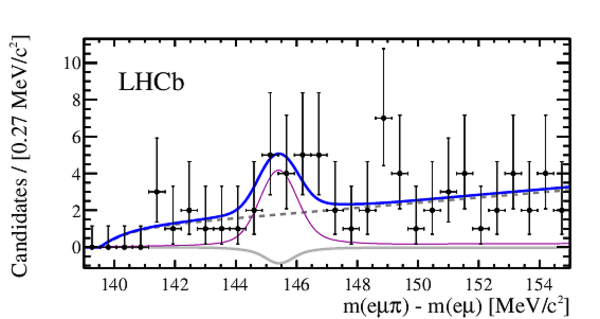
Distributions of (left) $m( D ^0 )$ and (right) $\Delta m$ for $ D^0 \rightarrow e^\pm \mu^\mp$ candidates reconstructed in the combined $7$ $\mathrm{ Te V}$ and $8$ $\mathrm{ Te V}$ data, with fit functions overlaid. The rows correspond to the three bins of BDT output, with the top row corresponding to the most background-like and the bottom row to the most signal-like. The solid (blue) lines show the total fit results, while the thick (grey) lines show the total $ D^0 \rightarrow e^\pm \mu^\mp$ component, the thin (purple) lines show the total misidentified $ D^0 \rightarrow \pi ^+ \pi ^- $ and the dashed (grey) lines indicate the combinatorial background. |
Fig2a.pdf [34 KiB] HiDef png [175 KiB] Thumbnail [153 KiB] *.C file |
|
|
Fig2b.pdf [37 KiB] HiDef png [159 KiB] Thumbnail [141 KiB] *.C file |

|
|
|
Fig2c.pdf [35 KiB] HiDef png [190 KiB] Thumbnail [165 KiB] *.C file |
|
|
|
Fig2d.pdf [38 KiB] HiDef png [180 KiB] Thumbnail [157 KiB] *.C file |
|
|
|
Fig2e.pdf [35 KiB] HiDef png [193 KiB] Thumbnail [161 KiB] *.C file |
|
|
|
Fig2f.pdf [38 KiB] HiDef png [180 KiB] Thumbnail [154 KiB] *.C file |
|
|
|
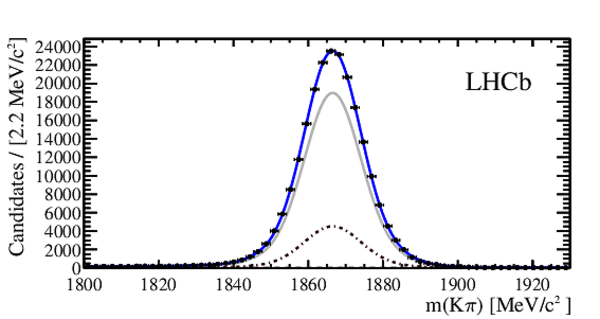
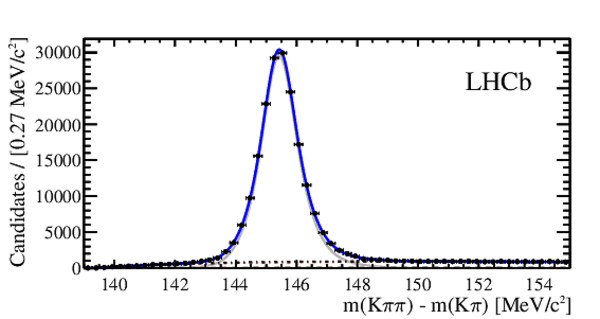
Distributions of (left) $m( D ^0 )$ and (right) $\Delta m$ for $K^-\pi^+$ candidates for the $8$ $\mathrm{ Te V}$ data. The dark (blue) line shows the overall fit, the lighter grey line shows the signal, and the dot-dash line shows genuine $ D ^0$ events where the soft pion does not come from a $ D ^{*+}$ decay. The combinatorial background is too small to be visible. |
Fig3a.pdf [51 KiB] HiDef png [206 KiB] Thumbnail [172 KiB] *.C file |
|
|
Fig3b.pdf [47 KiB] HiDef png [182 KiB] Thumbnail [149 KiB] *.C file |
|
|
|
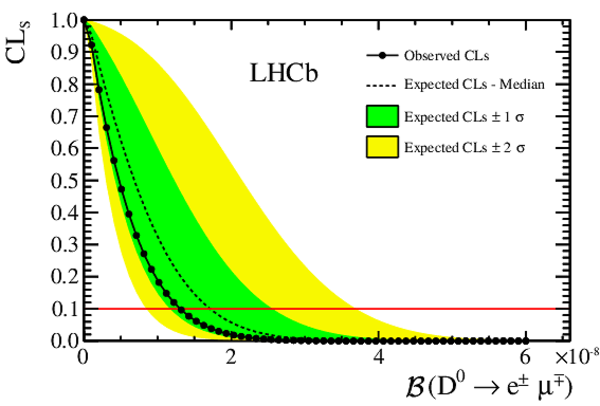
Distribution of CL$_{\text S}$ as a function of $ {\cal B}(D^0 \rightarrow e^\pm \mu^\mp)$ . The expected distribution is shown by the dashed line, with the $\pm 1\sigma$ and $\pm 2\sigma$ regions shaded. The observed distribution is shown by the solid line connecting the data points. The horizontal line indicates the $90\%$ confidence level. |
Fig4.pdf [112 KiB] HiDef png [211 KiB] Thumbnail [172 KiB] *.C file |
|
|
Animated gif made out of all figures. |
PAPER-2015-048.gif Thumbnail |

|
![HiDef png [183 KiB]](Directory_LHCb-PAPER-2015-048/hidef_Fig1.png)
![HiDef png [175 KiB]](Directory_LHCb-PAPER-2015-048/hidef_Fig2a.png)
![HiDef png [159 KiB]](Directory_LHCb-PAPER-2015-048/hidef_Fig2b.png)
![HiDef png [190 KiB]](Directory_LHCb-PAPER-2015-048/hidef_Fig2c.png)
![HiDef png [180 KiB]](Directory_LHCb-PAPER-2015-048/hidef_Fig2d.png)
![HiDef png [193 KiB]](Directory_LHCb-PAPER-2015-048/hidef_Fig2e.png)
![HiDef png [180 KiB]](Directory_LHCb-PAPER-2015-048/hidef_Fig2f.png)
![HiDef png [206 KiB]](Directory_LHCb-PAPER-2015-048/hidef_Fig3a.png)
![HiDef png [182 KiB]](Directory_LHCb-PAPER-2015-048/hidef_Fig3b.png)
![HiDef png [211 KiB]](Directory_LHCb-PAPER-2015-048/hidef_Fig4.png)
Created on 27 April 2024.