Observation of $B^0_s\to\bar{D}^0 K^0_S$ and evidence for $B^0_s\to\bar{D}^{*0} K^0_S$ decays
[to restricted-access page]Information
LHCb-PAPER-2015-050
CERN-EP-2016-053
arXiv:1603.02408 [PDF]
(Submitted on 08 Mar 2016)
Phys. Rev. Lett. 116 (2016) 161802
Inspire 1426694
Tools
Abstract
The first observation of the $B^0_s\to\bar{D}^0 K^0_S$ decay mode and evidence for the $B^0_s\to\bar{D}^{*0} K^0_S$ decay mode are reported. The data sample corresponds to an integrated luminosity of 3.0 $\text{fb}^{-1}$ collected in $pp$ collisions by LHCb at center-of-mass energies of 7 and 8 TeV. The branching fractions are measured to be \begin{align*} \mathcal{B}(B^0_s\to\bar{D}^0 \bar{K}^0) &= (4.3\pm0.5(\text{stat})\pm0.3(\text{syst})\pm0.3(\text{frag})\pm0.6(\text{norm}))\times10^{-4},\\ \mathcal{B}(B^0_s\to\bar{D}^{*0} \bar{K}^0) &= (2.8\pm1.0(\text{stat})\pm0.3(\text{syst})\pm0.2(\text{frag})\pm0.4(\text{norm}))\times10^{-4}, \end{align*} where the uncertainties are due to contributions coming from statistical precision, systematic effects, and the precision of two external inputs, the ratio $f_s/f_d$ and the branching fraction of $B^0\to\bar{D}^0 K^0_S$, which is used as a calibration channel.
Figures and captions
|
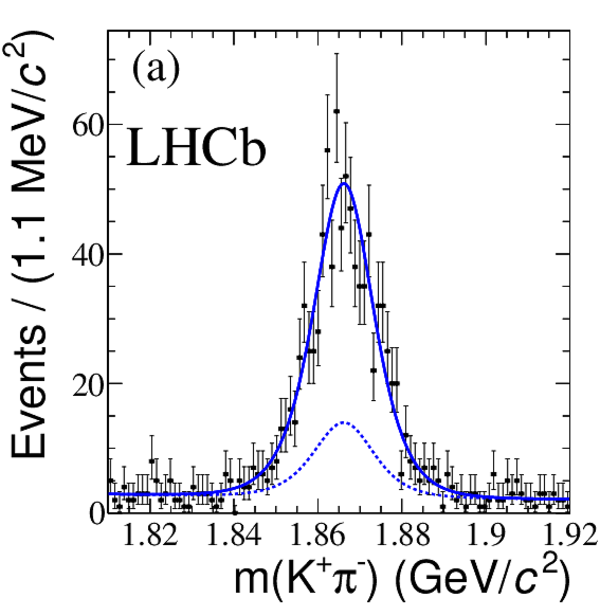
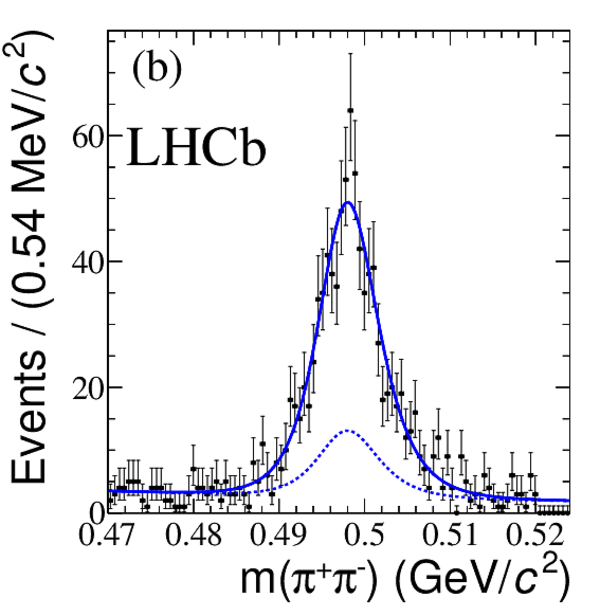
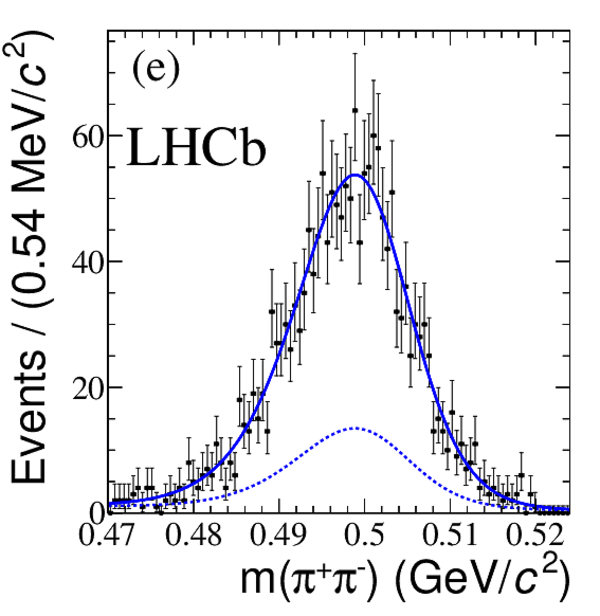
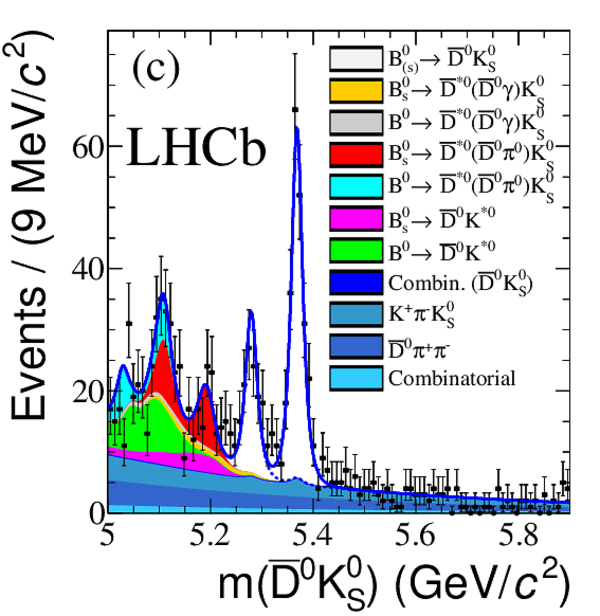
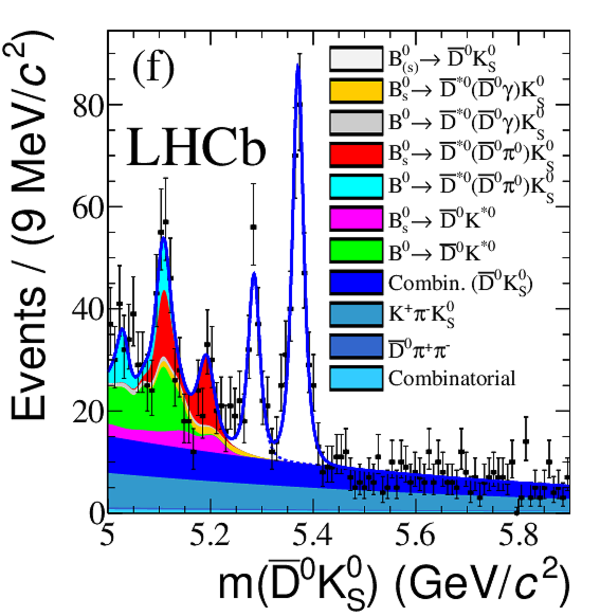
The projection of the fit results (solid line) on the data sample (points) is shown for the $\overline{ D }{} {}^0$ candidate (a,d), the $ K ^0_{\mathrm{ \scriptscriptstyle S}}$ candidate (b,e) and $ B $ candidate (c,f) mass spectra. The long $ K ^0_{\mathrm{ \scriptscriptstyle S}}$ sample is shown in (a,b,c), and the downstream sample in (d,e,f). The dashed line in the $\overline{ D }{} {}^0$ and $ K ^0_{\mathrm{ \scriptscriptstyle S}}$ candidate mass plots represents events corresponding to background categories $\mathcal{S}_{2,3,4}$ in the fit, and includes peaks due to, for example, real $\overline{ D }{} {}^0$ mesons paired with two random pions. The double-peak behavior of the $ B_{(s)}^0 \rightarrow \overline{ D }{} {}^{*0} (\overline{ D }{} {}^0 \pi ^0 ) K ^0_{\mathrm{ \scriptscriptstyle S}} $ shape is due to the missing momentum of the $\pi ^0$ and the helicity amplitude of the $\overline{ D }{} {}^{*0} \rightarrow \overline{ D }{} {}^0 \pi ^0 $ decay. |
fig1a.pdf [23 KiB] HiDef png [262 KiB] Thumbnail [231 KiB] *.C file |
|
|
fig1b.pdf [24 KiB] HiDef png [269 KiB] Thumbnail [243 KiB] *.C file |
|
|
|
fig1d.pdf [24 KiB] HiDef png [270 KiB] Thumbnail [242 KiB] *.C file |

|
|
|
fig1e.pdf [24 KiB] HiDef png [280 KiB] Thumbnail [251 KiB] *.C file |
|
|
|
fig1c.pdf [41 KiB] HiDef png [469 KiB] Thumbnail [366 KiB] *.C file |
|
|
|
fig1f.pdf [42 KiB] HiDef png [466 KiB] Thumbnail [372 KiB] *.C file |
|
|
|
Animated gif made out of all figures. |
PAPER-2015-050.gif Thumbnail |

|
![HiDef png [262 KiB]](Directory_LHCb-PAPER-2015-050/hidef_fig1a.png)
![HiDef png [269 KiB]](Directory_LHCb-PAPER-2015-050/hidef_fig1b.png)
![HiDef png [270 KiB]](Directory_LHCb-PAPER-2015-050/hidef_fig1d.png)
![HiDef png [280 KiB]](Directory_LHCb-PAPER-2015-050/hidef_fig1e.png)
![HiDef png [469 KiB]](Directory_LHCb-PAPER-2015-050/hidef_fig1c.png)
![HiDef png [466 KiB]](Directory_LHCb-PAPER-2015-050/hidef_fig1f.png)
Tables and captions
|
Summary of the systematic uncertainties. |
Table_1.pdf [66 KiB] HiDef png [53 KiB] Thumbnail [24 KiB] tex code |

|
![HiDef png [53 KiB]](Directory_LHCb-PAPER-2015-050/hidef_Table_1.png)
Created on 02 May 2024.