Study of $D^{(*)+}_{sJ}$ mesons decaying to $D^{*+} K^0_{\rm S}$ and $D^{*0} K^+$ final states
[to restricted-access page]Information
LHCb-PAPER-2015-052
CERN-PH-EP-2015-322
arXiv:1601.01495 [PDF]
(Submitted on 07 Jan 2016)
JHEP 02 (2016) 133
Inspire 1414195
Tools
Abstract
A search is performed for $D^{(*)+}_{sJ}$ mesons in the reactions $pp \to D^{*+} K^0_{\rm S} X$ and $pp \to D^{*0} K^+ X$ using data collected at centre-of-mass energies of 7 and 8 TeV with the LHCb detector. For the $D^{*+} K^0_{\rm S}$ final state, the decays $D^{*+} \to D^0 \pi^+$ with $D^0 \to K^- \pi^+$ and $D^0 \to K^- \pi^+ \pi^+ \pi^-$ are used. For $D^{*0} K^+$, the decay $D^{*0} \to D^0 \pi^0$ with $D^0 \to K^- \pi^+$ is used. A prominent $D_{s1}(2536)^+$ signal is observed in both $D^{*+} K^0_{\rm S}$ and $D^{*0} K^+$ final states. The resonances $D^*_{s1}(2700)^+$ and $D^*_{s3}(2860)^+$ are also observed, yielding information on their properties, including spin-parity assignments. The decay $D^*_{s2}(2573)^+ \to D^{*+} K^0_{\rm S}$ is observed for the first time, at a significance of 6.9 $\sigma$, and its branching fraction relative to the $D^*_{s2}(2573)^+ \to D^+ K^0_{\rm S}$ decay mode is measured.
Figures and captions
|
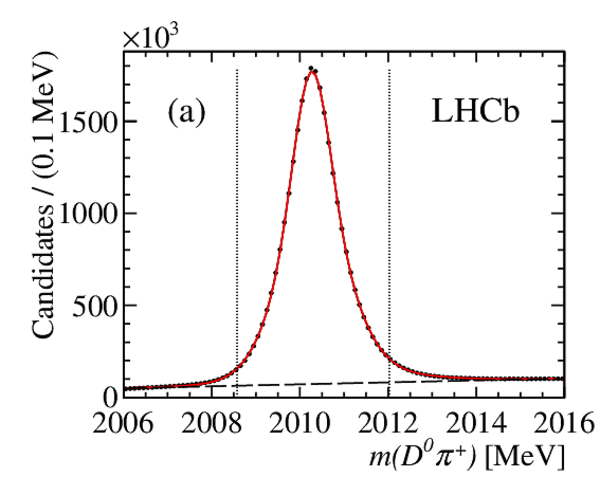
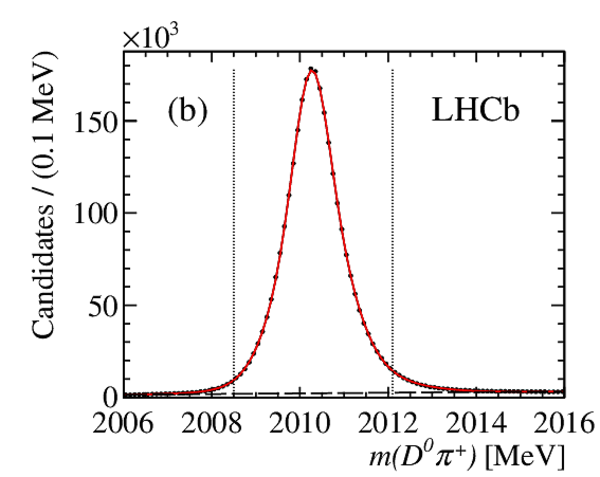
Distributions of $ D ^0 \pi ^+ $ invariant mass for (a) $ D ^0 \rightarrow K ^- \pi ^+ $ and (b) $ D ^0 \rightarrow K ^- \pi ^+ \pi ^+ \pi ^- $ . $\pi ^+ \pi ^- $ mass spectrum for (c) long and (d) downstream $ K ^0_{\mathrm{ \scriptscriptstyle S}}$ . The full (red) lines describe the fitting function. The dashed lines show the background contributions and the vertical dotted lines indicate the signal regions. |
fig1a.pdf [20 KiB] HiDef png [219 KiB] Thumbnail [179 KiB] *.C file |
|
|
fig1b.pdf [20 KiB] HiDef png [212 KiB] Thumbnail [173 KiB] *.C file |
|
|
|
fig1c.pdf [17 KiB] HiDef png [186 KiB] Thumbnail [151 KiB] *.C file |

|
|
|
fig1d.pdf [19 KiB] HiDef png [204 KiB] Thumbnail [169 KiB] *.C file |

|
|
|
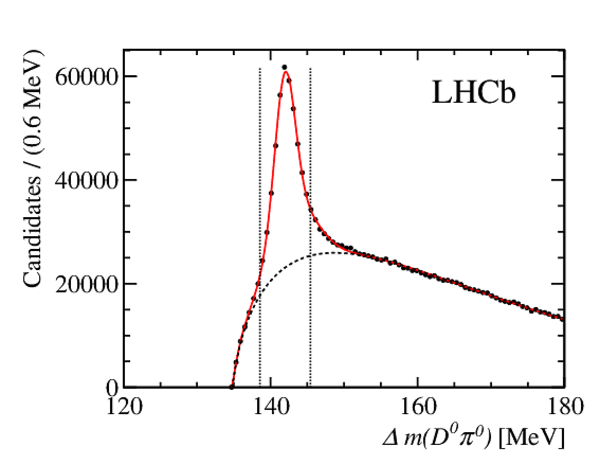
Distribution of $\Delta m( D ^0 \pi ^0 )$ invariant mass. The full (red) line describes the fitting function. The dashed line shows the background contribution and the dotted vertical lines define the $D^{*0}$ signal region. |
fig2.pdf [16 KiB] HiDef png [165 KiB] Thumbnail [138 KiB] *.C file |
|
|
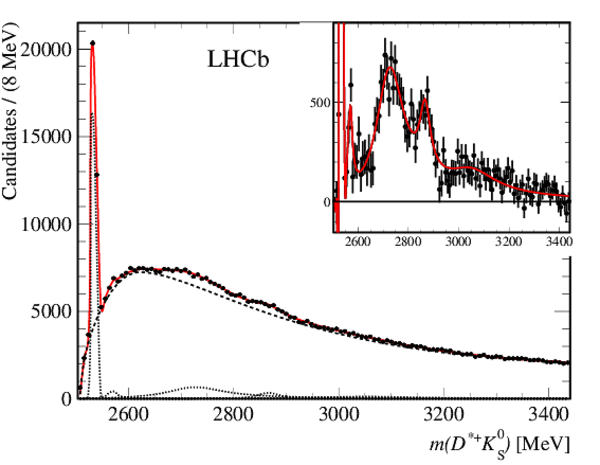
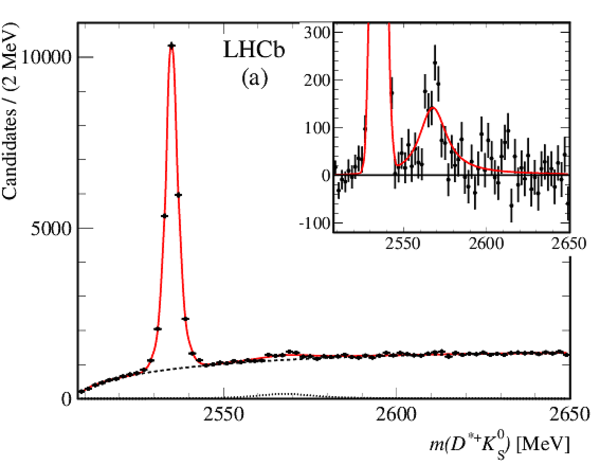
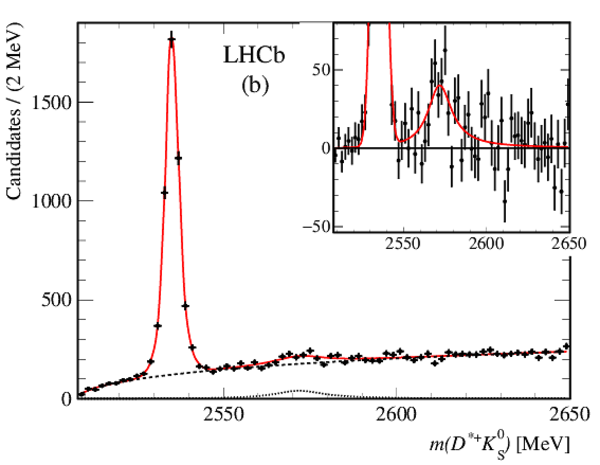
Distribution of the $ D ^{*+} K ^0_{\mathrm{ \scriptscriptstyle S}} $ invariant mass for $ D ^0 \rightarrow K ^- \pi ^+ $ decay. The full (red) line describes the fitting function. The dashed line displays the fitted background and the dotted lines the $ D_{s1}(2536)^{+}$ , $ D^*_{s2}(2573)^{+}$ , $ D^*_{s1}(2700)^+$ , $ D_{sJ}^{*}(2860)^+$ and $ D_{sJ}(3040)^+$ contributions. The inset displays the $ D ^{*+} K ^0_{\mathrm{ \scriptscriptstyle S}} $ mass spectrum after subtracting the fitted background. |
fig3.pdf [40 KiB] HiDef png [287 KiB] Thumbnail [229 KiB] *.C file |
|
|
Mass spectrum of $ D ^{*+} K ^0_{\mathrm{ \scriptscriptstyle S}} $ candidates for $ D ^0 \rightarrow K ^- \pi ^+ $ in (a) the NP sample, and (b) the UP sample. The full (red) lines describe the fitting function. The dashed lines show the fitted background and the dotted lines the $ D^*_{s2}(2573)^{+}$ , $ D^*_{s1}(2700)^+$ , $ D_{sJ}^{*}(2860)^+$ and $ D_{sJ}(3040)^+$ contributions. The insets display the $ D ^{*+} K ^0_{\mathrm{ \scriptscriptstyle S}} $ mass spectrum after subtracting the fitted background. |
fig4a.pdf [44 KiB] HiDef png [305 KiB] Thumbnail [243 KiB] *.C file |

|
|
fig4b.pdf [43 KiB] HiDef png [287 KiB] Thumbnail [238 KiB] *.C file |
|
|
|
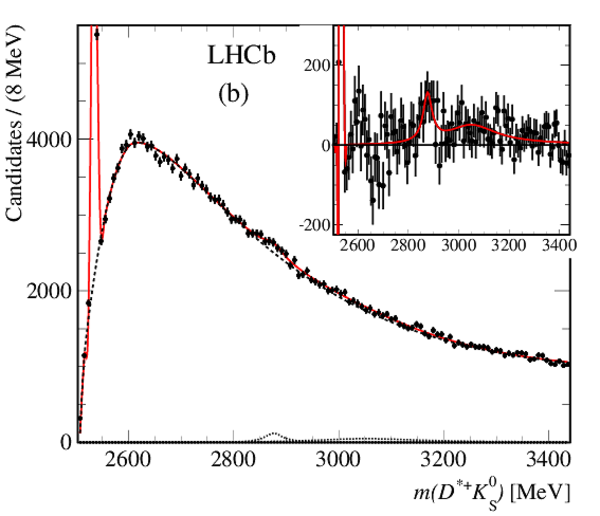
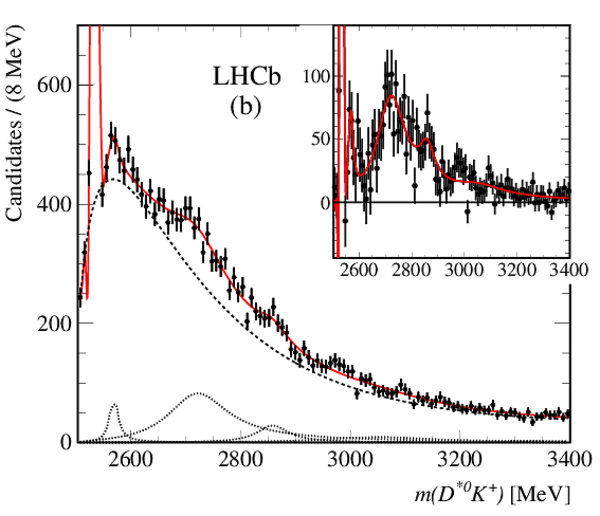
Mass spectrum of (a) $ D ^{*+} K ^0_{\mathrm{ \scriptscriptstyle S}} $ candidates for $ D ^0 \rightarrow K ^- \pi ^+ \pi ^+ \pi ^- $ , and (b) $ D ^{*0} K ^+ $ candidates for the NP sample. The full (red) lines describe the fitting function. The dashed lines show the fitted background and the dotted lines the $ D^*_{s2}(2573)^{+}$ , $ D^*_{s1}(2700)^+$ , $ D_{sJ}^{*}(2860)^+$ and $ D_{sJ}(3040)^+$ contributions. The insets display the $ D ^{*+} K ^0_{\mathrm{ \scriptscriptstyle S}} $ and $ D ^{*0} K ^+ $ mass spectra after subtracting the fitted background. |
fig5a.pdf [45 KiB] HiDef png [340 KiB] Thumbnail [293 KiB] *.C file |

|
|
fig5b.pdf [43 KiB] HiDef png [323 KiB] Thumbnail [276 KiB] *.C file |
|
|
|
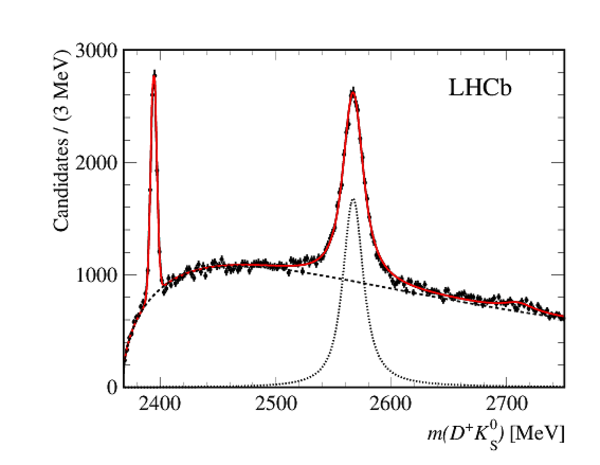
Distribution of the invariant mass of $ D ^+ K ^0_{\mathrm{ \scriptscriptstyle S}} $ candidates from Ref. [10]. The full (red) line is the result from the fit described in the text. The dashed line indicates the fitted background and the dotted line shows the fitted $ D^*_{s2}(2573)^{+}$ contribution. |
fig6.pdf [28 KiB] HiDef png [208 KiB] Thumbnail [156 KiB] *.C file |
|
|
Mass spectra, in the $ D_{s1}(2536)^{+}$ mass region, for the NP sample of (a) $ D ^{*+} K ^0_{\mathrm{ \scriptscriptstyle S}} $ with $ D ^0 \rightarrow K ^- \pi ^+ $ , (b) $ D ^{*+} K ^0_{\mathrm{ \scriptscriptstyle S}} $ with $ D ^0 \rightarrow K ^- \pi ^+ \pi ^+ \pi ^- $ , and (c) $ D ^{*0} K ^+ $ final states. The full (red) lines describe the fitting function. The dashed lines show the fitted background and the dotted lines the $ D^*_{s2}(2573)^{+}$ contributions. The insets display the $ D ^* K$ mass spectra after subtracting the fitted background. |
fig7a.pdf [25 KiB] HiDef png [228 KiB] Thumbnail [186 KiB] *.C file |
|
|
fig7b.pdf [26 KiB] HiDef png [235 KiB] Thumbnail [192 KiB] *.C file |
|
|
|
fig7c.pdf [24 KiB] HiDef png [215 KiB] Thumbnail [174 KiB] *.C file |

|
|
|
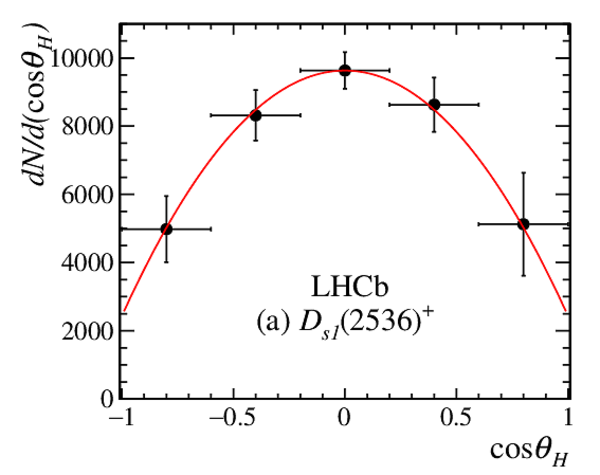
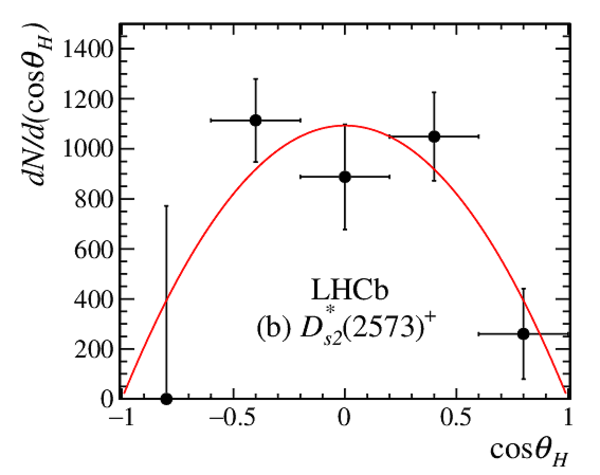
Distributions of the measured signal yields for (a) $ D_{s1}(2536)^{+}$ and (b) $ D^*_{s2}(2573)^{+}$ as a function of the helicity angle $\cos\theta_{\rm H}$ . The distributions are fitted with UP (a) and NP (b) functions. |
fig8a.pdf [14 KiB] HiDef png [156 KiB] Thumbnail [136 KiB] *.C file |
|
|
fig8b.pdf [14 KiB] HiDef png [163 KiB] Thumbnail [143 KiB] *.C file |
|
|
|
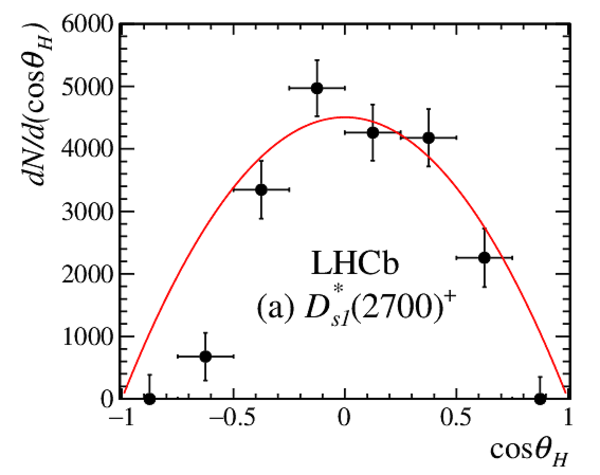
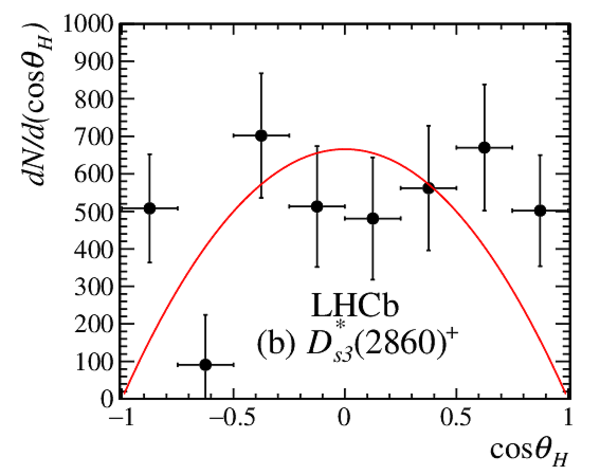
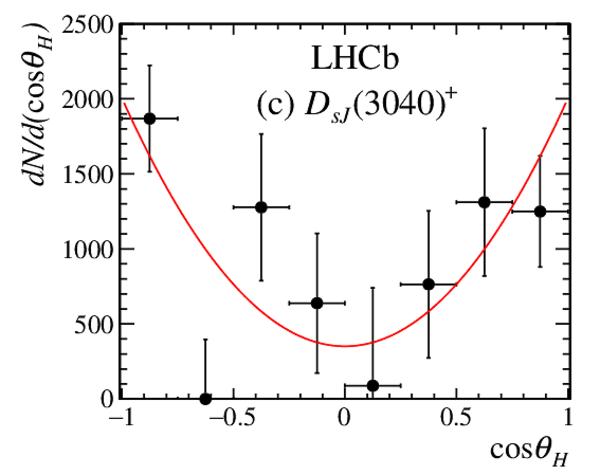
Distributions of the measured signal yields for (a) $ D^*_{s1}(2700)^+$ , (b) $ D_{sJ}^{*}(2860)^+$ and (c) $ D_{sJ}(3040)^+$ as a function of the helicity angle $\cos\theta_{\rm H}$ . The distributions are fitted with NP (a,b) and UP (c) functions. |
fig9a.pdf [15 KiB] HiDef png [171 KiB] Thumbnail [153 KiB] *.C file |
|
|
fig9b.pdf [15 KiB] HiDef png [187 KiB] Thumbnail [174 KiB] *.C file |
|
|
|
fig9c.pdf [15 KiB] HiDef png [162 KiB] Thumbnail [143 KiB] *.C file |
|
|
|
Animated gif made out of all figures. |
PAPER-2015-052.gif Thumbnail |

|
![HiDef png [219 KiB]](Directory_LHCb-PAPER-2015-052/hidef_fig1a.png)
![HiDef png [212 KiB]](Directory_LHCb-PAPER-2015-052/hidef_fig1b.png)
![HiDef png [186 KiB]](Directory_LHCb-PAPER-2015-052/hidef_fig1c.png)
![HiDef png [204 KiB]](Directory_LHCb-PAPER-2015-052/hidef_fig1d.png)
![HiDef png [165 KiB]](Directory_LHCb-PAPER-2015-052/hidef_fig2.png)
![HiDef png [287 KiB]](Directory_LHCb-PAPER-2015-052/hidef_fig3.png)
![HiDef png [305 KiB]](Directory_LHCb-PAPER-2015-052/hidef_fig4a.png)
![HiDef png [287 KiB]](Directory_LHCb-PAPER-2015-052/hidef_fig4b.png)
![HiDef png [340 KiB]](Directory_LHCb-PAPER-2015-052/hidef_fig5a.png)
![HiDef png [323 KiB]](Directory_LHCb-PAPER-2015-052/hidef_fig5b.png)
![HiDef png [208 KiB]](Directory_LHCb-PAPER-2015-052/hidef_fig6.png)
![HiDef png [228 KiB]](Directory_LHCb-PAPER-2015-052/hidef_fig7a.png)
![HiDef png [235 KiB]](Directory_LHCb-PAPER-2015-052/hidef_fig7b.png)
![HiDef png [215 KiB]](Directory_LHCb-PAPER-2015-052/hidef_fig7c.png)
![HiDef png [156 KiB]](Directory_LHCb-PAPER-2015-052/hidef_fig8a.png)
![HiDef png [163 KiB]](Directory_LHCb-PAPER-2015-052/hidef_fig8b.png)
![HiDef png [171 KiB]](Directory_LHCb-PAPER-2015-052/hidef_fig9a.png)
![HiDef png [187 KiB]](Directory_LHCb-PAPER-2015-052/hidef_fig9b.png)
![HiDef png [162 KiB]](Directory_LHCb-PAPER-2015-052/hidef_fig9c.png)
Tables and captions
|
Results from the fits to the $ D ^{*+} K ^0_{\mathrm{ \scriptscriptstyle S}} $ and $ D ^{*0} K ^+ $ mass spectra. Resonances parameters are expressed in $\mathrm{ Me V}$ . When two uncertainties are presented, the first is statistical and the second systematic. The symbol ndf indicates the number of degrees of freedom. |
Table_1.pdf [63 KiB] HiDef png [137 KiB] Thumbnail [64 KiB] tex code |

|
|
Contributions (in $\mathrm{ Me V}$ ) to the systematic uncertainties on the $ D^*_{s1}(2700)^+ $ and $ D_{sJ}^{*}(2860)^+ $ resonances parameters. |
Table_2.pdf [46 KiB] HiDef png [37 KiB] Thumbnail [16 KiB] tex code |

|
|
Results from the fits to the $ D ^+ K ^0_{\mathrm{ \scriptscriptstyle S}} $ and $ D ^{*+} K ^0_{\mathrm{ \scriptscriptstyle S}} $ mass spectra for the evaluation of the $ D^*_{s2}(2573)^{+} \rightarrow D ^{*+} K ^0_{\mathrm{ \scriptscriptstyle S}} $ relative branching fraction. |
Table_3.pdf [62 KiB] HiDef png [68 KiB] Thumbnail [32 KiB] tex code |

|
|
Measurements used to evaluate the $ D^*_{s2}(2573)^{+}$ relative branching fraction $\cal B ( D^*_{s2}(2573)^{+} \rightarrow D ^{*+} K ^0_{\mathrm{ \scriptscriptstyle S}} )/\cal B ( D^*_{s2}(2573)^{+} \rightarrow D ^+ K ^0_{\mathrm{ \scriptscriptstyle S}} )$. |
Table_4.pdf [61 KiB] HiDef png [36 KiB] Thumbnail [14 KiB] tex code |

|
|
Relative systematic uncertainties in the evaluation of the ratio of branching fractions $\cal R$ . |
Table_5.pdf [47 KiB] HiDef png [53 KiB] Thumbnail [23 KiB] tex code |

|
|
Values of $\chi^2/{\rm ndf}$ from the fits to the helicity angles distributions. |
Table_6.pdf [46 KiB] HiDef png [86 KiB] Thumbnail [41 KiB] tex code |

|
![HiDef png [137 KiB]](Directory_LHCb-PAPER-2015-052/hidef_Table_1.png)
![HiDef png [37 KiB]](Directory_LHCb-PAPER-2015-052/hidef_Table_2.png)
![HiDef png [68 KiB]](Directory_LHCb-PAPER-2015-052/hidef_Table_3.png)
![HiDef png [36 KiB]](Directory_LHCb-PAPER-2015-052/hidef_Table_4.png)
![HiDef png [53 KiB]](Directory_LHCb-PAPER-2015-052/hidef_Table_5.png)
![HiDef png [86 KiB]](Directory_LHCb-PAPER-2015-052/hidef_Table_6.png)
Created on 27 April 2024.