Measurement of the difference of time-integrated CP asymmetries in $D^0 \rightarrow K^{-} K^{+} $ and $D^0 \rightarrow \pi^{-} \pi^{+} $ decays
[to restricted-access page]Information
LHCb-PAPER-2015-055
CERN-EP-2016-022
arXiv:1602.03160 [PDF]
(Submitted on 09 Feb 2016)
Phys. Rev. Lett. 116 (2016) 191601
Inspire 1420555
Tools
Abstract
A search for CP violation in $D^0 \rightarrow K^{-} K^{+} $ and $D^0 \rightarrow \pi^{-} \pi^{+} $ decays is performed using $pp$ collision data, corresponding to an integrated luminosity of $3 fb^{-1}$, collected using the LHCb detector at centre-of-mass energies of 7 and $8 $TeV. The flavour of the charm meson is inferred from the charge of the pion in $D^{*+}\rightarrow D^0\pi^+$ and $D^{*-}\rightarrow \bar{D^0}\pi^{-}$ decays. The difference between the CP asymmetries in $D^0 \rightarrow K^{-} K^{+} $ and $D^0 \rightarrow \pi^{-} \pi^{+} $ decays, $\Delta A_{CP} \equiv A_{CP}(K^{-} K^{+}) - A_{CP}(\pi^{-} \pi^{+})$, is measured to be $\left( -0.10 \pm 0.08(stat) \pm 0.03(syst) \right) \%$. This is the most precise measurement of a time-integrated CP asymmetry in the charm sector from a single experiment.
Figures and captions
|
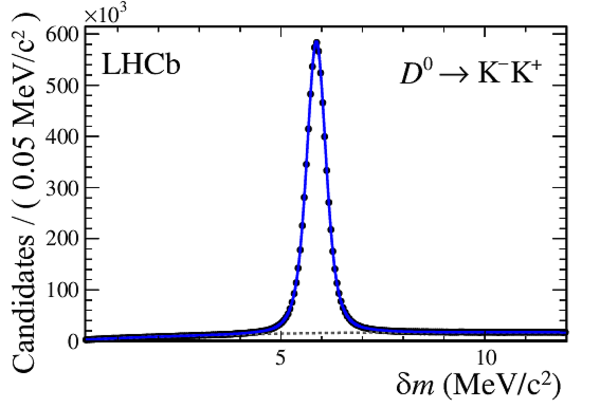
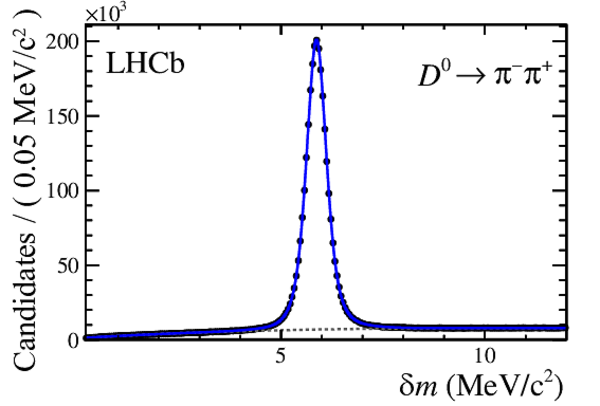
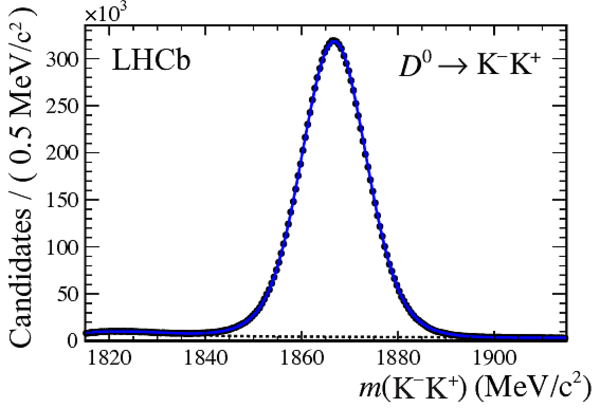
Fit to the $\delta m$ spectra, where the $ D ^0$ is reconstructed in the final state (left) $ K ^- K ^+ $ and (right) $\pi ^- \pi ^+ $. The dashed line corresponds to the background component in the fit. |
Fig1a.pdf [118 KiB] HiDef png [167 KiB] Thumbnail [148 KiB] *.C file |
|
|
Fig1b.pdf [116 KiB] HiDef png [154 KiB] Thumbnail [135 KiB] *.C file |
|
|
|
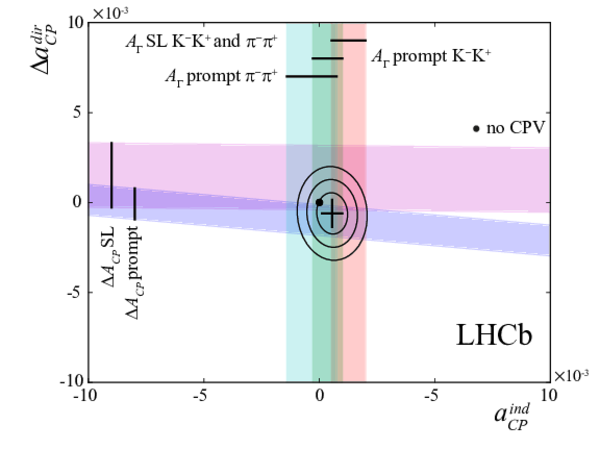
Contour plot of $\Delta a_{ C P }^{\rm dir}$ versus $a_{ C P }^{\rm ind}$. The point at (0,0) denotes the hypothesis of no $ C P$ violation. The solid bands represent the measurements in Refs. [28,45,46] and the one reported in this Letter. The value of $y_ C P $ is taken from Ref. [47]. The contour lines shows the 68%, 95% and 99% confidence-level intervals from the combination. |
Fig2.pdf [372 KiB] HiDef png [219 KiB] Thumbnail [108 KiB] *.C file |
|
|
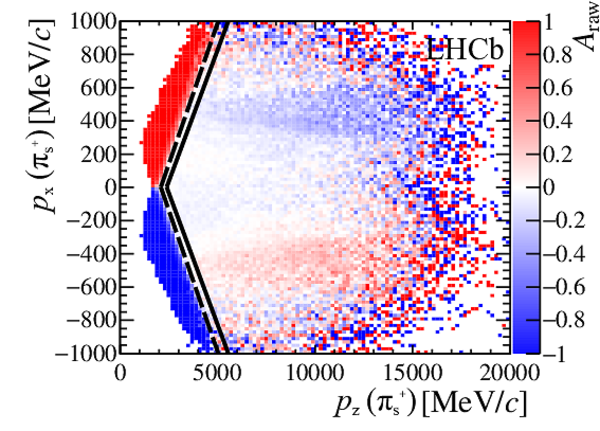
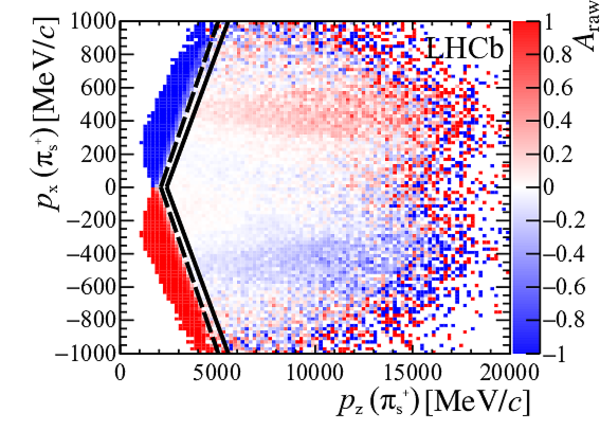
The raw asymmetry, $ A_{\mathrm{raw}}$ , in bins of ($p_z$, $p_x$) of the soft pion with the polarity of the magnet up (left) and down (right). The solid lines show the boundaries corresponding to the baseline selection. The dashed lines represent the edges of the selection used for systematic uncertainty estimation. Candidate $ D ^0 \rightarrow K ^- K ^+ $ decays are shown as an example; however a similar distribution is obtained for $ D ^0 \rightarrow \pi ^- \pi ^+ $ decays\footnotemark. |
Fig3a.pdf [956 KiB] HiDef png [1 MiB] Thumbnail [634 KiB] *.C file |
|
|
Fig3b.pdf [1 MiB] HiDef png [1 MiB] Thumbnail [630 KiB] *.C file |
|
|
|
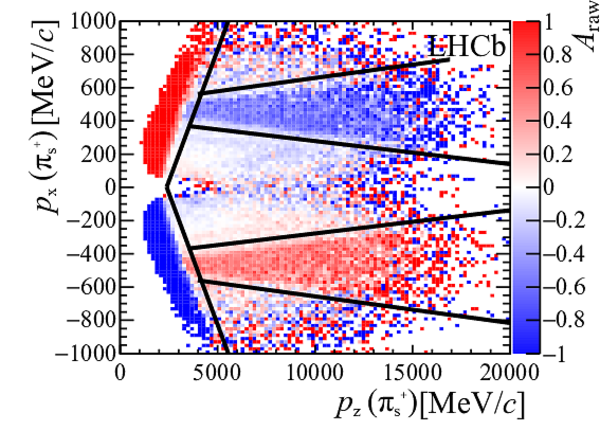
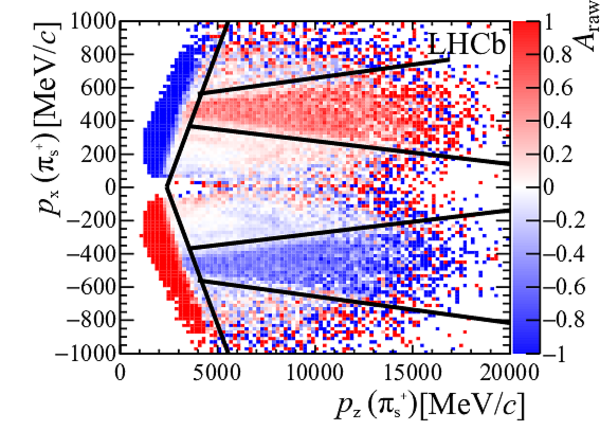
The raw asymmetry, $ A_{\mathrm{raw}}$ , in bins of ($p_z$, $p_x$) of the soft pion with the up (left) and down (right) polarity of the magnetic field. The fiducial requirements (non-instrumented beam pipe region) are superimposed as solid black lines. Only candidates close to the beam pipe region are shown. Candidate $ D ^0 \rightarrow K ^- K ^+ $ decays are shown as an example; however a similar distribution is obtained for $ D ^0 \rightarrow \pi ^- \pi ^+ $ decays. |
Fig4a.pdf [1009 KiB] HiDef png [969 KiB] Thumbnail [604 KiB] *.C file |
|
|
Fig4b.pdf [608 KiB] HiDef png [976 KiB] Thumbnail [610 KiB] *.C file |
|
|
|
Animated gif made out of all figures. |
PAPER-2015-055.gif Thumbnail |

|
Tables and captions
|
Values of $\Delta A_{ C P }$ measured in the disjoint data subsamples, according to magnet polarity (up, down), centre-of-mass energy of data taking ($\sqrt{s} = 7$ and $8$ TeV ) and trigger category (nTOS, TOS). |
Table_1.pdf [39 KiB] HiDef png [99 KiB] Thumbnail [48 KiB] tex code |

|
Supplementary Material [file]


![HiDef png [167 KiB]](Directory_LHCb-PAPER-2015-055/hidef_Fig1a.png)
![HiDef png [154 KiB]](Directory_LHCb-PAPER-2015-055/hidef_Fig1b.png)
![HiDef png [219 KiB]](Directory_LHCb-PAPER-2015-055/hidef_Fig2.png)
![HiDef png [1 MiB]](Directory_LHCb-PAPER-2015-055/hidef_Fig3a.png)
![HiDef png [1 MiB]](Directory_LHCb-PAPER-2015-055/hidef_Fig3b.png)
![HiDef png [969 KiB]](Directory_LHCb-PAPER-2015-055/hidef_Fig4a.png)
![HiDef png [976 KiB]](Directory_LHCb-PAPER-2015-055/hidef_Fig4b.png)
![HiDef png [99 KiB]](Directory_LHCb-PAPER-2015-055/hidef_Table_1.png)
![HiDef png [121 KiB]](Directory_LHCb-PAPER-2015-055/supplementary/hidef_Fig10a.png)
![HiDef png [120 KiB]](Directory_LHCb-PAPER-2015-055/supplementary/hidef_Fig10b.png)
![HiDef png [125 KiB]](Directory_LHCb-PAPER-2015-055/supplementary/hidef_Fig10c.png)
![HiDef png [135 KiB]](Directory_LHCb-PAPER-2015-055/supplementary/hidef_Fig10d.png)
![HiDef png [156 KiB]](Directory_LHCb-PAPER-2015-055/supplementary/hidef_Fig11.png)
![HiDef png [141 KiB]](Directory_LHCb-PAPER-2015-055/supplementary/hidef_Fig12a.png)
![HiDef png [136 KiB]](Directory_LHCb-PAPER-2015-055/supplementary/hidef_Fig12b.png)
![HiDef png [160 KiB]](Directory_LHCb-PAPER-2015-055/supplementary/hidef_Fig5a.png)
![HiDef png [154 KiB]](Directory_LHCb-PAPER-2015-055/supplementary/hidef_Fig5b.png)
![HiDef png [138 KiB]](Directory_LHCb-PAPER-2015-055/supplementary/hidef_Fig5c.png)
![HiDef png [136 KiB]](Directory_LHCb-PAPER-2015-055/supplementary/hidef_Fig5d.png)
![HiDef png [123 KiB]](Directory_LHCb-PAPER-2015-055/supplementary/hidef_Fig6a.png)
![HiDef png [122 KiB]](Directory_LHCb-PAPER-2015-055/supplementary/hidef_Fig6b.png)
![HiDef png [130 KiB]](Directory_LHCb-PAPER-2015-055/supplementary/hidef_Fig6c.png)
![HiDef png [128 KiB]](Directory_LHCb-PAPER-2015-055/supplementary/hidef_Fig6d.png)
![HiDef png [191 KiB]](Directory_LHCb-PAPER-2015-055/supplementary/hidef_Fig7a.png)
![HiDef png [195 KiB]](Directory_LHCb-PAPER-2015-055/supplementary/hidef_Fig7b.png)
![HiDef png [167 KiB]](Directory_LHCb-PAPER-2015-055/supplementary/hidef_Fig8.png)
![HiDef png [123 KiB]](Directory_LHCb-PAPER-2015-055/supplementary/hidef_Fig9a.png)
![HiDef png [118 KiB]](Directory_LHCb-PAPER-2015-055/supplementary/hidef_Fig9b.png)
![HiDef png [129 KiB]](Directory_LHCb-PAPER-2015-055/supplementary/hidef_Fig9c.png)
![HiDef png [338 KiB]](Directory_LHCb-PAPER-2015-055/supplementary/hidef_LHCb-PAPER-2015-055-supplementary.png)
Created on 27 April 2024.