Information
LHCb-PAPER-2016-001
CERN-EP-2016-072
arXiv:1603.07037 [PDF]
(Submitted on 23 Mar 2016)
Phys. Lett. B759 (2016) 313
Inspire 1432698
Tools
Abstract
A search for the decays of the $B_c^+$ meson to $p\bar p\pi^+$ is performed for the first time using a data sample corresponding to an integrated luminosity of 3.0 $\mathrm{fb}^{-1}$ collected by the LHCb experiment in $pp$ collisions at centre-of-mass energies of $7$ and $8$ TeV. No signal is found and an upper limit, at 95% confidence level, is set, $\frac{f_c}{f_u}\times\mathcal{B}(B_c^+\to p\bar p\pi^+)<3.6\times10^{-8}$ in the kinematic region $m(p\bar p)<2.85\mathrm{ Ge V /}c^2$, $p_{\rm T}(B)<20\mathrm{ Ge V /}c$ and $2.0<y(B)<4.5$, where $\mathcal{B}$ is the branching fraction and $f_c$ ($f_u$) is the fragmentation fraction of the $b$ quark into a $B_c^+$ ($B^+$) meson.
Figures and captions
|
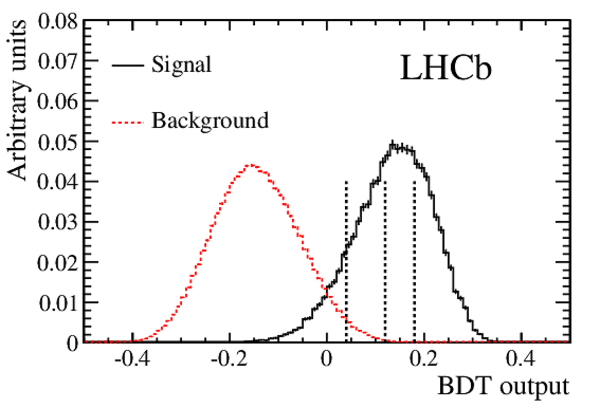
Distributions of BDT output for the $ B _ c ^+ \rightarrow p \overline{p} \pi^{+}$ signal and the background. The vertical dashed lines indicate the lower limits of the three regions in which the signal is determined. |
Fig1.pdf [20 KiB] HiDef png [168 KiB] Thumbnail [170 KiB] *.C file |
|
|
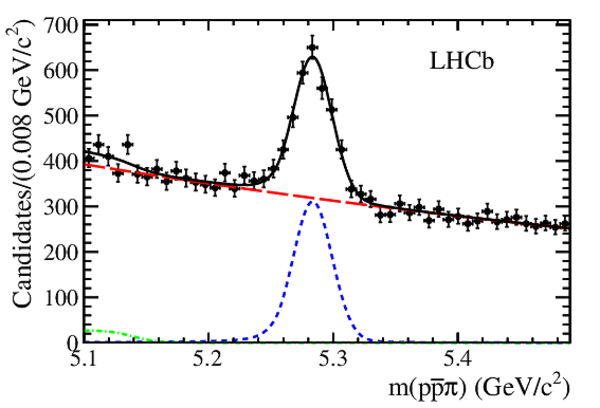
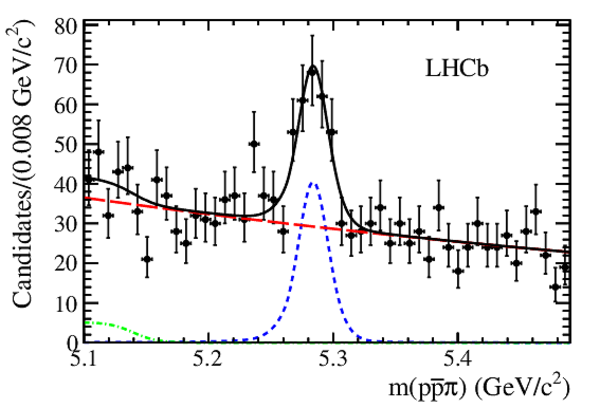
Fits to the $ p \overline p \pi ^+ $ invariant mass in the $ B ^+$ region, for (left) $m( p \overline p )<2.85 {\mathrm{ Ge V /}c^2} $ and (right) $2.85<m( p \overline p )<3.15 {\mathrm{ Ge V /}c^2} $. The blue dashed, red long-dashed and green dotted-dashed lines represent the signal, combinatorial background and partially reconstructed background components, respectively. The error bars show 68% Poisson confidence level intervals. |
Fig2a.pdf [20 KiB] HiDef png [205 KiB] Thumbnail [185 KiB] *.C file |
|
|
Fig2b.pdf [21 KiB] HiDef png [220 KiB] Thumbnail [203 KiB] *.C file |
|
|
|
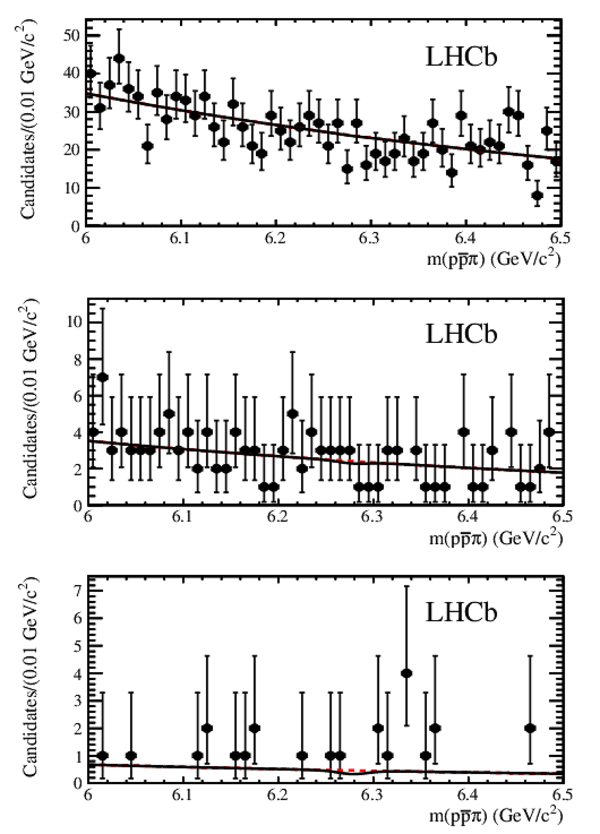
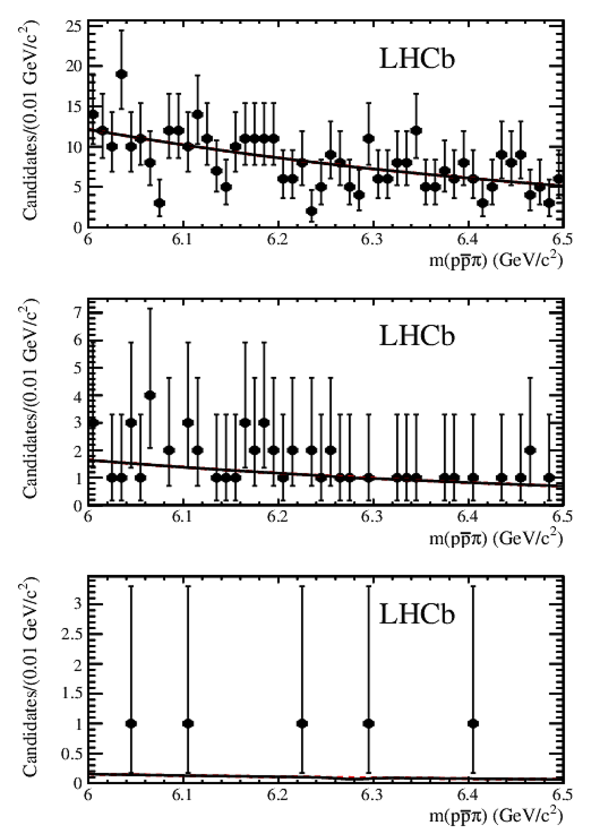
Projection of fits to the $ p \overline p \pi ^+ $ invariant mass in the $ B _ c ^+$ region, in the bins of BDT output (top) $0.04<X<0.12$, (middle) $0.12<X<0.18$ and (bottom) $X>0.18$, for (left) $m( p \overline p )<2.85 {\mathrm{ Ge V /}c^2} $ and (right) $2.85<m( p \overline p )<3.15 {\mathrm{ Ge V /}c^2} $. The red long-dashed lines represent the combinatorial background. The signal and partially reconstructed components are too small to be shown. |
Fig3a.pdf [27 KiB] HiDef png [381 KiB] Thumbnail [407 KiB] *.C file |
|
|
Fig3b.pdf [25 KiB] HiDef png [363 KiB] Thumbnail [373 KiB] *.C file |
|
|
|
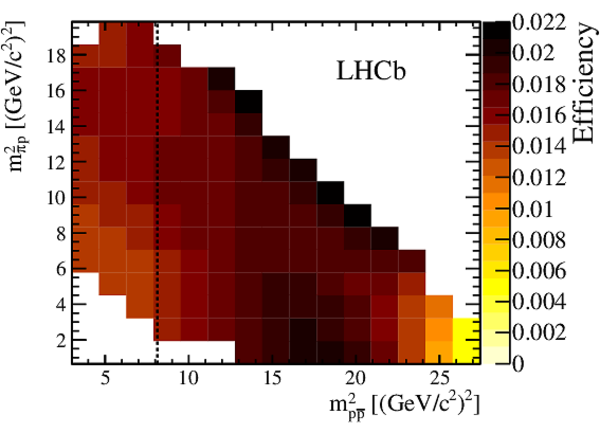
Combined acceptance in the plane $(m^2( p \overline p ),m^2( p \pi))$ for (left) $ B _ c ^+ \rightarrow p \overline{p} \pi^{+}$ and (right) $ B ^+ \rightarrow p \overline{p} \pi^{+}$ events. The vertical dashed line corresponds to $m( p \overline p )=2.85 {\mathrm{ Ge V /}c^2} $. |
Fig4a.pdf [15 KiB] HiDef png [188 KiB] Thumbnail [178 KiB] *.C file |

|
|
Fig4b.pdf [15 KiB] HiDef png [192 KiB] Thumbnail [186 KiB] *.C file |
|
|
|
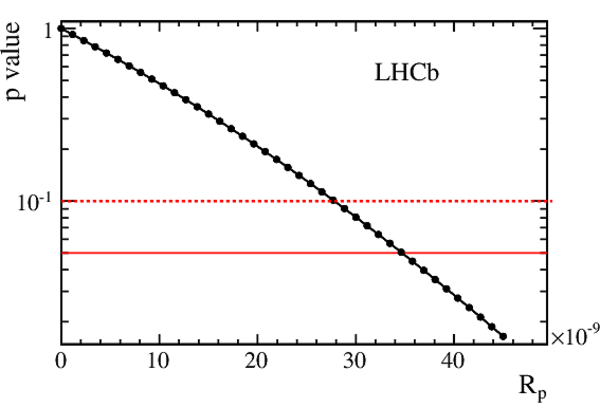
$p$-value profile for (left) $R_p$ and (right) $R_p^ { J \mskip -3mu/\mskip -2mu\psi \mskip 2mu} $. The horizontal red solid and dashed lines indicate the 5% and 10% confidence levels. |
Fig5a.pdf [15 KiB] HiDef png [95 KiB] Thumbnail [85 KiB] *.C file |
|
|
Fig5b.pdf [14 KiB] HiDef png [85 KiB] Thumbnail [76 KiB] *.C file |

|
|
|
Animated gif made out of all figures. |
PAPER-2016-001.gif Thumbnail |

|
![HiDef png [168 KiB]](Directory_LHCb-PAPER-2016-001/hidef_Fig1.png)
![HiDef png [205 KiB]](Directory_LHCb-PAPER-2016-001/hidef_Fig2a.png)
![HiDef png [220 KiB]](Directory_LHCb-PAPER-2016-001/hidef_Fig2b.png)
![HiDef png [381 KiB]](Directory_LHCb-PAPER-2016-001/hidef_Fig3a.png)
![HiDef png [363 KiB]](Directory_LHCb-PAPER-2016-001/hidef_Fig3b.png)
![HiDef png [188 KiB]](Directory_LHCb-PAPER-2016-001/hidef_Fig4a.png)
![HiDef png [192 KiB]](Directory_LHCb-PAPER-2016-001/hidef_Fig4b.png)
![HiDef png [95 KiB]](Directory_LHCb-PAPER-2016-001/hidef_Fig5a.png)
![HiDef png [85 KiB]](Directory_LHCb-PAPER-2016-001/hidef_Fig5b.png)
Tables and captions
|
Relative systematic uncertainties (in %) on the ratio $\epsilon_u/\epsilon_c$ and input branching fractions. |
Table_1.pdf [49 KiB] HiDef png [47 KiB] Thumbnail [20 KiB] tex code |

|
![HiDef png [47 KiB]](Directory_LHCb-PAPER-2016-001/hidef_Table_1.png)
Created on 27 April 2024.