Measurement of $C P$ observables in $B^\pm \rightarrow D K^\pm$ and $B^\pm \rightarrow D \pi^\pm$ with two- and four-body $D$ decays
[to restricted-access page]Information
LHCb-PAPER-2016-003
CERN-EP-2016-065
arXiv:1603.08993 [PDF]
(Submitted on 29 Mar 2016)
Phys. Lett. B760 (2016) 117
Inspire 1436488
Tools
Abstract
Measurements of $C P$ observables in $B^\pm \rightarrow D K^\pm$ and $B^\pm \rightarrow D \pi^\pm$ decays are presented where the $D$ meson is reconstructed in the final states $K^\pm\pi^\mp$, $\pi^\pm K^\mp$, $K^+K^-$, $\pi^+\pi^-$, $K^\pm\pi^\mp \pi^+ \pi^-$, $\pi^\pm K^\mp \pi^+ \pi^-$ and $\pi^+ \pi^- \pi^+ \pi^-$. This analysis uses a sample of charged $B$ mesons from $pp$ collisions collected by the LHCb experiment in 2011 and 2012, corresponding to an integrated luminosity of 3.0 fb$^{-1}$. Various \CP-violating effects are reported and together these measurements provide important input for the determination of the unitarity triangle angle $\gamma$. The analysis of the four-pion $D$ decay mode is the first of its kind.
Figures and captions
|
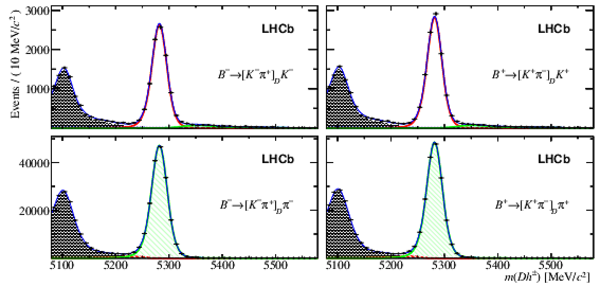
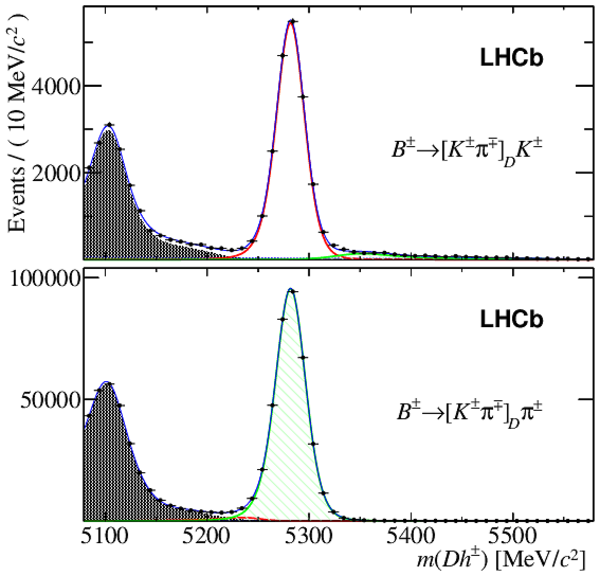
Invariant mass distributions of selected $ B ^\pm \rightarrow [ K ^\pm \pi ^\mp ]_{D}h^{\pm}$ candidates, separated by charge, with $ B ^- {\rm(} B ^+ {\rm)}$ candidates on the left (right). The top plots contain the $ B ^\pm \rightarrow DK^{\pm}$ candidate sample, as defined by a PID requirement on the bachelor particle. The remaining candidates are placed in the bottom row, reconstructed with a pion hypothesis for the bachelor. The red (thick, open) and green (hatched-area) curves represent the $ B ^\pm \rightarrow D K ^\pm $ and $ B ^\pm \rightarrow D \pi ^\pm $ signals. The shaded part indicates partially reconstructed decays, the dotted line, where visible, shows the combinatorial component, and the total PDF is drawn as a thin blue line. |
Fig1.eps [47 KiB] HiDef png [361 KiB] Thumbnail [206 KiB] *.C file |
|
|
Invariant mass distributions of selected $ B ^\pm \rightarrow [\pi ^\pm K ^\mp ]_{D}h^{\pm}$ decays, separated by charge. The dashed pink line left of the signal peak shows partially reconstructed $ B _{s}^{0} \rightarrow [ K ^+ \pi ^- ]_D K ^- \pi ^+ $ decays, where the bachelor pion is missed. The favoured mode cross-feed is also included in the fit, but is too small to be seen. See the caption of Fig. 1 for other definitions. |
Fig2.eps [49 KiB] HiDef png [392 KiB] Thumbnail [231 KiB] *.C file |

|
|
Invariant mass distributions of selected $ B ^\pm \rightarrow [\pi ^+ \pi ^- ]_{D}h^{\pm}$ candidates, separated by charge. The dashed black line represents the residual contribution from charmless decays. This component is present in the $D$ final states considered, but is most visible in this case. See the caption of Fig. 1 for other definitions. |
Fig3.eps [49 KiB] HiDef png [383 KiB] Thumbnail [211 KiB] *.C file |

|
|
Invariant mass distributions of selected $ B ^\pm \rightarrow [ K ^+ K ^- ]_{D}h^{\pm}$ candidates, separated by charge. The dashed cyan line represents partially reconstructed $\Lambda ^0_ b \rightarrow [p^+ K ^- \pi ^+ ]_\Lambda ^+_ c h^-$ decays, where the pion is missed and the proton is misidentified as a kaon. See the caption of Fig. 1 for other definitions. |
Fig4.eps [52 KiB] HiDef png [399 KiB] Thumbnail [223 KiB] *.C file |

|
|
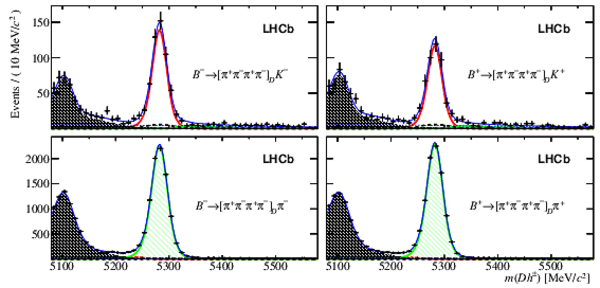
Invariant mass distributions of selected $ B ^\pm \rightarrow [ K ^\pm \pi ^\mp \pi ^+ \pi ^- ]_{D}h^{\pm}$ candidates, separated by charge. See the caption of Fig. 1 for the definitions. |
Fig5.eps [64 KiB] HiDef png [364 KiB] Thumbnail [203 KiB] *.C file |

|
|
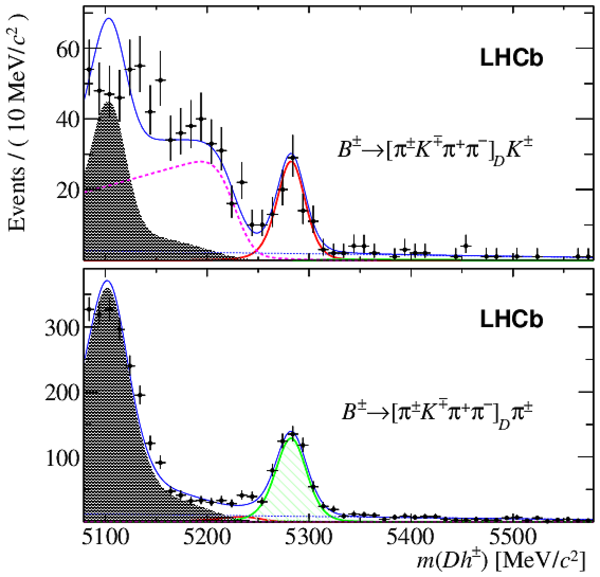
Invariant mass distributions of selected $ B ^\pm \rightarrow [\pi ^\pm K ^\mp \pi ^+ \pi ^- ]_{D}h^{\pm}$ candidates, separated by charge. The dashed pink line left of the signal peak shows partially reconstructed $ B _{s}^{0} \rightarrow [ K ^+ \pi ^- \pi ^+ \pi ^- ]_D K ^- \pi ^+ $ decays, where the bachelor pion is missed. See the caption of Fig. 1 for other definitions. |
Fig6.eps [61 KiB] HiDef png [407 KiB] Thumbnail [241 KiB] *.C file |

|
|
Invariant mass distributions of selected $ B ^\pm \rightarrow [\pi ^+ \pi ^- \pi ^+ \pi ^- ]_{D}h^{\pm}$ candidates, separated by charge. The dashed black line represents the residual contribution from charmless decays. See the caption of Fig. 1 for other definitions. |
Fig7.eps [67 KiB] HiDef png [383 KiB] Thumbnail [218 KiB] *.C file |
|
|
Comparison of selected results with the SM expectation (shaded) based on existing knowledge of the underlying parameters and $ D $ -decay measurements, as described in the text. The first five rows show $ B ^- \rightarrow D K ^- $ observables, two-body $D$ decay on the left and four-body on the right. The last three rows show $ B ^- \rightarrow D\pi ^- $ observables. |
Fig8a.eps [13 KiB] HiDef png [258 KiB] Thumbnail [211 KiB] *.C file |

|
|
Fig8b.eps [13 KiB] HiDef png [222 KiB] Thumbnail [178 KiB] *.C file |

|
|
|
Fig8c.eps [9 KiB] HiDef png [166 KiB] Thumbnail [136 KiB] *.C file |

|
|
|
Fig8d.eps [9 KiB] HiDef png [143 KiB] Thumbnail [119 KiB] *.C file |

|
|
|
Animated gif made out of all figures. |
PAPER-2016-003.gif Thumbnail |

|
Tables and captions
|
Signal yields as measured in the $ B ^- \rightarrow [h^+h^-]_{D}h^-$ and $ B ^- \rightarrow [h^+h^-\pi ^+ \pi ^- ]_{D}h^-$ invariant mass fits, together with their statistical uncertainties. |
Table_1.pdf [56 KiB] HiDef png [180 KiB] Thumbnail [90 KiB] tex code |

|
|
Systematic uncertainties for the $ B ^- \rightarrow [h^+h^-]_{D}h^-$ $ C P$ observables quoted as a percentage of the statistical uncertainty on the observable. PID refers to the PID calibration procedure. Bkg refers to the choice of background shapes and yields in the fit. Sim refers to the use of finite samples of simulated events to determine efficiency ratios. Asym refers to the fixed pion and kaon detection asymmetries, and the assumption of no $ C P$ violation in $ B ^- \rightarrow D ^0 \pi ^- $ decays. |
Table_2.pdf [37 KiB] HiDef png [23 KiB] Thumbnail [8 KiB] tex code |

|
|
Statistical correlation matrix from for the 2-body fit. |
Table_4.pdf [33 KiB] HiDef png [53 KiB] Thumbnail [22 KiB] tex code |

|
|
Statistical correlation matrix from for the 4-body fit. |
Table_5.pdf [34 KiB] HiDef png [44 KiB] Thumbnail [18 KiB] tex code |

|
|
Correlation matrix for the systematic uncertainties in the 2-body analysis. |
Table_6.pdf [34 KiB] HiDef png [51 KiB] Thumbnail [21 KiB] tex code |

|
|
Correlation matrix for the systematic uncertainties in the 4-body analysis. |
Table_7.pdf [34 KiB] HiDef png [44 KiB] Thumbnail [19 KiB] tex code |

|
Supplementary Material [file]


![HiDef png [361 KiB]](Directory_LHCb-PAPER-2016-003/hidef_Fig1.png)
![HiDef png [392 KiB]](Directory_LHCb-PAPER-2016-003/hidef_Fig2.png)
![HiDef png [383 KiB]](Directory_LHCb-PAPER-2016-003/hidef_Fig3.png)
![HiDef png [399 KiB]](Directory_LHCb-PAPER-2016-003/hidef_Fig4.png)
![HiDef png [364 KiB]](Directory_LHCb-PAPER-2016-003/hidef_Fig5.png)
![HiDef png [407 KiB]](Directory_LHCb-PAPER-2016-003/hidef_Fig6.png)
![HiDef png [383 KiB]](Directory_LHCb-PAPER-2016-003/hidef_Fig7.png)
![HiDef png [258 KiB]](Directory_LHCb-PAPER-2016-003/hidef_Fig8a.png)
![HiDef png [222 KiB]](Directory_LHCb-PAPER-2016-003/hidef_Fig8b.png)
![HiDef png [166 KiB]](Directory_LHCb-PAPER-2016-003/hidef_Fig8c.png)
![HiDef png [143 KiB]](Directory_LHCb-PAPER-2016-003/hidef_Fig8d.png)
![HiDef png [180 KiB]](Directory_LHCb-PAPER-2016-003/hidef_Table_1.png)
![HiDef png [23 KiB]](Directory_LHCb-PAPER-2016-003/hidef_Table_2.png)
![HiDef png [53 KiB]](Directory_LHCb-PAPER-2016-003/hidef_Table_4.png)
![HiDef png [44 KiB]](Directory_LHCb-PAPER-2016-003/hidef_Table_5.png)
![HiDef png [51 KiB]](Directory_LHCb-PAPER-2016-003/hidef_Table_6.png)
![HiDef png [44 KiB]](Directory_LHCb-PAPER-2016-003/hidef_Table_7.png)
![HiDef png [529 KiB]](Directory_LHCb-PAPER-2016-003/supplementary/hidef_Fig10a.png)
![HiDef png [557 KiB]](Directory_LHCb-PAPER-2016-003/supplementary/hidef_Fig10b.png)
![HiDef png [517 KiB]](Directory_LHCb-PAPER-2016-003/supplementary/hidef_Fig11a.png)
![HiDef png [606 KiB]](Directory_LHCb-PAPER-2016-003/supplementary/hidef_Fig11b.png)
![HiDef png [564 KiB]](Directory_LHCb-PAPER-2016-003/supplementary/hidef_Fig12a.png)
![HiDef png [490 KiB]](Directory_LHCb-PAPER-2016-003/supplementary/hidef_Fig9a.png)
![HiDef png [511 KiB]](Directory_LHCb-PAPER-2016-003/supplementary/hidef_Fig9b.png)
Created on 02 May 2024.