Model-independent measurement of the CKM angle $\gamma$ using $B^0 \to D K^{\ast 0}$ decays with $D \to K_{S}^{0} \pi^{+} \pi^{-}$ and $K_{S}^{0} K^{+} K^{-}$
[to restricted-access page]Information
LHCb-PAPER-2016-006
CERN-EP-2016-083
arXiv:1604.01525 [PDF]
(Submitted on 06 Apr 2016)
JHEP 06 (2016) 131
Inspire 1444343
Tools
Abstract
A binned Dalitz plot analysis of the decays $B^0 \to D K^{\ast 0}$, with $D \to K_{S}^{0} \pi^{+} \pi^{-}$ and $K_{S}^{0} K^{+} K^{-}$, is performed to measure the observables $x_\pm$ and $y_\pm$, which are related to the CKM angle $\gamma$ and the hadronic parameters of the decays. The $D$ decay strong phase variation over the Dalitz plot is taken from measurements performed at the CLEO-c experiment, making the analysis independent of the $D$ decay model. With a sample of proton-proton collision data, corresponding to an integrated luminosity of $3.0 \rm{fb}^{-1}$, collected by the LHCb experiment, the values of the $CP$ violation parameters are found to be $x_+ = 0.05 \pm 0.35 \pm 0.02$, $x_-=-0.31\pm 0.20 \pm 0.04$, $y_+=-0.81\pm 0.28\pm 0.06$ and $y_-=0.31\pm 0.21 \pm 0.05$, where the first uncertainties are statistical and the second systematic. These observables correspond to values $\gamma$ = $(71 \pm 20)^\circ$, $r_{B^0} = 0.56\pm 0.17$ and $\delta_{B^0} = (204 ^{+21}_{-20})^\circ$. The parameters $r_{B^0}$ and $\delta_{B^0}$ are the magnitude ratio and strong phase difference between the suppressed and favoured $B^0$ decay amplitudes, and have been measured in a region of $\pm 50$ MeV/$c^2$ around the $K^{\ast}(892)^{0}$ mass and with the magnitude of the cosine of the $K^{\ast}(892)^{0}$ helicity angle larger than 0.4.
Figures and captions
|
Feynman diagrams of the (left) $ B ^0 \rightarrow D ^0 K ^{*0} $ and (right) $ B ^0 \rightarrow \overline{ D }{} {}^0 K ^{*0} $ amplitudes, which interfere in the $ B ^0 \rightarrow D K ^{*0} $ decay. |
Fig1.pdf [49 KiB] HiDef png [34 KiB] Thumbnail [16 KiB] *.C file |

|
|
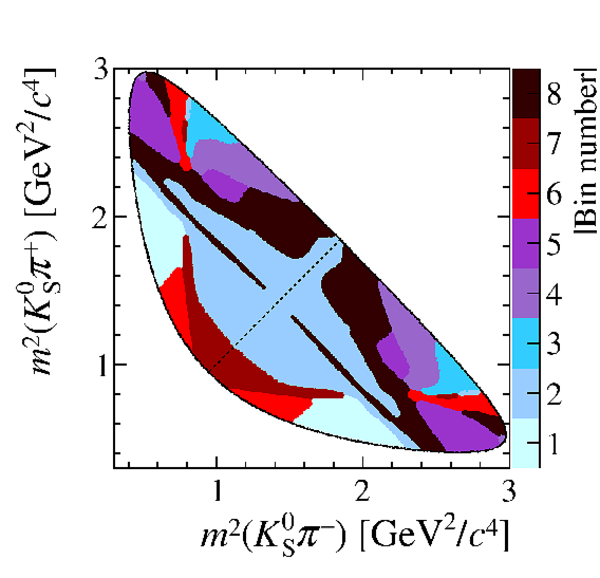
Binning schemes for (left) $ D \rightarrow K ^0_{\mathrm{ \scriptscriptstyle S}} \pi ^+ \pi ^- $ and (right) $ D \rightarrow K ^0_{\mathrm{ \scriptscriptstyle S}} K ^+ K ^- $ . The diagonal line separates the positive and negative bin numbers, where the positive bins are in the region $m^2_- \geq m^2_+$. |
Fig2a.pdf [276 KiB] HiDef png [496 KiB] Thumbnail [224 KiB] *.C file |
|
|
Fig2b.pdf [224 KiB] HiDef png [365 KiB] Thumbnail [173 KiB] *.C file |

|
|
|
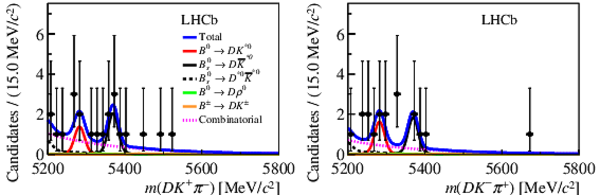
Invariant mass distributions of $ B ^0 \rightarrow D K ^{*0} $ candidates with (top) $ D \rightarrow K ^0_{\mathrm{ \scriptscriptstyle S}} \pi ^+ \pi ^- $ and (bottom) $ D \rightarrow K ^0_{\mathrm{ \scriptscriptstyle S}} K ^+ K ^- $ . The fit results, including the signal and background components, are superimposed. |
Fig3a.pdf [22 KiB] HiDef png [279 KiB] Thumbnail [221 KiB] *.C file |

|
|
Fig3b.pdf [20 KiB] HiDef png [232 KiB] Thumbnail [193 KiB] *.C file |

|
|
|
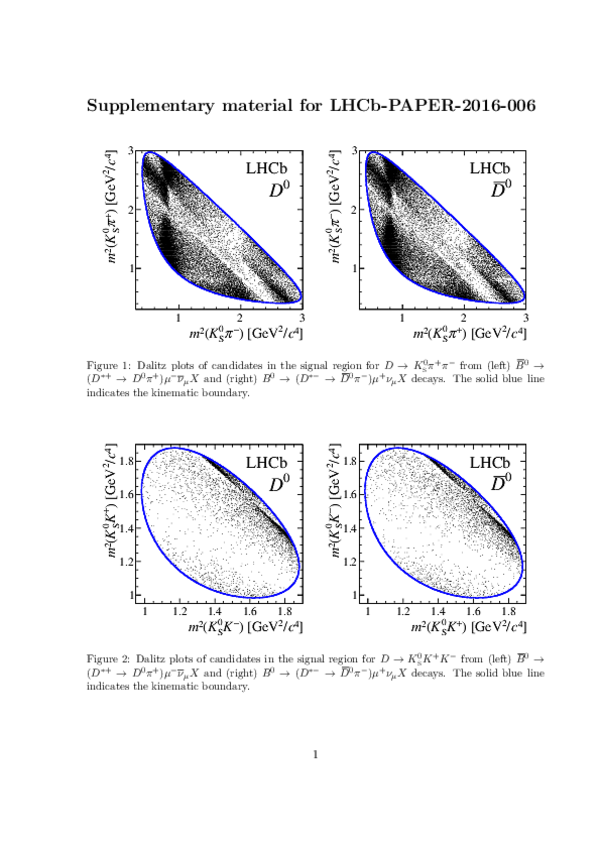
Dalitz plots of candidates in the signal region for $ D \rightarrow K ^0_{\mathrm{ \scriptscriptstyle S}} \pi ^+ \pi ^- $ decays from (left) $\overline{ B }{} {}^0 \rightarrow D\overline{ K }{} {}^{*0} $ and (right) $ B ^0 \rightarrow D K ^{*0} $ decays. The solid blue line indicates the kinematic boundary. |
Fig4a.pdf [30 KiB] HiDef png [198 KiB] Thumbnail [166 KiB] *.C file |

|
|
Fig4b.pdf [30 KiB] HiDef png [196 KiB] Thumbnail [162 KiB] *.C file |

|
|
|
Dalitz plots of candidates in the signal region for $ D \rightarrow K ^0_{\mathrm{ \scriptscriptstyle S}} K ^+ K ^- $ decays from (left) $\overline{ B }{} {}^0 \rightarrow D\overline{ K }{} {}^{*0} $ and (right) $ B ^0 \rightarrow D K ^{*0} $ decays. The solid blue line indicates the kinematic boundary. |
Fig5a.pdf [29 KiB] HiDef png [198 KiB] Thumbnail [161 KiB] *.C file |

|
|
Fig5b.pdf [29 KiB] HiDef png [199 KiB] Thumbnail [162 KiB] *.C file |

|
|
|
Result of the simultaneous fit to $ B ^0 \rightarrow D ^{*-} \mu^+\nu_\mu$ , $ D ^{*-} \rightarrow \overline{ D }{} {}^0 (\rightarrow K ^0_{\mathrm{ \scriptscriptstyle S}} \pi ^+ \pi ^- )\pi ^- $ decays with downstream $ K ^0_{\mathrm{ \scriptscriptstyle S}}$ candidates, in 2012 data. A two-dimensional fit is performed in (left) $m( K ^0_{\mathrm{ \scriptscriptstyle S}} h ^+ h ^- )$ and (right) $\Delta m$. The (blue) total fit PDF and the signal and background components are superimposed. |
Fig6a.pdf [31 KiB] HiDef png [251 KiB] Thumbnail [206 KiB] *.C file |

|
|
Fig6b.pdf [21 KiB] HiDef png [216 KiB] Thumbnail [165 KiB] *.C file |

|
|
|
Example efficiency profiles of (left) $ B ^0 \rightarrow D K ^{*0} $ and (right) $ B ^0 \rightarrow D ^{*-} \mu^+\nu_\mu$ decays in the simulation. The top (bottom) plots are for $ D \rightarrow K ^0_{\mathrm{ \scriptscriptstyle S}} \pi ^+ \pi ^- $ ( $ D \rightarrow K ^0_{\mathrm{ \scriptscriptstyle S}} K ^+ K ^- $ ) decays. |
Fig7a.pdf [231 KiB] HiDef png [1 MiB] Thumbnail [472 KiB] *.C file |

|
|
Fig7b.pdf [231 KiB] HiDef png [1 MiB] Thumbnail [465 KiB] *.C file |

|
|
|
Fig7c.pdf [237 KiB] HiDef png [1 MiB] Thumbnail [501 KiB] *.C file |

|
|
|
Fig7d.pdf [231 KiB] HiDef png [1 MiB] Thumbnail [463 KiB] *.C file |

|
|
|
Confidence levels at (solid) 68.3% and (dotted) 95.5% for (red, light) $(x_+,y_+)$ and (blue, dark) $(x_{-}, y_{-})$ as measured in $ B ^0 \rightarrow D K ^{*0} $ decays (statistical uncertainties only). The parameters $(x_+,y_+)$ relate to $ B ^0$ decays and $(x_{-}, y_{-})$ refer to $\overline{ B }{} {}^0$ decays. The points represent the best fit values. |
Fig8.pdf [18 KiB] HiDef png [212 KiB] Thumbnail [123 KiB] *.C file |

|
|
The three-dimensional confidence volumes projected onto the $(\gamma, r_{ B ^0 })$ and $(\gamma, \delta_{ B ^0 })$ planes. The confidence levels correspond to 68.3% and 95.5% confidence levels when projected onto one dimension and are denoted by solid and dotted contours, respectively. The diamonds mark the central values. |
Fig9.pdf [17 KiB] HiDef png [122 KiB] Thumbnail [67 KiB] *.C file |

|
|
Animated gif made out of all figures. |
PAPER-2016-006.gif Thumbnail |

|
![HiDef png [34 KiB]](Directory_LHCb-PAPER-2016-006/hidef_Fig1.png)
![HiDef png [496 KiB]](Directory_LHCb-PAPER-2016-006/hidef_Fig2a.png)
![HiDef png [365 KiB]](Directory_LHCb-PAPER-2016-006/hidef_Fig2b.png)
![HiDef png [279 KiB]](Directory_LHCb-PAPER-2016-006/hidef_Fig3a.png)
![HiDef png [232 KiB]](Directory_LHCb-PAPER-2016-006/hidef_Fig3b.png)
![HiDef png [198 KiB]](Directory_LHCb-PAPER-2016-006/hidef_Fig4a.png)
![HiDef png [196 KiB]](Directory_LHCb-PAPER-2016-006/hidef_Fig4b.png)
![HiDef png [198 KiB]](Directory_LHCb-PAPER-2016-006/hidef_Fig5a.png)
![HiDef png [199 KiB]](Directory_LHCb-PAPER-2016-006/hidef_Fig5b.png)
![HiDef png [251 KiB]](Directory_LHCb-PAPER-2016-006/hidef_Fig6a.png)
![HiDef png [216 KiB]](Directory_LHCb-PAPER-2016-006/hidef_Fig6b.png)
![HiDef png [1 MiB]](Directory_LHCb-PAPER-2016-006/hidef_Fig7a.png)
![HiDef png [1 MiB]](Directory_LHCb-PAPER-2016-006/hidef_Fig7b.png)
![HiDef png [1 MiB]](Directory_LHCb-PAPER-2016-006/hidef_Fig7c.png)
![HiDef png [1 MiB]](Directory_LHCb-PAPER-2016-006/hidef_Fig7d.png)
![HiDef png [212 KiB]](Directory_LHCb-PAPER-2016-006/hidef_Fig8.png)
![HiDef png [122 KiB]](Directory_LHCb-PAPER-2016-006/hidef_Fig9.png)
Tables and captions
|
Functional forms of the $DK\pi$ invariant mass distribution, $m$, in partially reconstructed decays of $ B ^0_ s \rightarrow ( D ^{*0} \rightarrow D ^0 \{\pi ^0 ,\gamma\})\overline{ K }{} {}^{*0} $, where either the $\pi ^0$ or $\gamma$ is not reconstructed. The $ D ^{*0}$ helicity state is given by $\lambda$. The quantities $a_X$ and $b_X$ are the minimum and maximum kinematic boundaries of the reconstructed $DK\pi$ invariant mass, where $X$ is the particle that is missed. |
Table_1.pdf [72 KiB] HiDef png [37 KiB] Thumbnail [18 KiB] tex code |

|
|
Results of the simultaneous fit to the invariant mass distribution of $ B ^0 \rightarrow D K ^{*0} $ decays, with the $ D $ meson decaying to $ K ^0_{\mathrm{ \scriptscriptstyle S}} \pi ^+ \pi ^- $ and $ K ^0_{\mathrm{ \scriptscriptstyle S}} K ^+ K ^- $ . |
Table_2.pdf [65 KiB] HiDef png [135 KiB] Thumbnail [67 KiB] tex code |

|
|
Summary of the systematic uncertainties for the parameters $ x_{\pm} , y_{\pm} $ . The various sources of systematic uncertainties are described in the main text. |
Table_3.pdf [56 KiB] HiDef png [164 KiB] Thumbnail [70 KiB] tex code |

|
|
Total correlation matrix, including statistical and systematic uncertainties, between the $ x_{\pm}$ , $ y_{\pm}$ parameters used in the extraction of $\gamma$. |
Table_4.pdf [38 KiB] HiDef png [37 KiB] Thumbnail [18 KiB] tex code |

|
![HiDef png [37 KiB]](Directory_LHCb-PAPER-2016-006/hidef_Table_1.png)
![HiDef png [135 KiB]](Directory_LHCb-PAPER-2016-006/hidef_Table_2.png)
![HiDef png [164 KiB]](Directory_LHCb-PAPER-2016-006/hidef_Table_3.png)
![HiDef png [37 KiB]](Directory_LHCb-PAPER-2016-006/hidef_Table_4.png)
Supplementary Material [file]
| Supplementary material full pdf |
supple[..].pdf [1 MiB] |
|
|
This ZIP file contains supplemetary material for the publication LHCb-PAPER-2016-006. The files are: supplementary.pdf : PDF containing the extra figures and some text *.pdf, *.png, *.eps, *.C : The figures in various formats |
Fig1a-supp.pdf [469 KiB] HiDef png [1 MiB] Thumbnail [547 KiB] *C file |

|
|
Fig1b-supp.pdf [476 KiB] HiDef png [1 MiB] Thumbnail [551 KiB] *C file |

|
|
|
Fig2a-supp.pdf [92 KiB] HiDef png [505 KiB] Thumbnail [383 KiB] *C file |

|
|
|
Fig2b-supp.pdf [93 KiB] HiDef png [514 KiB] Thumbnail [390 KiB] *C file |

|
|
|
Fig3-supp.pdf [23 KiB] HiDef png [187 KiB] Thumbnail [140 KiB] *C file |
|
|
|
Fig4a-supp.pdf [15 KiB] HiDef png [171 KiB] Thumbnail [95 KiB] *C file |

|
|
|
Fig4b-supp.pdf [15 KiB] HiDef png [164 KiB] Thumbnail [91 KiB] *C file |
|
![HiDef png [1 MiB]](Directory_LHCb-PAPER-2016-006/supplementary/hidef_Fig1a-supp.png)
![HiDef png [1 MiB]](Directory_LHCb-PAPER-2016-006/supplementary/hidef_Fig1b-supp.png)
![HiDef png [505 KiB]](Directory_LHCb-PAPER-2016-006/supplementary/hidef_Fig2a-supp.png)
![HiDef png [514 KiB]](Directory_LHCb-PAPER-2016-006/supplementary/hidef_Fig2b-supp.png)
![HiDef png [187 KiB]](Directory_LHCb-PAPER-2016-006/supplementary/hidef_Fig3-supp.png)
![HiDef png [171 KiB]](Directory_LHCb-PAPER-2016-006/supplementary/hidef_Fig4a-supp.png)
![HiDef png [164 KiB]](Directory_LHCb-PAPER-2016-006/supplementary/hidef_Fig4b-supp.png)
Created on 02 May 2024.