Information
LHCb-PAPER-2016-008
CERN-EP-2016-081
arXiv:1604.01412 [PDF]
(Submitted on 05 Apr 2016)
Phys. Rev. D93 (2016) 092007
Inspire 1444339
Tools
Abstract
A proton-proton collision data sample, corresponding to an integrated luminosity of 3 fb$^{-1}$ collected by LHCb at $\sqrt{s}=7$ and 8 TeV, is used to reconstruct $63\pm9$ $\Omega_b^-\to\Omega_c^0\pi^-$, $\Omega_c^0\to pK^-K^-\pi^+$ decays. Using the $\Xi_b^-\to\Xi_c^0\pi^-$, $\Xi_c^0\to pK^-K^-\pi^+$ decay mode for calibration, the lifetime ratio and absolute lifetime of the $\Omega_b^-$ baryon are measured to be \begin{align*} \frac{\tau_{\Omega_b^-}}{\tau_{\Xi_b^-}} &= 1.11\pm0.16\pm0.03, \\ \tau_{\Omega_b^-} &= 1.78\pm0.26\pm0.05\pm0.06 {\rm ps}, \end{align*} where the uncertainties are statistical, systematic and from the calibration mode (for $\tau_{\Omega_b^-}$ only). A measurement is also made of the mass difference, $m_{\Omega_b^-}-m_{\Xi_b^-}$, and the corresponding $\Omega_b^-$ mass, which yields \begin{align*} m_{\Omega_b^-}-m_{\Xi_b^-} &= 247.4\pm3.2\pm0.5 {\rm MeV}/c^2, \\ m_{\Omega_b^-} &= 6045.1\pm3.2\pm 0.5\pm0.6 {\rm MeV}/c^2. \end{align*} These results are consistent with previous measurements.
Figures and captions
|
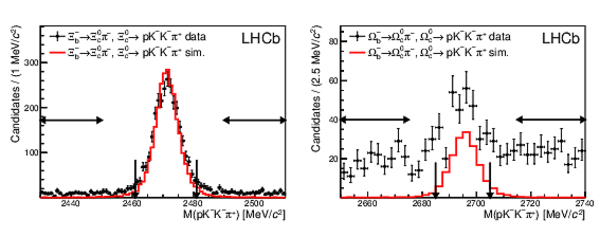
Invariant mass distribution for (left) $\Xi ^0_ c \rightarrow p K ^- K ^- \pi ^+ $ and (right) $\Omega ^0_ c \rightarrow p K ^- K ^- \pi ^+ $ candidates over the full $X_b$ fit regions. The corresponding simulations (sim.) are overlaid. The vertical arrows indicate the signal regions, and the horizontal ones show the sideband regions. |
XcMassComp.pdf [27 KiB] HiDef png [175 KiB] Thumbnail [153 KiB] *.C file |
|
|
Results of the simultaneous mass fit to the signal and calibration modes. The fitted $\Omega ^-_ b $ combinatorial (comb.) background yield is very small, and not clearly visible. |
Omb2Om[..].pdf [20 KiB] HiDef png [335 KiB] Thumbnail [240 KiB] *.C file |

|
|
Xib2Xi[..].pdf [21 KiB] HiDef png [275 KiB] Thumbnail [203 KiB] *.C file |

|
|
|
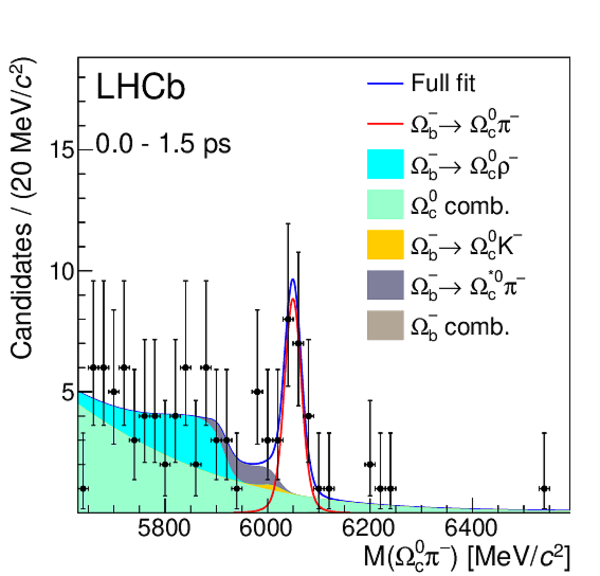
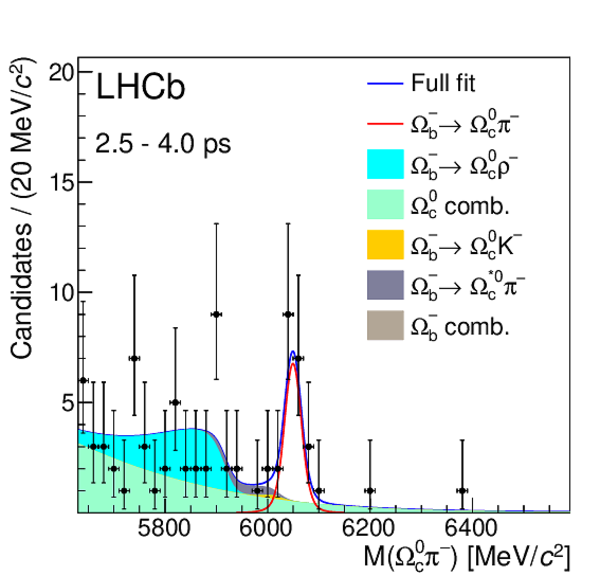
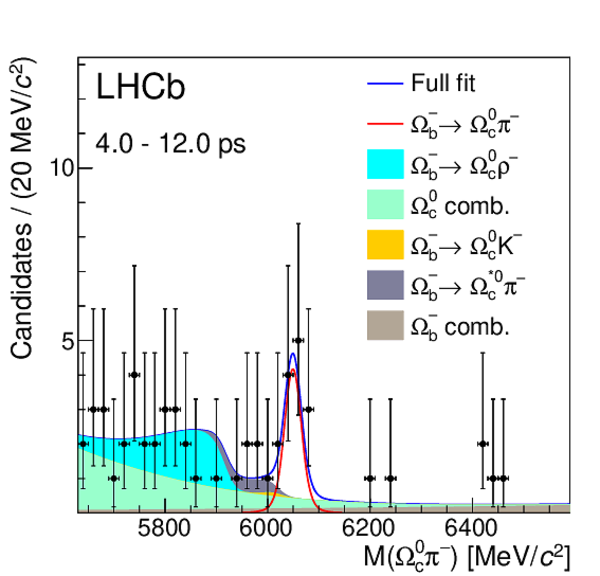
Results of the simultaneous mass fit to the $\Omega ^-_ b $ signal in the four decay time bins, as indicated in each plot. |
Omb2Om[..].pdf [19 KiB] HiDef png [297 KiB] Thumbnail [226 KiB] *.C file |
|
|
Omb2Om[..].pdf [18 KiB] HiDef png [289 KiB] Thumbnail [221 KiB] *.C file |

|
|
|
Omb2Om[..].pdf [18 KiB] HiDef png [280 KiB] Thumbnail [218 KiB] *.C file |
|
|
|
Omb2Om[..].pdf [19 KiB] HiDef png [285 KiB] Thumbnail [216 KiB] *.C file |
|
|
|
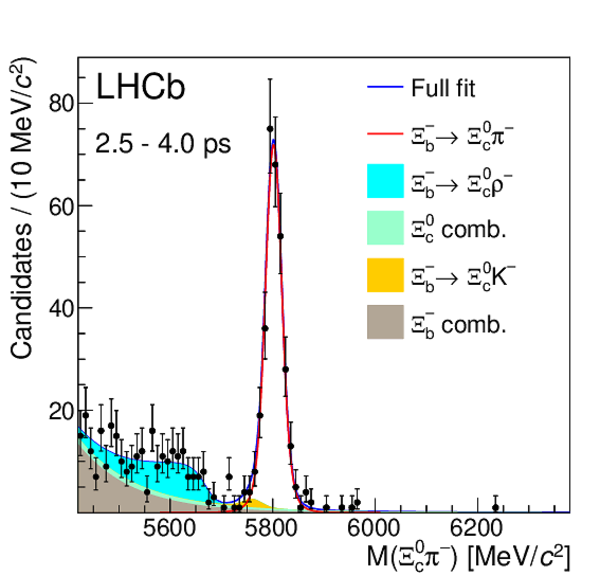
Results of the simultaneous mass fit to the $\Xi ^-_ b $ signal in the four decay time bins, as indicated in each plot. |
Xib2Xi[..].pdf [21 KiB] HiDef png [289 KiB] Thumbnail [213 KiB] *.C file |

|
|
Xib2Xi[..].pdf [21 KiB] HiDef png [279 KiB] Thumbnail [208 KiB] *.C file |

|
|
|
Xib2Xi[..].pdf [20 KiB] HiDef png [282 KiB] Thumbnail [214 KiB] *.C file |
|
|
|
Xib2Xi[..].pdf [20 KiB] HiDef png [267 KiB] Thumbnail [202 KiB] *.C file |

|
|
|
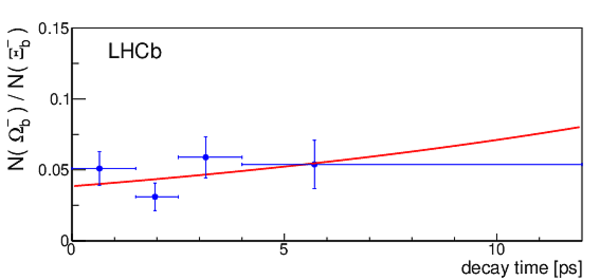
Corrected signal yield ratio as a function of decay time, along with a fit to an exponential function. The horizontal bars indicate the bin sizes, and are not an indication of the uncertainty. |
CorrYi[..].pdf [14 KiB] HiDef png [76 KiB] Thumbnail [55 KiB] *.C file |
|
|
Animated gif made out of all figures. |
PAPER-2016-008.gif Thumbnail |

|
![HiDef png [175 KiB]](Directory_LHCb-PAPER-2016-008/hidef_XcMassComp.png)
![HiDef png [335 KiB]](Directory_LHCb-PAPER-2016-008/hidef_Omb2OmcPi_OmbFit_def_Y0.png)
![HiDef png [275 KiB]](Directory_LHCb-PAPER-2016-008/hidef_Xib2XicPi_OmbFit_def_Y0.png)
![HiDef png [297 KiB]](Directory_LHCb-PAPER-2016-008/hidef_Omb2OmcPi_OmbFit_Omb_tbin_0.png)
![HiDef png [289 KiB]](Directory_LHCb-PAPER-2016-008/hidef_Omb2OmcPi_OmbFit_Omb_tbin_1.png)
![HiDef png [280 KiB]](Directory_LHCb-PAPER-2016-008/hidef_Omb2OmcPi_OmbFit_Omb_tbin_2.png)
![HiDef png [285 KiB]](Directory_LHCb-PAPER-2016-008/hidef_Omb2OmcPi_OmbFit_Omb_tbin_3.png)
![HiDef png [289 KiB]](Directory_LHCb-PAPER-2016-008/hidef_Xib2XicPi_OmbFit_Xib_tbin_0.png)
![HiDef png [279 KiB]](Directory_LHCb-PAPER-2016-008/hidef_Xib2XicPi_OmbFit_Xib_tbin_1.png)
![HiDef png [282 KiB]](Directory_LHCb-PAPER-2016-008/hidef_Xib2XicPi_OmbFit_Xib_tbin_2.png)
![HiDef png [267 KiB]](Directory_LHCb-PAPER-2016-008/hidef_Xib2XicPi_OmbFit_Xib_tbin_3.png)
![HiDef png [76 KiB]](Directory_LHCb-PAPER-2016-008/hidef_CorrYieldRatio_XibOverOmb_def.png)
Tables and captions
|
Results of the fit to data for each decay time bin, and the relative efficiency. The uncertainties are statistical only. |
Table_1.pdf [43 KiB] HiDef png [51 KiB] Thumbnail [27 KiB] tex code |

|
|
Summary of systematic uncertainties in $\delta m$ and the lifetime ratio. When two values are indicated, the first is a correction, and the second is the uncertainty. |
[Error creating the table] |
![HiDef png [51 KiB]](Directory_LHCb-PAPER-2016-008/hidef_Table_1.png)
Created on 02 May 2024.